FS Italiane Group Investor Presentation - June 2021
←
→
Page content transcription
If your browser does not render page correctly, please read the page content below
FS Italiane Group
                                       Investor Presentation

June 2021

            Informazione pubblica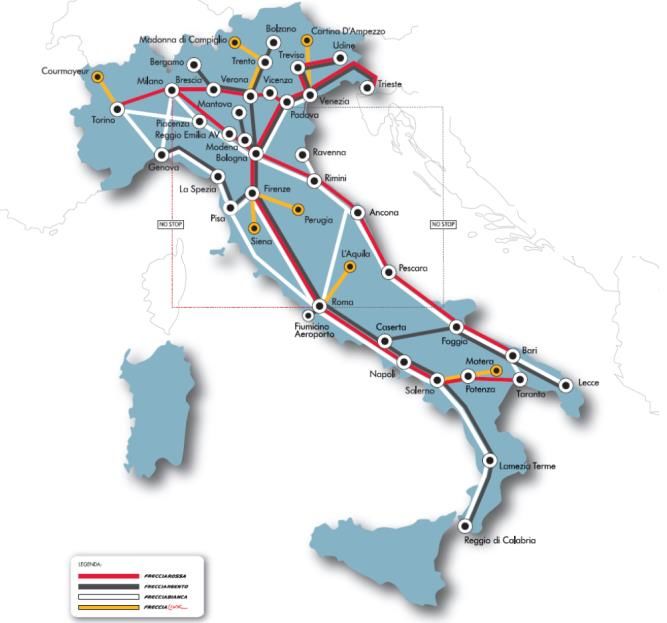
INDICE
                                                   CONTENTS
1   Ferrovie dello Stato Italiane Group Overview
2   Operations and Industry Overview
3   Corporate Sustainability
4   Sustainable Finance
5   Financial Overview
6   Contacts

                                                               2
               Informazione pubblica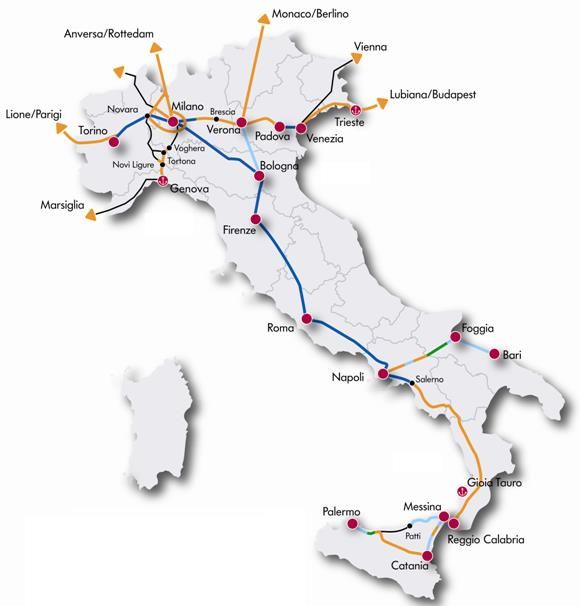
Disclaimer
IMPORTANT NOTICE – STRICTLY CONFIDENTIAL

By accessing this investor presentation, you agree to be bound by the following limitations.

 This presentation has been prepared by Ferrovie dello Stato Italiane S.p.A, is the sole responsibility of Ferrovie dello Stato Italiane S.p.A.. The information set out herein may be subject to updating, revision, verification and
amendment and such information may change materially. Ferrovie dello Stato Italiane S.p.A. is under no obligation to update or keep current the information contained in this presentation or in the presentation to which it relates and
any opinions expressed in them is subject to change without notice. None of Ferrovie dello Stato Italiane S.p.A. or any of its respective affiliates, advisers or representatives shall have any liability whatsoever (in negligence or
otherwise) for any loss whatsoever arising from any use of this presentation or its contents, or otherwise arising in connection with this presentation.

 This presentation is being communicated in the United Kingdom only to persons who have professional experience in matters relating to investments falling within Article 19(5) of the Financial Services and Markets Act 2000 (Financial
Promotion) Order 2005 and to persons to whom it may otherwise be lawful to communicate it to (all such persons being referred to as relevant persons). This presentation is only directed at relevant persons and any investment or
investment activity to which the presentation relates is only available to relevant persons or will be engaged in only with relevant persons. Solicitations resulting from this presentation will only be responded to if the person concerned
is a relevant person. Other persons should not rely or act upon this presentation or any of its contents.

 The information in this presentation is confidential and this presentation is being made available to selected recipients only and solely for the information of such recipients. This presentation may not be reproduced, redistributed or
passed on to any other persons, in whole or in part. This presentation is for information purposes only and does not constitute or form part of, and should not be construed as, any offer for sale or subscription of, or solicitation of any
offer to buy or subscribe for, any securities of Ferrovie dello Stato Italiane S.p.A. nor should it or any part of it form the basis of, or be relied on in connection with, any contract or commitment whatsoever. This presentation does not
constitute a recommendation regarding the securities of Ferrovie dello Stato Italiane S.p.A.

This presentation and the information contained herein are not an offer of securities for sale in the United States and are not for publication or distribution to persons in the United States (within the meaning of Regulation S under the
United States Securities Act of 1933, as amended.

 This presentation is for distribution in Italy only to "qualified investors" (investitori qualificati), as defined pursuant to Article 100 of Legislative Decree no. 58 of 24 February 1998, as amended and restated from time to time (the
Financial Services Act), and as defined in Article 34-ter, paragraph 1(b) of CONSOB Regulation no. 11971 of 14 May 1999, as amended and restated from time to time (the CONSOB Regulation), or in other circumstances provided under
Article 100 of the Financial Services Act and Article 34-ter, CONSOB Regulation, where exemptions from the requirement to publish a prospectus pursuant to Article 94 of the Financial Services Act are provided.

 This presentation may contain projections and forward-looking statements. Any such forward-looking statements involve known and unknown risks, uncertainties and other factors which may cause Ferrovie dello Stato Italiane S.p.A.’s
actual results, performance or achievements to be materially different from any future results, performance or achievements expressed or implied by such forward-looking statements. Any such forward-looking statements will be
based on numerous assumptions regarding Ferrovie dello Stato Italiane S.p.A.’s present and future business strategies and the environment in which Ferrovie dello Stato Italiane S.p.A. will operate in the future. Furthermore, any
forward-looking statements will be based upon assumptions of future events which may not prove to be accurate. Any such forward-looking statements in this presentation will speak only as at the date of this presentation and
Ferrovie dello Stato Italiane S.p.A. assumes no obligation to update or provide any additional information in relation to such forward-looking statements.

                                                                                                                                                                                                                                                 3
                                                                                                             Informazione pubblica
Ferrovie dello Stato Italiane
           Group Overview

    Informazione pubblica
FS Group in a snapshot
Ferrovie dello Stato Italiane SpA (“FS” or the “Issuer”) – 100% Italian State owned – is the holding company of the Italian railway group
(FS Group). As one of the largest industrial groups in the country, it manages rail and road networks and transport services by rail and
bus both passenger and freight, contributing to develop integrated mobility and logistics in Italy and abroad.

                                                                 100%

                                                                               Coordination and control
                                                                              of the whole industrial and
                                                                                   financial process

                                       INFRASTRUCTURE                          TRANSPORT SERVICES:                                                                          BUSINESS SUPPORT
                                                                                                                             STATIONS AND REAL                                  SERVICES:
     INFRASTRUCTURE                     OPERATION AND                                    Trenitalia
                                                                                                                                   ESTATE:
        DESIGNING:                      MAINTENANCE:                                     Busitalia                                                                              Italcertifer
                                                                                                                                    GS Rail
          Italferr                  Rete Ferroviaria Italiana                            Mercitalia                                                                              Fercredit
                                                                                                                               FS Sistemi Urbani
                                               ANAS                                        others                                                                               Ferservizi

                                        Group Revenue by segment (2020) **                                                  Consolidated Highlights (€mn)
                                                                                                                                        2020                2019
                                 Real Estate Services     Other services
                                         1%                    5%                                              Revenue                         10,837              12,435
                                                                                                               EBITDA                           1,633               2,609
                                                                                                               EBITDA Margin                    15.1%                 21%
                                                                                                               EBIT                              -278                 829
                           Infrastructure                                                                      EBIT Margin                      -2.6%                6.7%
                                43%                                                                            Net Income                        -562                 584
                                                                           Transport                           Net Invested
                                                                              51%                                                              50,316              49,977
                                                                                                               Capital
                                                                                                                                                                               Source: FS 2019-2020 Annual Report
                                                                                                               Equity                          41,423              42,318      **Net of (1,382)m of cons.adj.       5
                                                                                       Informazione pubblica   Net Financial Debt               8,893               7,659
Benchmarking with European rail players

                   (€b)                                 2016                 2017    2018           2019      2020             Issuer Rating
                   Revenue                                 8.9                9.3     12.1           12.4     10.8   S&P               BBB

                   EBITDA margin %                    25.7%                  25%    20.5%            21%     15.1%   Fitch             BBB-

                   EBIT margin %                         10%                 7.7%    5.9%           6.7%     -2.6%

                   (€b)                                 2016                 2017   2018          2019       2020              Issuer Rating
                   Revenue                               43.3            45.6       44            44.4       40.2    S&P                 AA
                   EBITDA margin %                    10.3%             9.9%        10%          12.2%      2.5%     Moody’s            Aa1

                   EBIT margin %                        3.4%            3.7%        4.7%          4.1%      -11.9%

                   (€b)                                 2016                 2017   2018          2019       2020              Issuer Rating
                   Revenue                               32.3            33.5       33.3          35.1       30      S&P                AA-

                   EBITDA margin %                    12.8%            13.7%        12%          16.1%      6.5%     Moody’s            Aa3

                                                                                                                     Fitch               A+
                   EBIT margin %                        6.6%             7.9%       6.7%          5.1%      -10%

         Source: FS, DB, SNCF Annual Reports and rating agencies’ websites
                                                                                                                                               6
                                                                                    Informazione pubblica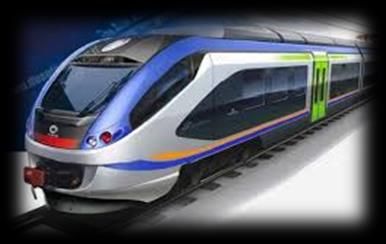
Rating Overview
RATING COMMENTS
FS' rating reflects the:
Issuer • “very important” role for the Italian government as holding group of the country’s national railway and the
Rating BBB “integral” link with its sole owner (Italian Govt)
Outlook • “Strong” business risk profile: «…dominant market position in the Italian transport segment and network
Stand NEGATIVE concessionaire…the vertical integration combines infrastructure manager and transportation services and gives
Alone earnings operating stability»
Credit bbb+
• “Intermediate” financial risk profile: FFO/Debt commensurate with a 'bbb+‘ SACP and adequate liquidity position
Profile
On 18st February 2021, S&P assessed the FS profile also in light of the COVID-19 crisis impact
Rating confirmed on The rating affirmation is based on the analysis by the agency of the financial strength, which has allowed
FS to deal with the lockdown period leveraging on a higher standing than its European peers.
18th February 2021
S&P’s expectation is that FS will preserve solid financial metrics, supported by both internal actions on
operating and investment cost containment as well as by the extraordinary measures approved by the
Government, as well as the forecast of a solid liquidity position.
FS' rating reflects the:
Issuer • Full ownership and high integration with the Italian government and its key role for railway transport and mobility
Rating BBB-
in Italy as well as the national infrastructural development
Outlook
• Revenue Defensibility: «…FS's solid position in its historical market, Italy…..supportive regulatory regime for public
Stand STABLE
service contracts (PSC), with regional authorities compensating for transport services provided through a stable
Alone history of operating grants and taking the bulk of the traffic risk themselves»
Credit bbb-
Profile • Financial profile: «…Fitch expects FS to maintain strong operating cash flow generation capacity»
On 7th December 2020, Fitch assessed the FS profile also in light of the COVID-19 crisis impact :
Rating confirmed on
Fitch assessed that FS Group preserves a moderate debt level, compared to the EBITDA available for its
7th December 2020 service.
Source: S&P and Fitch reports. Please refer to the rating agencies’ websites for further information.
7
Informazione pubblica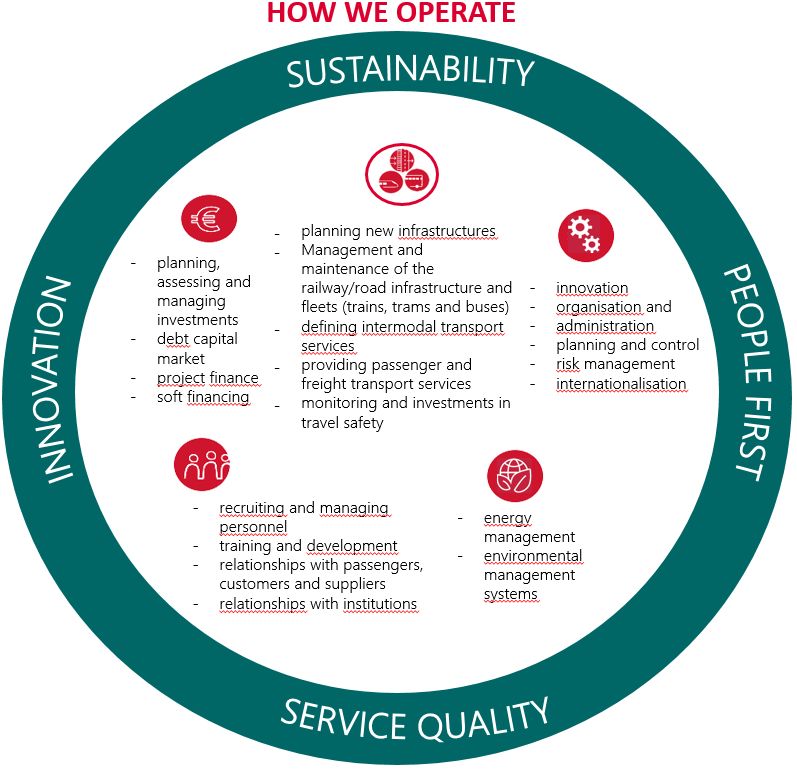
Operations and Industry
             Overview
                         Infrastructure

 Informazione pubblica
RFI: Railway Infrastructure Manager
                         Key figures                                                                               High Speed Network                     Traditional network
   €mn                                         2019            2020
   Revenues                                    2,799           2,492
              Track access charges             1,182             762
                       CdP-Service             1,022           1,291
                     Other services               319             265
               Real estate services              113             105
                     Other income                163              69
   EBITDA                                        481             333
   EBITDA margin %                               17%             13%
   EBIT                                          350              71
   EBIT margin %                                  12%              3%
  Net Income                                      302              38

                                                                                                  Draft

                                                                                                  Work In progress
  NETWORK HIGHLIGHTS 2020                                                                         Operating (HS)

                                                                                                  Operating (HS up to 250 km\h)

  16,782 km Lines
                                                                                                                                  INVESTMENTS 2020 € 4,917 million,
  12,065 km Electified Lines
                                                                                               including €549m for suppliers contractual advances
  23,048 km Traditional tracks                                                             Almost 100% funded by the Programme Agreement 2017-2021
  1,467 km High Speed tracks                                                              98% Traditional network                                     51% Maintenance and Safety
                                                                                          2% High Speed network                                       49% Network Development

                   Source: Company information; FS Annual report; RFI Annual report and RFI Website                                                                                9
                                                                                                                   Informazione pubblica
ANAS: road infrastructure
• ANAS is part of FS Group since January 2018, following the equity transfer from
the MEF.
• With ANAS, alongside RFI, FS group is now Europe’s largest integrated rail and
road hub in terms of both number of people serviced and investments Financial highlights
€mn 2019 2020
Designing, construction and maintenance Revenues 2,163 2,343
of national roads EBITDA 128 167
Concessionaire of 29,000 km of roads
~ 1,300 km of highways Programme Agreement 2016-2020 signed with the MIT
47%
INVESTMENTS 2020 € 2,015 million, routes completion
and new projects
including €465m for suppliers contractual
advances
Fully funded by the Programme Agreement 29.9 bn
53%
ordinary
maintenance and
safety upgrade
10
Informazione pubblicaOperations and Industry
Overview
Transport
Informazione pubblicaTrenitalia: rail passenger transport in Italy and abroad
Financial highlights
Key highlights
€mn 2019 2020
• Everyday manages about 9,000 trains and each year transports c. 600 million Revenues 5,531 3,905
passengers EBITDA 1,626 826
• Trenitalia is also abroad with c2c (since 2017) and the West Coast Partnership EBIT 524 -208
(since 2019) in UK, Thello in France, Trainose in Greece and Netinera Group
active in Germany (previously directly owned by FS). Also, in May 2020, Net Income 385 -423
Trenitalia won the tender for operating the high-speed services in Spain for EBITDA Margin 29% 21%
the next 10 years.
EBIT Margin 9.4% -5.3%
Two business segment
INVESTMENTS 2020 € 1,417 million*
58% new rolling stocks
24% rolling stocks maintenance*
Medium Long distance revenues (€mn) Regional revenues (€mn)
High Speed services Commuter 12% IT, technologies and plants
International and 2019 2020 Change 2019 2020 Change
passenger services
regulated domestic 2,923 2,392 -18%
services (PSC with the
2,580 1,474 -43% PSC Regional
services
6% revamping rolling stocks
State)
* Includes hard maintenance
Source: Company information, Trenitalia Annual Report 12
Informazione pubblicaFocus: High Speed Transport
Frecce network • The Medium\Long Haul Passenger Division ensures the national and international
passenger transportation, including High Speed services
• The Italian High Speed network connects the main metropolitan areas of the country
and it has been the key element for the modal shift from plane to rail in Italy
Milan – Rome route modal share
Highway Air Train
100%
Group’s most 80% 36% 36%
44% 49%
55% 57% 61% 63% 62% 60%
64%
impacted business 60%
67% 69% 74%
segment by the 40%
pandemic with
20%
-43% in revenues
0%
2007 2008 2009 2010 2011 2012 2013 2014 2015 2016 2017 2018 2019 2020
Launch of the ‘Frecce’ network
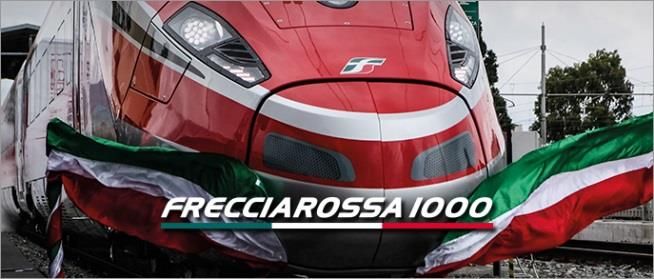
The ETR 1000, named “Frecciarossa 1000” is the new high-speed train
of Trenitalia, comfortable, safe and environmentally friendly, designed
to meet the most advanced techniques. Eligible Green
Able to travel on all European high-speed networks. Project
The fleet counts 50 ETR 1000 with the last delivered in January 2018
Part of fleet was funded via the two green bond issued by FS in
November 2017 and July 2019
13
Informazione pubblica Source: Company informationFocus: Regional Transport
Overview Trenitalia regional services portfolio as of today
• Offers urban, regional and interregional mobility 9ys* 2ys(a)
5ys
Longer PSCs
• Business with local administrations is regulated by 5+5ys Trenord 15ys enable more
different Public Service Contracts (‘PSCs’) 15ys** fleet
15ys 22ys
• PSCs are subject to specific regulation in terms of investments
eligible costs and adequate capital investments 15ys 15ys
returns Trenitalia has been renewing 15ys Eligible Green
Project
Public Service Contracts with a 9ys*
• In 2020 revenues related to regional passenger much longer duration (10- 15ys 9ys*
15years) with all 20 Italian 15ys
services equal to € 2,4mn (-18% vs. 2019) 15ys
regions
9ys*
• Fees from regions stable also in 2020
9ys 15ys
10ys
* negotiation ongoing for new 10 years PSCs
** Turin Metropolitan, the rest of the regional services expected
to be directly assigned
(a) negotiation ongoing for a new 10 years PSC
14
Informazione pubblicaBusitalia: road passenger transport in Italy and abroad
For an integrated mobility
Key highlights
Financial highlights
• Busitalia provides local bus transport, both urban and suburban, in Veneto (regionally and
locally in Padova after winning the public tender), Tuscany, Umbria and Campania €mn 2019 2020
• In August 2017 Busitalia acquired Qbuzz, the Dutch company which operates public bus Revenues 691 650
transport services in the Netherlands
EBITDA 65.8 79.1
• In 2018 Qbuzz won public transport 8ys concessions in DNG and Groningen-Drenthe areas 9.5% 12.2%
EBITDA Margin
• Busitalia also operates the replacement of rail services by bus including Freccialink
One of Italy’s top players (a) FLEET INVESTMENTS 2020 € 152 million
Production Investments
800
Revenues since 691
700 624 650
108 mn Bus-Km in Bus fleet 600 business inception 472
renewal 500
354
Passengers ongoing 400
293
330
300
220 mn/year towards green 200
203
fuel (electric, 100
hybrid etc.) 0
€mn 2013 2014 2015 2016 2017 2018 2019 2020
(a) 2019 data, Italy only.
Source: Company information; Busitalia Annual Reports 15
Informazione pubblicaMercitalia: freight and logistics services
Integrated governance for the freight services
The new Mercitalia Hub, with Mercitalia Logistics as sub-holding has been created with the aim of restructuring the cargo business and rationalize the
freight operators active in the Group to improve quality and efficiency of cargo services provided
Increase and strengthen the presence in the intermodal transport segments
Financial highlights
Develop operating synergies to increase competitiveness and market share €mn 2019 2020
Revenues 1,060 970
EBITDA 94 89
EBITDA Margin 8.8% 9.2%
Investments 2020: 77 million mainly for fleet upgrading
New electric locomotives and wagons together with technology upgrades will Eligible Green
Project
enhanced the Group cargo fleet
16
Informazione pubblicaCorporate Sustainability Informazione pubblica
A business model which fully integrates sustainability
 FS sustainability approach permeates the full organizational structure ensuring integration of environmental, social and economical aspects within
                                                            strategic business decisions
       FS Group vision is to create an offer of integrated, sustainable and safety mobility and logistics services, using transport infrastructures in synergy with other
                                                                operators and creating value in Italy and abroad

                                                                                                                                SUSTAINABILITY RATING

                                                                                                                                            A- (Leadership band)

                                                                                                                                                     Robust

                                                                                                                                            ESG Risk assessment:
                                                                                                                                                  Low Risk

                                                                                                                                               C- (Prime Status)

                                                                                                                                                                            18
                                                                                Informazione pubblica
FS Group Sustainability Commitment
Our agenda for a sustainable mobility
The Group is committed to six of the SDGs UN Global Compact subscribed in 2017 in particular, which constitute the base for the long-term targets:
FS GROUP LONG TERM GOALS 2030-2050
Contribution on the
Objective Target
SDGs
Sustainable mobility Passengers: 5% modal shift from privately- owned cars to shared public mobility and soft
Increase the percentage of passengers modes of transport by 2030 (15% by 2050),
and freight transported using alternative, compared to 2015.
collective mobility solutions Freight: 50% of transport by road and 50% of transport by rail by 2050 (for distances over 300
km).
Energy and emissions
Carbon-neutral by 2050 (including traction)
Achieve a carbon-neutral energy mix
Zero fatalities involving passengers on FS Group vehicles (trains, buses and other mobility
Safety systems), people interfering with the railway ecosystem, FS Italiane Group personnel and
Become Europe’s best-in-class employees of contracting companies, by 2050.
50% fewer fatalities on roads operated by Anas by 2030, compared to 2015
19
Informazione pubblicaSustainable Finance Informazione pubblica
Sustainable finance endorsing a sustainable strategy

                Increased awareness of the importance to strive for a more sustainable business,
           FS financial decisions essential and strategic to allocate the new debt sources to the most
                              effective investments complying with the ESG principles

                     • Since our first green bond issuance in 2017 Ferrovie corporate finance started up a new path on the tracks of the
                       corporate sustainability, with the finance decisions becoming one of the strongest drivers in this respect
                     • Since it’s inception, the Green Bond Framework has been earmarked to the financing of investments for the
        Green Bond     renewal of rail passengers transport fleet both in the High Speed and Regional sector and then expanded also to
        Framework      the freight business in 2019

                      • For 2020 FS expanded the concept of the sustainable finance to other capital markets tools
                      • To fund other «green» investments than the Eligible Green Projects of the Green Bond
      New Sustainable   Framework, which will remain addressed to green bond funding
         Finance

                                                                                                                                           21
                                                               Informazione pubblica
FS Green Bond Framework established in 2017
Use of Proceeds
• FS strongly believes that rail and public transport are critical for sustainable development and global efforts to combat climate
change, by facilitating the modal shift away from cars and trucks into less carbon intensive modes of transport.
ELIGIBLE GREEN PROJECTS
FS may
To ensure energy efficiency improvements, carbons emission reduction and modal shift to rail both for the local and decide to
long distance public transport and for freight transport, among other improvements related to air quality and comfort for
passengers and safety for freight forwarding
include
additional
• Investments in passengers transport rolling stock renewal Project
Categories
NEW ELECTRIC TRAINS FOR REGIONAL PASSENGER for future
NEW ELECTRIC HIGH SPEED TRAINS “ETR 1000”
TRANSPORT issuances
• Investments in freight transport rolling stock renewal* Look-back
NEW ELECTRIC LOCOMOTIVES FOR FREIGHT period of 3
NEW WAGONS FOR FREIGHT TRANSPORT
TRANSPORT years
* In the GBF since June 2019 and aligned with criterion 5 of Transport criteria - Low Carbon Land Transport and the Climate Bonds Standard. In 2020 MIR transported 0,00016% of the
ONU Codes 1972 (natural gas) as fossil fuel, on the total tons of transported goods 22
Informazione pubblicaGreen Bond Framework – SDGs Mapping
• The FS Green Bond Framework addresses 3 of 17 UN Sustainable Development Goals.
• The mapping has been inspired by the ICMA high-level mapping to SDGs* and existing practices of issuers of Green
Bonds in the transportation sector.
SDG 9.1: Develop quality, reliable, sustainable and resilient infrastructure, including regional and transborder
infrastructure, to support economic development and human well-being, with a focus on affordable and
equitable access for all
SDG 11.2: By 2030, provide access to safe, affordable, accessible and sustainable transport systems for all,
improving road safety, notably by expanding public transport
SGD 12.2: By 2020, achieve the environmentally sound management of chemicals and all wastes throughout
their life cycle, in accordance with agreed international frameworks, and significantly reduce their release to
air, water and soil in order to minimize their adverse impacts on human health and the environment
SDG 12.5: By 2030, substantially reduce waste generation through prevention, reduction, recycling and reuse
* https://www.icmagroup.org/assets/documents/Regulatory/Green-Bonds/June-2019/Mapping-SDGs-to-Green-Social-and-Sustainability-Bonds06-2019-100619.pdf
23
Informazione pubblicaExternal Reviews
Best practice
Sustainalytics provided a Second Party Opinion on the Green Bond Framework and a Pre-issuance
verification on the Climate Bonds Initiatives standard
FS obtained the Climate Bonds certification on its second green bond. CBI confirmed certification for
potential 2021 green bonds
KPMG provided a Third Party Opinion on the Green Bond Report
Ferrovie ’s
Ferrovie Green Bond Impact of Use of Proceeds
sustainability
Framework
strategy
“Ferrovie’s Green Bond Framework “Ferrovie has demonstrated a “Given the declared (estimated) energy improvements of
is credible and impactful, and commitment to integrate sustainable the new electric trains compared to previous models, as
aligns with the four core practices into its business strategy and well as recyclability of the trains, Sustainalytics is of the
components of the GBP 2018.” operations, as aligned with its strategic opinion that the eligible category contributes to
vision” increased sustainability and energy efficiency of
Ferrovie’s operations and the transport system in Italy.”
Sustainalytics believes that the eligible category is aligned with Ferrovie’s overall sustainability strategy and efforts, and will also
contribute to the advancement of UN SDGs, specifically 9, 11, and 12.
Based on the above, Sustainalytics is confident that Ferrovie is well-positioned to issue green bonds, and that Ferrovie Green Bond
Framework is robust, transparent and in alignment with the Green Bond Principles 2018.
24
Informazione pubblica3 Green Bonds for a total 2.3 billion euro issued so far
allocation and environmental impact
ELECTRIC NEW REGIONAL ELECTRIC NEW HIGH-SPEED ELECTRIC NEW FREIGHT LOCOMOTIVES
TRAINS POP & ROCK TRAIN ETR1000 and WAGONS
€1,315 million* €867 million* €118 million
*Including
€ 1 billion
latest green
40 loco
bond 150 trains 26 trains
140 wagons
issued on
25th March
2021
Total 33,600 tCO2 saved* in 2018 and 2019 (~-20% CO2
emissions) thanks to the first 2 green bond
FS will keep on green issuance to complete regional and high speed fleet upgrading
and to fund further «green» investments 25
* vs. oldest trains Informazione pubblicaFS Green Bond Framework vs EU Taxonomy
A challenging approach
Ferrovie GBF Eligible Green Projects EU Taxonomy Criteria for rail transport
Electric trains
PLUS energy
efficiency
improvement
vs oldest fleet
All electric
trains are
eligible without
improvement
thresholds
26
Informazione pubblicaSustainable finance
transactions in 2020-2021
Sustainibility-Linked • Euro 2.5 billion Sustainable Revolving Credit Facility signed on 25 June 2021
RCF
• Margin and Commitment Fee linked to Group’s sustainability KPIs
• Euro 1 billion of green bond issued on 25 March 2021 to finance new regional
Green Bond and high speed train of Trenitalia
• Euro 300 million bank loan signed in May 2020, with an ESG Tranche financing Trenitalia new
Frecciargento electric trains, totally aligned with the EU Taxonomy standards
Green Loan
• Structured to seize the opportunities created by the ECB’s measures
• The ESG Tranche guarantees a lower pricing in respect to the total cost of financing
EU Taxonomy aligned • Euro 890 million of Trenitalia rolling stocks for public service financed in 2020
private placement and 2021 via Eurofima are aligned with the EU Taxonomy standards
• Up to Euro 450 million EIB “climate action” financing approved for the new Hybrid
«Climate action» EIB regional trains in July 2020
financing
• Euro 150 million already subscribed by the EIB via a EMTN private placement
27
Informazione pubblicaSustainability Linked Revolving Credit Facility
Euro 2.5 billion 3 years committed facility
• First sustainability linked transaction for FS
• Margin and Commitment Fee linked to 4 KPIs on Group’s effort on Environmental, Social and Governance targets
• Underwritten by a pool of 6 primary banks
• The new Euro 2.5 billion size will meet Group funding needs in the near future, also considering its leading role in
implementing the Italian PNRR.
KPI 2 – REDUCING KPI 3 – EASY STATIONS KPI 4 – INTEGRATED
KPI 1 – IMPROVING ESG GENDER GAP IN MOBILITY (facilitate
(facilitate accessibility
RATING MANAGEMENT modal-shift to rail)
and mobility)
POSITIONS
28
Informazione pubblicaFinancial Overview Informazione pubblica
Robust historical financial performance
13,000
12,500 12,078 12,435
Historically increase in revenues and
12,000 margins generated a solid background to
11,500 face the unexpected COVID crisis
2.609 Revenues
11,000
10,500
2.476 10,837 • Significant costs containment in 2020 due to
10,000
1.633
EBITDA
extraordinary action taken in response to the
9,826
9,500 pandemic
8,928 9,299 9,602 9,204
9,000
8,500
8,585
2.313
Operating Costs • 2020 EBITDA decrease reflects reduction in
8,000
revenues due to the pandemic outbreak
1.975 2.293
7,500
7,000
• Still double digit EBITDA Margin in 2020
6,986
6,500 6,610 6,635
6,000
€mn 2015 2016 2017 2018 2019 2020
Consistent profitability and margins
3,000 2,609 25.0%
2,476 20.5% 21.0%
2,500
20.0%
2,000 15.1%
1,633 15.0%
1,500
829 10.0% 6.7%
1,000 714 5.9%
559 584
€mn 500 5.0%
0 0.0%
2018 2019 2020 2018 2019 2020
-500 -278 -5.0% -2.6%
-1,000 -562
EBITDA EBIT Net Income EBITDA Margin EBIT Margin
30
Informazione pubblica2020 Group Revenues
Limited downturn despite COVID-19 impact thanks to government support
Consolidated Revenues (€mn) Key impacts and changes in 2020 vs. 2019
14,000
-1,586 • Fees for long-haul railway transport regulated services stable
million
12,435
-12.8% • Fees for regional railway transport regulated services stable
12,000
10,837 • Revenues from infrastructure Programme Contracts – both RFI and
ANAS – stable
10,000
COVID related government grants of +€1,040 million
8,000
6,000 • Traffic revenue from long-haul railway passenger transport
decreased by €1,372 million 64% drop in demand and 50% loss of
4,000 saleable seats\km
2,000
• Traffic revenue from domestic short-haul railway passenger
transport decreased by €511 million
0 • Traffic infrastructure revenues down by €357 million mainly related
2019 2020
to motorway and railroad traffic toll
31
Informazione pubblicaGroup revenues breakdown
• Passenger sector most impacted from the COVID-19 pandemic effect
• Share of public sector vs. market revenues increased due to lower traffic volumes and stability in fees from public
service contracts
GROUP REVENUES GEOGRAPHIC
GROUP REVENUE BY SEGMENT TRANSPORT REVENUES: MARKET VS. PSC
DISTRIBUTION
1%
2%
5%
37%
12%
3% 53%
1%
39%
51%
43% 58%
63%
47%
2019
86%
2020 2019 2020
Transport Infrastructure Real Estate Services Other services Market revenues Public service contract fees Italy Europe Non EU
32
Informazione pubblicaCOVID-19 Government support
Extraordinary measures for the FS Group
• Strong committment from the Italian Government in supporting the national railway and public transportation system
• FS Group vital role for Italian GDP as well as the essential social service for the country
• Government has partially compensate FS Group through grants
MAIN COVID-19 SUPPORTING MEASURES FOR FS GROUP Overall Euro
1,040 million
€ 270 million for RFI in 2020 plus € 150 million in 2021-2034 to set-off decrease in
revenues from TAC
recognized in
INFRASTRUCTURE 2020 for the
€ 151 million for ANAS in 2021-2034, recognized in 2020 financial statement as NPV, to whole Group
set-off decrease in revenues for maintenance.
TRANSPORT MARKET • Overall € 1.190 million for railway operators for market services in 2020-2034 to set-
– PASSENGERS AND off decrease in traffic revenues • Euro 365 million already
FREGHT • Euro 365 million already approved for Trenitalia by the EU Commission and approved by the
European Commission
recognized in 2020 financial statement
for the passenger
TRANSPORT PUBLIC • Overall maximum amount of €1,000 million in 2020-2021 for local public transport services (period 8 March-
30 June 2020).
SERVICE - PASSENGERS companies, to set-off decrease in traffic revenues for public service contract.
• Overall measure
• € 193 million for Group’s companies recipients recognized for 2020 under this assessment by the EU is
measure. on-going.
• € 103 million by foreign governments (Germany and Greece) recognized for 2020.
33
Informazione pubblicaFocus on operating costs
Significant costs containment to face the COVID impact
• In 2020 operating costs amounted to €9,204 million (-6.3% vs 2019)
Overall decrease of €610 million due to extraordinary actions (savings of €652 million) taken by management in response to the pandemic
Main action on personnel expense (-€345 million) as a result of pension eligibility, income assistance fund for extraordinary solidarity benefits,
use of holidays accrued in previous years
Breakdown of operating costs Total operating costs by division
6,000 7,000
6,262
4,853 4,945
5,000 4,741 6,000
4,371 5,306
5,000 4,675 4,603
4,000 Personnel expense Transport
4,000
3,000
Raw materials Infrastructure
3,000
2,000 1,599 1,491
Services 2,000
Real Estate
1,000 1,000 612 Services
432
Other costs incl. 119 95
€mn 0 Capitalisation €mn 0 Other services
2019 2020 2019 2020
-1,000
-1,000
Cons. Adj.
-1,221 -2,000 -1,412
-1,351 -1,678
-2,000
-3,000
34
Informazione pubblicaFS Group’s CAPEX profile
Leading investor in development of transport, infrastructure and logistics
• Despite the context, in 2020 FS’s capital expenditure exceeded €6.5 billion in line with 2019 (€ 6,693 million, excluding ANAS, of
which €4,352 million through government grants mainly earmarked to rail infrastructure).
• The majority of capex went to maintenance and development of the rail infrastructure network carried on by RFI, with a focus
on Traditional network (~ €4.2bn). Rail infrastructure capex is almost totally funded by the Government as per the “Contratto di
Programma” between Ministry of Infrastructure and Transport and RFI.
• Trenitalia accounted for 21% (€1,417 million).
FS Capex in 2017 - 2020 2020 capex breakdown
8,000 Mercitalia
Group Other capex
6,943
7,000 6,693 1% 2%
5,871 Busitalia
6,000 5,407 Group
5,000 2%
Trenitalia
4,000
21%
3,000 2016
RFI
2,000 74%
2017
1,000
€mn 0
2017 2018 2019 2020
Capex excludes Anas S.p.A. and FSE S.r.l. investments recognised pursuant to
IFRIC 12 ANAS investments in 2020 accounted for € 2,015 million
35
Informazione pubblicaFS’ debt profile
Funding diversification
• Total gross financial debt (long term + short term) amounts to € 11,565mn at YE 2020 vs. €11,306mn at YE 2019. The bulk of FS
Group’s debt is held by FS Holding (€ 9,086mn, 78% of total).
• Part of FS' debt is funded directly through guaranteed State transfers. This debt is earmarked to infrastructure investments.
• Net Financial Debt amounts to € 8,893mn at YE 2020 increasing by 1,234 million on YE 2019, mainly due to new debt raised for
capex; decrease in cash pooling balance (from 2020 payments by the MEF to RFI in accordance with the Programme Contract are
made on a dedicated account) and decrease in financial asset from MEF due to collections of the year.
Breakdown Financial sources 2012 - 2020 (a)
Strong Liquidity Position
EMTN Bonds Supranational Entities Bank Loans
Eur 2.5 bn Sustainability-Linked
12% Committed RCF signed 25 June 2021
13% EMTN bonds in with 6 primary banks
11% 13% CSPP since July
12% 2016 as well as
in the
45%
Pandemic Access to Capital Markets
2012 54% Emrgency
34% Eur 7 bn EMTN Programme
88% Purchase
42% 76% 2013
Programme EIB
2018 PEPP
Cdp
2020
Eurofima
(a) These percentages are calculated on the long term debt held by FS\RFI\TI 36
Informazione pubblicaBalanced debt maturity profile
Effective management of financial expense
• The Group has a balanced debt maturity profile extending over the next 15-20 years
• Historically low borrowing costs and an effective management of financial costs, including interest rate risk management policies, has resulted in a
containment of interest expense on debt, generating value for the Group.
Group long term debt maturity profile as of 30 June 2021* Interest expense on Group’s financial liabilities **
1,600
1,400
2.7%
1,200 2.4%
1,000
1.8%
1.7% 1.7% 1.8%
800 1.5%
600
400
200
0
€mn 2021 2022 2023 2024 2025 2026 2027 2028 2029 2030 2031 2032 2033 2034 2035 2036 2037 2038 2039 2040 2041 2014 2015 2016 2017 2018 2019 2020
uncovered covered by State tranfers
* Maturity profile calculated on the long term debt, included the current portion of the long term debt, held by FS\RFI\TI
** The financial expense is net of government grants, therefore the ratio is calculated on the debt not funded through guaranteed government grants 37
Informazione pubblicaEur 7 billion EMTN Programme
17 bonds for Euro 6.56 billion issued so far
Proved access to the bond market
Euro 5.81 billion outstanding
Amount
Series Issue date Maturity
(Euro mio)
* 6 benchmark size ° 11 private placement
1* 07/2013 750 07/2020
public issuances
2* 12/2013 600 12/2021
Among them, the 3
3° 01/2016 300 12/2025 corporate bond fully
4° 07/2016 350 07/2022
Allocation underwritten by the EIB,
one of them financed
5° 07/2016 50 07/2031 62% 5% Polo
31% RFI 1% Qbuzz through the Juncker Plan
Trenitalia Mercitalia funds of the EFSI
6* 06/2017 1000 06/2025
• For • For the • For • For
7* 12/2017 600 12/2023
investments completion of investments investments
8° 12/2017 100 12/2025 in High the High Speed in freight in electric
Speed and infrastructure loco and trains and
9° 03/2018 200 03/2030 Regional wagons buses for
10* 07/2019 700 07/2026
trains public
transport
11° 08/2019 100 08/2029
12° 12/2019 140 12/2029
13° 12/2019 190 06/2024
14° 07/2020 150 07/2032
FS offers room for new issue at medium-long term tenors
15° 12/2020 250 12/2030
and is eager to develope its «green curve»
16° 12/2020 80 12/2023
17* 03/2021 1000 03/2028
38
Informazione pubblicaDebt service capacity
Effective funding management and still solid equity position
• Given improvement in profitability and conservative debt management, Net Financial Debt / EBITDA has keeping stable around
to 3x in last years and in 2020 raised to 5.4x only due to COVID impact on EBITDA.
• Historically low borrowing costs and effective management of financial costs, including interest rate risk management policies,
resulted in EBITDA interest cover improved substantially in the last years and still over 8x in 2020 despite the crisis context.
• FS Italiane maintains a strong and stable capitalisation even after COVID impact.
Leverage evolution Capitalisation
35%
18
16.9
16 16.0 15.6 15.6 31%
30% 29% 30%
14
27% 28%
12 27%
10.8 25%
10
8.9 21%
8
7.1 20%
19%
6 5.6 18% 18% 18%
5.2 5.0 5.4
4.6 4.3 16%
4 15%
3.4 2.9 3.1 2.9
2.7
2
x.x - 10%
2015 2016 2017 2018 2019 2020 2015 2016 2017 2018 2019 2020
Net Financial Debt\EBITDA Total Debt \ EBITDA EBITDA\Interest expense
Net Financial Debt\Equity Total Debt\EQUITY
Source: FS Annual Reports 39
Informazione pubblicaFY 2020 Consolidated Financial Statements
Income Statement Reclassified Statement of Financial Position
€mn 2019 2020 Change % €mn 2019 2020 Change
REVENUE 12,435 10,837 (12.8) Net operating Working Capital (262) 107 369
Revenue from sales and services 11,957 10,482 (12.3) Other Net Assets 2,928 2,505 (423)
Other income 478 355 (25.7) Working Capital 2,666 2,612 (54)
OPERATING COSTS (9,826) (9,204) (6.3)
Net non-current assets 51,132 51,698 566
EBITDA 2,609 1,633 (37.4) (4,303) (3,994) 309
Other provisions
Amortisation, depreciation, provisions and Net assets held for sale 482 0 (100)
(1,780) (1,911) 7.3
impairment losses
NET INVESTED CAPITAL 49,977 50,316 339
EBIT 829 (278) (133.5)
Net financial expense (176) (283) 60.8
Net current financial debt 677 1,106 429
653 (561) 5.8 Net non-current financial debt 6,982 7,787 805
PRE-TAX PROFIT
(60) (1) (98.3) Net financial debt 7,659 8,893 1,234
Income taxes
PROFIT FROM CONTINUING OPERATIONS 593 (562) (194.7) Equity 42,318 41,423 (895)
Loss from assets held for sale, net of taxes (9) 0 (100)
PROFIT FOR THE YEAR 584 (562) (196.2) COVERAGE 49,977 50,316 339
40
Informazione pubblicaEU initiatives
Rail sector will benefit from the latest EU initiatives
Extract of the Next Generation EU press release 27 May 2020
"The European Green Deal as the EU's recovery strategy:
• A massive renovation wave of our buildings and infrastructure and a more circular economy, bringing local jobs;
• Rolling out renewable energy projects, especially wind, solar and kick-starting a clean hydrogen economy in Europe;
• Cleaner transport and logistics, including the installation of one million charging points for electric vehicles and a
boost for rail travel and clean mobility in our cities and regions;
• Strengthening the Just Transition Fund to support re-skilling, helping businesses create new economic opportunities."
European Commission Vice-President Frans Timmermans said: “When it comes to public investment
to relaunch the transport sector, committing to clean and more sustainable mobility will be key. We
have also seen how for instance the public transport sector is suffering across the EU. We absolutely
need a vibrant and strong public transport sector to fulfil our Green Deal Goals. The Connecting
Europe Facility, InvestEU and other funds can for instance support the financing of 1 million electric
vehicle-charging points, clean fleet renewals, sustainable transport infrastructure, especially also
looking at the modalities of rail and electric mobility.”
41
Informazione pubblicaContacts:
Stefano Pierini – Head of Finance, Investor Relations, Insurance and Real Estate
Tel.+39 06 44102348
Mail: s.pierini@fsitaliane.it
Vittoria Iezzi – Head of Debt Capital Market
Tel. +39 06 44106655
Mail: v.iezzi@fsitaliane.it
Lorenza Di Cintio – Debt Capital Market
Tel. +39 06 44103772
Mail: l.dicintio@fsitaliane.it
https://www.fsitaliane.it/content/fsitaliane/en/investor-relations.html
https://www.fsitaliane.it/content/fsitaliane/en/investor-relations/debt-and-credit-rating.html
42
Informazione pubblicaYou can also read