Monash Research Discoveries in Transport Policy and Planning - Public Transport Research ...
←
→
Page content transcription
If your browser does not render page correctly, please read the page content below
Land Transport Authority – Sharing Session
Policy and Planning
Thursday 14th February 2020

                                             Sharing Session
              Monash Research Discoveries in
               Transport Policy and Planning

Prof Graham Currie FTSE
SMRT Engineering Excellence Visiting Endowed Professor, NTU
Director
Public Transport Research Group
Monash Institute of Transport Studies
Monash University, Australia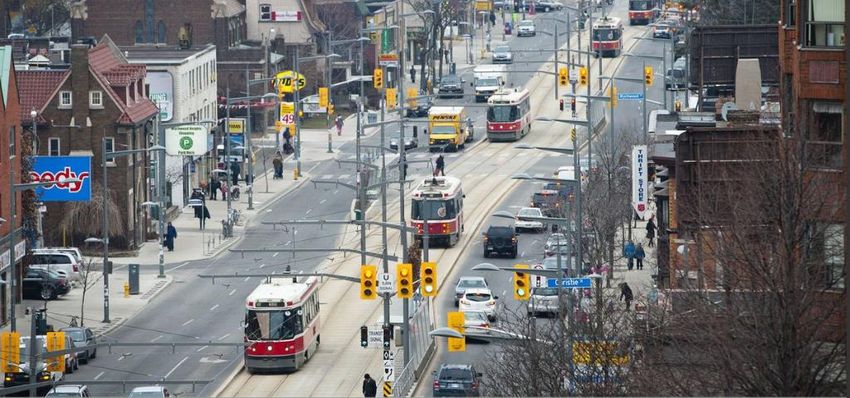
Introduction

Social Trends

DRT and Policy

Tourism Benchmarking

Travel Behavior Change

Pragmatic Priority
This sharing session is an open discussion of Monash Research focused around 5 themes

                                                           Travel
          Social                          Tourism                        Pragmatic
                         DRT Policy                      Behaviour
          Trends                        Benchmarking                      Priority
                                                          Change

                                                                                        3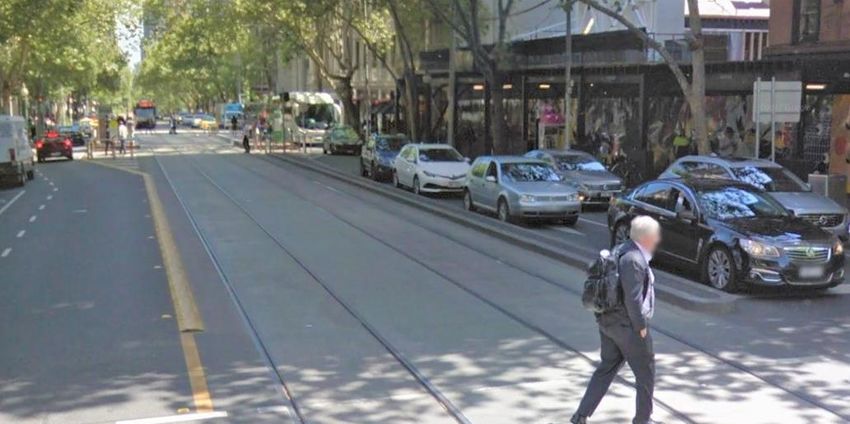
Introduction

Social Trends

DRT and Policy

Tourism Benchmarking

Travel Behavior Change

Pragmatic Priority
Monash research has explored social trends and their impact on transport including the impacts of an
Ageing population and the global decline in youth driving licences

 Ageing Population                                             Youth Licensing
     Research                                                     Research
 Source: Currie G and Delbosc
 (2010) ‘Exploring public
 transport usage trends in an
 ageing population’
 TRANSPORTATION Vol 37 pp
 151-164
                                                  Source: Delbosc A and Currie G (2013)
                                                  ‘Causes of youth licensing decline: a
                                                  synthesis of evidence’ TRANSPORT
                                                  REVIEWS Vol. 33, No. 3, 271–290c

                                                                                                       5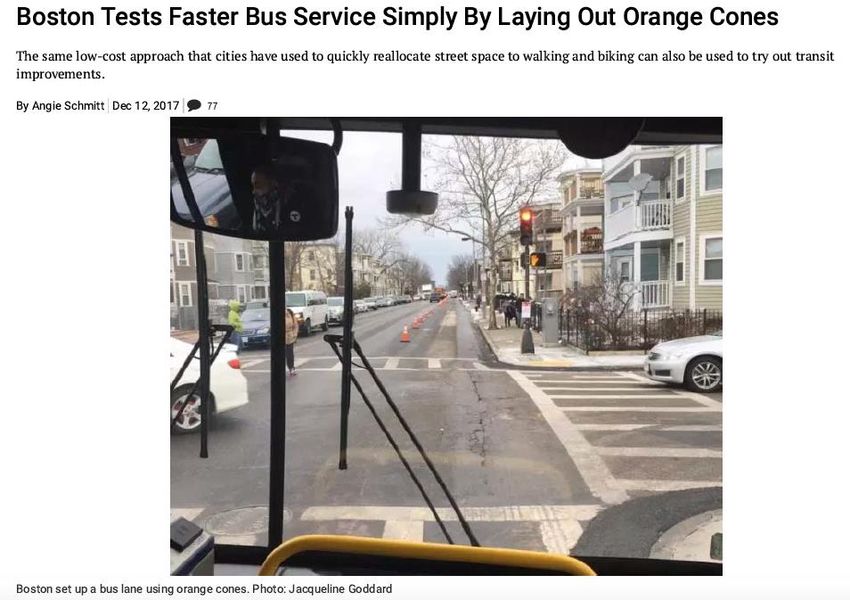
Ageing population and the global decline in youth driving licences

 Ageing Population
     Research
                                                     • paper explores public transport trip rates amongst older age
 Source: Currie G and Delbosc
 (2010) ‘Exploring public                              groups using travel survey evidence collected from a
 transport usage trends in an
 ageing population’                                    household travel survey in Melbourne, Australia for the
 TRANSPORTATION Vol 37 pp
 151-164                                               period 1994 to 1999.
                                                     • aim to establish trends in trip rates so as to explore the
                                                       impact of the ageing Baby Boomer generation on travel by
                                                       public transport.

                                                                                                              6
Forecasts show an ageing population – trends suggestion motorisation, less sharing and PT use growth for
those over 60

                                                                                                                                          130

                                                                                                                                          120

                                                                                                       Change in trip rate (1994 = 100)
                                                                                                                                          110

                                                                                                                                          100

                                                                                                                                           90

                                                                                                                                           80

                                                                                                                                           70

                                                                                                                                           60
                                                                                                                                                1994             1995            1996             1997            1998               1999

                                                                                                                                                Change in car driver trips   Change in car passenger     Change in total car trips
                                                                                                                                                Change in PT trips           Total change in trips

           Metropolitan Melbourne Age Structure 2001-2031 (DSE, 2004)                                                                                    Change in trip rates for those aged 60+

Source: Currie G and Delbosc (2010) ‘Exploring public transport usage trends in an ageing population’ TRANSPORTATION Vol 37 pp 151-164

                                                                                                                                                                                                                                            7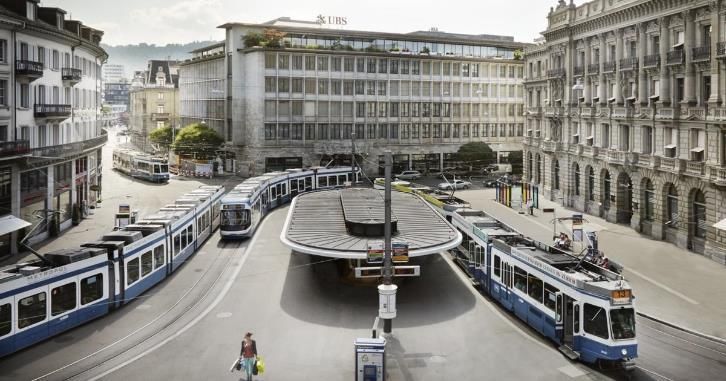
By age cohort – driving growth is flat for the Baby Boomers; higher for others – PT use growth is up for all
cohorts except the over 75’s

                                                                                 Change in car and public transport trips by age cohort
                                          140                                                                                                           140
                                                                           Car Trips                                                                                            Public Transport Trips

                                          120                                                                                                           120

                                                                                                                  Change in PT trip rate (1994 = 100)
   Change in car trip rate (1994 = 100)

                                          100                                                                                                           100

                                           80                                                                                                            80

                                           60                                                                                                            60

                                           40                                                                                                            40

                                           20                                                                                                            20

                                            0                                                                                                             0
                                                1994      1995         1996            1997         1998   1999                                               1994      1995          1996            1997         1998   1999

                                                       under 29   29 to 53 (Boomers)     54 to 74   75+                                                              under 29    29 to 53 (Boomers)     54 to 74   75+

Source: Currie G and Delbosc (2010) ‘Exploring public transport usage trends in an ageing population’ TRANSPORTATION Vol 37 pp 151-164

                                                                                                                                                                                                                                 8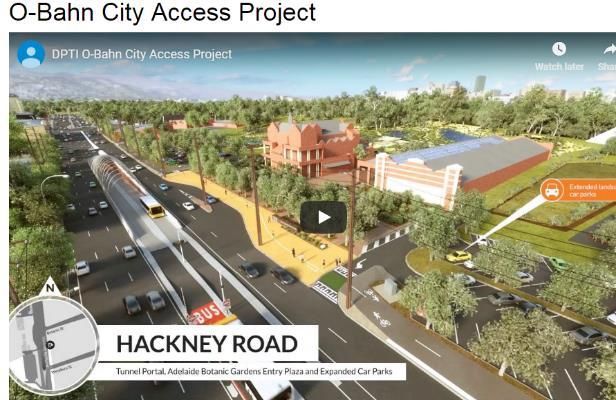
PT growth in up for over 60’s living in inner Melbourne where PT service levels are higher and more
competitive with the car
                                 Public transport trips per day by region for persons aged 60+, 1994-1999

                                                                                                                                         Trend
                                                  1994           1995          1996          1997           1998          1999
                                                                                                                                         slope
                    Inner Melbourne                    .44            .51           .36           .65            .47           .51          .015*
                    Middle Melbourne                   .22            .24           .24           .24            .15           .24         -.005*
                    Outer Melbourne                    .17            .13           .10           .15            .11           .12         -.007*
                 * Regression slope is statistically significant to p < .01

     • Compared to those aged below 60, 60+ demonstrated 30% lower trip making overall and 16% lower public transport
       trip rates. This varied by PT mode; train 36% less, tram 14% less but bus had trip rates which were 33% higher.
     • Longitudinal trends – 60+ had a very small decline in trip rates by public transport (-0.004 average daily trips p.a.) but
       increasing rates for car trips.
     • However age cohort analysis show Baby Boomers (aged 29-53 at the time of the survey)have a small but significant
       increase in longitudinal trip rates of public transport (0.004 average daily trips p.a., p < .05). Conversely, car usage
       amongst Baby Boomers did not significantly change during the course of the study.

Source: Currie G and Delbosc (2010) ‘Exploring public transport usage trends in an ageing population’ TRANSPORTATION Vol 37 pp 151-164

                                                                                                                                                    9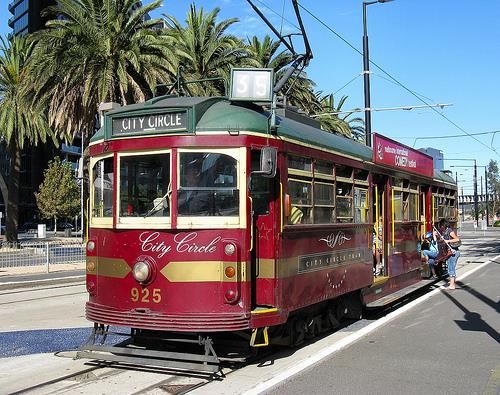
Monash research on the global decline in youth driving licences sought to explore evidence for the trend
and likely causes

                                                               Youth Licensing
                                                                  Research

                                                  Source: Delbosc A and Currie G (2013)
                                                  ‘Causes of youth licensing decline: a
                                                  synthesis of evidence’ TRANSPORT
                                                  REVIEWS Vol. 33, No. 3, 271–290c

                                                                                                      10
A major personal contribution to this research was this difficult
though convincing diagram – it took 1 days work
Youth Licensing
Research
Source: Delbosc A and Currie G (2013)
‘Causes of youth licensing decline: a
synthesis of evidence’ TRANSPORT
REVIEWS Vol. 33, No. 3, 271–290c
11Research found multiple causes – growth in education participation and later life stage employment were
suggested as larger scale impacts but actual impact is unknown
Table 3: Assessment of Causal Factors
Link to Youth
License
Explanation Decline Scale of Impact Rationale for rating
Life stage
Increasing rate of educational Yes Medium Rate of change similar to licensing
participation change
Decreasing full-time employment Yes Medium Rate of change similar to licensing
rates change; flow-on effect to
affordability
Delaying marriage/ children Yes Low Affects only a small share
Living with parents longer Unclear Unclear Affects only a small share
Affordability
Insurance Cost Yes Medium-Low Common issue
Cost of petrol Yes Low Not a high share of costs
Cost of car purchase Unclear Unclear Real costs reducing
Disposable income Unclear Unclear but possibly Complex effect
high
Recession / economy Unlikely Low Decline occurs outside of
recessions
Location and Transport
Use PT /other modes instead Yes Low Mode shift is small
Moving to inner-city / accessible Yes Low Good evidence but only related to
areas small share of young people
Graduated driver licensing
Licensing regimes became more Yes Low Many cases where decline occurs
strict before/ without GDL schemes
Household car access / driving Yes Low
supervisor
Attitudes
Want to help the environment Unlikely Unclear Little evidence in support
Cars no longer a status symbol Yes Low Attitude differs by country Source: Delbosc A and Currie G (2013)
Too busy / other priorities Unclear Unclear Limited evidence ‘Causes of youth licensing decline: a
E-communication synthesis of evidence’ TRANSPORT
E-comms replacing face-to-face Unlikely Unclear Much further research needed
contact REVIEWS Vol. 33, No. 3, 271–290c
E-comms suit PT use Unclear Unclear
12STOP PRESS – Monash Millennials Mobility Panel Survey – Life Stage Effect Confirmed
Young adults are
approaching life course
milestones in diverse ways.
Take home message is:
‘Family’ milestones
(children, marriage)
• some young adults are happy to
follow a traditional path of marriage,
(full time work, leave parental home)
Life course segments
kids and cars,
Traditional (24%)
• but a significant minority are delaying
Launching Traditional (20%)
those life stages and living much
Independent (19%)
longer without being dependent on
‘Adult’ milestones
Delayed with Cars (21%)
the car.
Delayed without Cars (16%)
Age 30
Note: thicker lines represent
These trajectories greater use of cars Dr Alexa Delbosc
overlap with different
Time usage of the car.
http://millennialmobility.info/research-findings/
13Introduction Social Trends DRT and Policy Tourism Benchmarking Travel Behavior Change Pragmatic Priority
Last August I ran a Workshop on DRT at Thredbo 16 in Singapore and author a DRT paper on ‘Why most
DRT/Micro-Transits fail..’; key findings are now outlined

                     WORKSHOP 4 : Realising the Potential
                     Benefits of Demand Responsive Travel

                      16th International Conference Series on
                   Competition and Ownership in Land Passenger
                       Transport - Singapore - August 2019

                                                                                               15
DRT CONTEXT – typology, microtransit, paratransit and developing world models
Microtransit
Paratransit
(Community
Transport)
Developing
Typology World
DRT
16[Developed world] DRT Review results ; Most DRT’s fail ; 3 Eras – Microtransit biggest failure rate – high
cost the key driver
30% of all DRT’s withdrawn in 2 years
50% of microtransit DRT withdrawn in 2 years
Para/Community Transit highest retention rate
8
Started
7
6 DRT Eras – Success and Failure Failed
5
4
Number of DRTs
3
2
Tech
1 Early Para/Com
Based
0 ‘dial-a- munity
Micro-
1970
1973
1975
1977
1980
1982
1985
1987
1989
1992
1994
1997
1999
2001
2004
2006
2009
2011
2013
2016
2018
1971
1972
1974
1976
1978
1979
1981
1983
1984
1986
1988
1990
1991
1993
1995
1996
1998
2000
2002
2003
2005
2007
2008
2010
2012
2014
2015
2017
2019
-1
bus’ Transport
-2 Transit
-3 Year
Av. Cost $/veh-hr 150.37 63.07 123.18
-4
-5 Av. Cost $/pax 21.26 13.8 42.72
-6
1970 – 1984 1985 – 2009 2010 – 2019
Early Dial-a-Bus services Paratransit/Community Transport era Tech-based Micro-Transit DRTs
First attempts to run demand US paratransit services developed in response to New technologies are being
responsive services Americans with Disability Act (ADA) deployed for modern ‘micro-
transit’ based DRTs
UK bus deregulation outside London resulted in
investment in special need style services to fill gaps in
withdrawn social bus services
Source: Currie G and Fournier N (2019) ‘Why most DRT/Micro-Transits fail – what the survivors tell us about progress’ 16th
International Conference Series on Competition and Ownership in Land Passenger Transport Singapore Aug 2019
17Thredbo workshop developed a new DRT global Framework to help understand policy context, aims and
models
Main Public Transport System Goal
Car Dominant PT Dominant
Social Peak Congestion Relief PT For Whole City Travel
Spatial Context Fringe/Rural Many Service Gaps Few Service Gaps
Low Density
Source: Currie G and Wong T (Under Review) ‘Workshop 4 Report: Realising the Potential Benefits of Demand-Responsive Travel.’ Research in Transport Economics
18High/Low Regulation DRT’s fit into this framework explaining objectives, types within their context
Main Public Transport System Goal
Car Dominant PT Dominant
Social Peak Congestion Relief PT For Whole City Travel
Spatial Context Fringe/Rural Many Service Gaps Few Service Gaps
Low Density
High
Regulation • Door to Door: • Peak Only • First Last Mile
Developed • Paratransit • First Last Mile • Low Coverage
Countries
(Subsidy) • Community • Low Coverage Pockets
Transport Pockets • Cross Corridor;
• Cross Corridor dispersed low
dispersed? density
Developing • ? • Jeepney • ff
Countries • Matatu
(Profit) Low • Tro-tro
Regulation
Source: Currie G and Wong T (Under Review) ‘Workshop 4 Report: Realising the Potential Benefits of Demand-Responsive Travel.’ Research in Transport Economics
19Thredbo Workshop 4 - Opportunities, Challenges and Policy Recommendations
• Opportunities • Policy Recommendations
– Multi-service passenger info - MaaS – Flexible AGENCY FOR Intermediate
– [Scalable cost effective focussed] tech Mobility Services (FAMS); MaaS
– Learning from the lessons and history – Review, share, focus existing
– Shift away from the private single occupancy knowledge (smarter website, MAMBA
vehicle knowledge base repository)
– More and growing attention to objectives – Policy – clearer objectives and
behind DRT resource support to solve it, allocation
– Moving RIGHT (on our graphic)
of responsibility to implement
– Clarity relative roles and public and
market
• Challenges – Beaurocracy – need to be proactive
– Protectionist attitudes from many not reactive
– Telecommuting – Occupancy targets minimum
occupancy minimum, employ VMT
– Mindless TECH HYPE promotions
caps
– Competition from new tech modes
– Developing; coordination, regulation,
– Aligning DRT and Transit policy public from informal and informal
sector
Source: Currie G and Wong T (Under Review) ‘Workshop 4 Report: Realising the Potential Benefits of Demand-Responsive Travel.’ Research in Transport Economics
20Introduction Social Trends DRT and Policy Tourism Benchmarking Travel Behavior Change Pragmatic Priority
In 2015 Monash developed a new index to measure the quality of PT for international visitors – Incl:
Singapore & 3 other cities – in 2016, we updated expanded to Queensland cities for Tourism Queensland

 •   Yang Y Currie G Peel V and Liu Z (2015) ‘A New Index to Measure    •   De Gruyter C, Currie G Reynolds J, Peel V and Yang Y (2016)
     the Quality of Urban Public Transport for Internatonal Tourists’       ‘Benchmarking public transport for international tourists in
     Transportation Research Board 94th Annual Meeting                      Queensland cities’ Australasian Transport Research Forum 2016
                                                                            Proceedings 16 – 18 November 2016, Melbourne, Australia

                           London
                            Paris
                                                                                                            Cairns

                                                                                                             Townsville
                                                Singapore
                                                                                               QUEENSLAND

                                                        Melbourne
                                                                                                                          Sunshine Coast
                                                                                                                          Brisbane
                                                                                                                          Gold Coast

                                                                                                                                           22
Previous research suggests elements of PT are considered important to international tourists
Element Examples Supporting literature
Information Access ▪ General information Andereck & Caldwell (1994);
▪ Advanced traveller information Garín-Muñoz & Pérez-Amaral
▪ Language selections (2011); Grotenhuisa et al (2007)
Cost and Ticketing ▪ Fare price Cossu et al (2010); Griffin et al
▪ Tourist ticket options (2012); Gronau & Kagermeier
▪ Ease of use (2007)
Service Level ▪ Frequency and waiting time Gronau & Kagermeier (2007);
▪ Travel time Guiver et al (2007)
▪ Access to stations/stops
Special Tourist ▪ Links to international access Dubey (2011)
Services points, e.g. airports
▪ Free tourist services
Other Elements ▪ Service reliability Aquino (2008); Anable &
▪ Comfort Gatersleben (2005); VTIC &
▪ Personal safety VIEC (2010)
23Framework developed by Yang et al (2015) includes 26 weighted criteria
Element No. criteria Max possible score Share (%)
Information Access 11 45 22%
Cost and Ticketing 6 40 20%
Service Level 7 95 48%
Special Tourist
2 20 10%
Services
Total 26 200 100%
▪ Criteria and relative weights informed by the research literature
▪ Cities given a score of between 0 and 5 depending on how well they
meet each criteria; maximum possible total score is 200 points
24‘Information Access’ covers availability, reliability and understandability
Criterion Score method Weighting
Availability
A1 General information about PT 0 = not available, through to 5 = detailed information available 0.5
A2 Fare information on PT websites 0 = not available, through to 5 = detailed information available 1
0 = no timetable/network info, through to 5 = journey planner with
A3 Journey planner performance 2
detailed results or transit planning available in Google Maps
A4 Tourist information on PT websites 0 = no tourist information, through to 5 = tourist guide page 1
A5 PT information on attraction websites 0 = no PT info, through to 5 = PT info with links to PT websites 0.5
A6 PT information on accommodation websites 0 = no PT info, through to 5 = PT info with links to PT websites 0.5
A7 PT information on airport/station websites 0 = no PT info, through to 5 = PT info with links to PT websites 0.5
0 = no mobile service, through 5 = telephone service with free
A8 Mobile PT information service 1
mobile phone app providing detailed info and journey planner
Reliability
A9 Last update time/date of PT websites 0 = more than 2 months/no statement, through to 5 = real-time 0.5
Understandability
A10 Language selection on PT websites 0 = no English, through to 5 = English + four more languages 1
A11 Language selection on PT mobile apps 0 = no English, through to 5 = English + four more languages 0.5
25‘Cost & Ticketing’ covers ease of purchase, use and value for money
Criterion Score method Weighting
Ease of buying and reloading tickets 0 = less than 5 locations, through to 5 = every station, some stops,
B1 1
(number of locations to purchase tickets) airports, attractions, accommodations, online, via phone
0 = paper tickets with different ticketing system for each mode,
B2 Ease of using tickets 1
through to 5 = universal smart card for all PT services
0 = no special tickets, through to 5 = special ticket is a universal
B3 Special tourist tickets 1
smart card with mobile ticketing or contactless payment
0 = special tickets more expensive, through to 5 = additional
B4 Tourist/general ticket discounts 2
discounts available at tourist attractions
B5 Refund availability 0 = not refundable, through to 5 = refundable 1
B6 Fare price/value 0 = More than AU$18/day, through to 5 = less than AU$10/day 2
26‘Service Level’ covers frequency, travel time and accessibility
Criterion Score method Weighting
Frequency
C1 Service frequency – weekdays 0 = 15 minutes or more, through to 5 = 5 minutes or less 3
C2 Service frequency – weekends 0 = 15 minutes or more, through to 5 = 5 minutes or less 3
C3 Waiting time – weekdays (10am) 0 = 15 minutes or more, through to 5 = 5 minutes or less 3
C4 Waiting time – weekends (10am Sunday) 0 = 15 minutes or more, through to 5 = 5 minutes or less 3
Travel time
C5 Travel time – weekdays 0 = 85 minutes or more, through to 5 = 25 minutes or less 2
C6 Travel time – weekends 0 = 85 minutes or more, through to 5 = 25 minutes or less 2
Accessibility
C7 Average walking time 0 = 25 minutes or more, through to 5 = 5 minutes or less 3
27‘Special Tourist Services’ cover airport access and tourist services
Criterion Score method Weighting
0 = no PT service between airport and city, through to 5 =
D1 Transport services linked with airports 2
express and direct rail link between airport and city
0 = no special PT service or routes for tourists, through to 5 =
D2 Special tourist services & recreational routes 2
free PT service for tourists
28Information on key websites was used as a basis to score each city …
TransLink Sunbus qconnect SeaLink
www.translink.com.au www.sunbus.com.au www.tmr.qld.gov.au/travel- www.sealinkqld.com.au
and-transport/qconnect.aspx
▪ Provides an inexpensive method over field observations and allows
for comparisons across cities to be easily made
▪ May create methodological concerns where cities have limited
internet access but not applicable to cities included in this study
29…with TripAdvisor & journey planners used to score ‘Service Level’ criteria
▪ Top 10 tourist accommodation sites (origins) and top 10 tourist attractions
(destinations) were selected from TripAdvisor for each city
▪ Trips between these origins and destinations (total of 100 trips) assessed
for each city using TransLink journey planner and Google Transit
▪ While not representative of all tourism travel, the approach can be
applied consistently across all cities
▪ Scores tend to be biased towards smaller, more compact cities due to the
lower travel times involved
TransLink journey planner Google Transit
30RESULTS - Information Access – Paris & London score highest; Brisbane close behind
MAXIMUM 45
▪ PT websites for Melbourne,
Melbourne 34.7 Singapore & Townsville do not
London 41.9 have languages other than English
▪ PT website for Singapore has no
Paris 42.8
information about tourism venues
Singapore 29.6
Brisbane 40.4
Gold Coast 39.1
Sunshine Coast 37.9
Cairns 37.8 Information Access
Townsville 20.6
0 50 100 150 200
Total weighted scores for all criteria
31Cost & Ticketing – Gold Coast highest by far due to $10/day tourist ticket
MAXIMUM 45 40
Melbourne 34.7 28
▪ Gold Coast outperforms all cities
London 41.9 26
mainly due to its low cost tourist ticket
Paris 42.8 31
▪ Paris & Melbourne still perform
Singapore 29.6 22 relatively well due to discounted
tourist venue/travel ticket options
Brisbane 40.4 26
Gold Coast 39.1 36
Sunshine Coast 37.9 26 Information Access
Cairns 37.8 4 Cost & Ticketing
Townsville 20.6 4
0 50 100 150 200
Total weighted scores for all criteria
32Service Level – London highest, followed by Gold Coast & Singapore
MAXIMUM 45 40 95
Melbourne 34.7 28 63
London 41.9 26 68
Paris 42.8 31 60
▪ Clustering of sites
helps boost scores
Singapore 29.6 22 65 for Gold Coast
Brisbane 40.4 26 48.4 ▪ Other Queensland
cities perform
Gold Coast 39.1 36 65.8
poorly due to low
Information Access
Sunshine Coast 37.9 26 26.7 frequencies and
large spread of
Cost & Ticketing
Cairns 37.8 4 51.3
site locations
Service Level
Townsville 20.6 4 30.4
0 50 100 150 200
Total weighted scores for all criteria
33Special Tourist Services – Brisbane highest of all cities with perfect score
MAXIMUM 45 40 95 20
Melbourne 34.7 28 63 14
▪ Brisbane achieves
London 41.9 26 68 16
a perfect score
Paris 42.8 31 60 16 ▪ London, Paris &
Singapore 29.6 22 65 16
Singapore perform
well to due airport
Brisbane 40.4 26 48.4 20 rail access
Gold Coast 39.1 36 65.8 12
Information Access
Sunshine Coast 37.9 26 26.7 10
Cost & Ticketing
Cairns 37.8 4 51.3 10
Service Level
Townsville 20.6 4 30.4 10 Special Tourist Services
0 50 100 150 200
Total weighted scores for all criteria
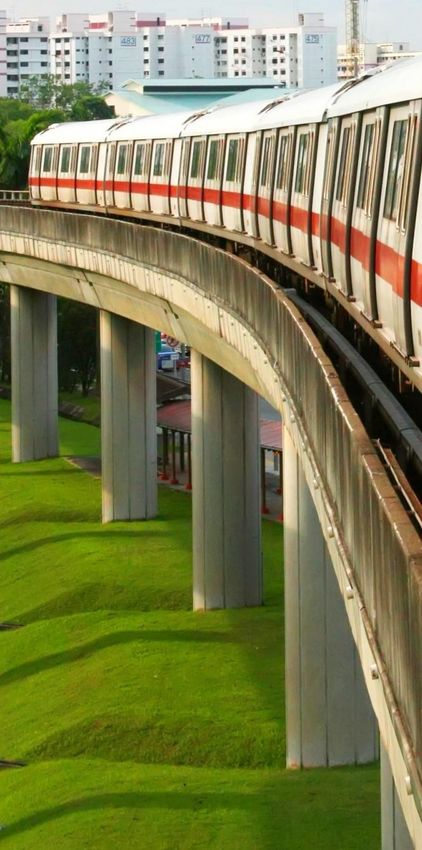
34Total – Gold Coast highest overall, followed closely by London & Paris
Total
MAXIMUM 45 40 95 20
= 200
Melbourne 34.7 28 63 14 Total = 139.7
London 41.9 26 68 16 Total = 151.9
Paris 42.8 31 60 16 Total = 149.8
Singapore 29.6 22 65 16 Total = 132.6
Brisbane 40.4 26 48.4 20 Total = 134.8
Gold Coast 39.1 36 65.8 12 Total = 152.9
Information Access
Sunshine Coast 37.9 26 26.7 10 Total = 100.6
Cost & Ticketing
Cairns 37.8 4 51.3 10 Total = 103.1
Service Level
Townsville 20.6 4 30.4 10 Total = 65.0 Special Tourist Services
0 50 100 150 200
Total weighted scores for all criteria
35Is it fair to compare small Queensland cities with large international cities?
8,000 180
Resident population (‘000s)
Total score
7,000 160
140
Resident population ('000s) 6,000
120
5,000
Total score
100
4,000
80
3,000
60
2,000
40
1,000 20
0 0
Sunshine
Brisbane
Cairns
Townsville
Singapore
Melbourne
Coast
London
Paris
Gold
Coast
36Particularly when international tourist numbers are taken into account?
20,000 180
International overnight visitors (‘000s)
18,000 Total score
160
International overnight visitors ('000s)
16,000
140
14,000
120
12,000
Total score
100
10,000
80
8,000
60
6,000
40
4,000
2,000 20
0 0
Gold Coast
Brisbane
Sunshine
Townsville
Cairns
Singapore
Melbourne
Paris
London
Coast
37Introduction Social Trends DRT and Policy Tourism Benchmarking Travel Behavior Change Pragmatic Priority
Monash PhD student Rita Seethaler explored how ‘Principles of Persuasion’ theory could be used to
increase takeup of travel behaviour change programs

                                               Seethaler RK and Rose G (2006) ‘Six Principles of Persuasion to
                                               Promote Community-Based Travel Behavior Change’
                                               Transportation Research Record, vol. 1956, 1: pp. 42-51

                                                                                                                 39
The research is based on the ‘Six Principles of Persuasion’ developed from social psychology
▪ Social psychology has developed many taxonomies to encourage people to
do things –
▪ This research based on the SIX PRINCIPLES OF PERSUASION based on:
– Cialdini, R. B. Influence: Science and Practice. Allyn & Bacon, Needham Heights, Mass.,
2001
– Groves, R. M., R. B. Cialdini, and M. P. Couper. Understanding the Decision to Participate
in a Survey. Public Opinion Quarterly, Vol. 56, No. 4, 1992, pp. 475–495.
– McKenzie-Moor, D., and W. Smith. Fostering Sustainable Behaviour: An Introduction to
Community-Based Social Marketing. New Society Publishers, Gabriola Islands, British
Columbia, Canada, 1999.
40The research is based on the ‘Six Principles of Persuasion’ developed from social psychology – and
adjusted to apply to a travel behaviour change program…
Six Principles of Persuasion Travel Behaviour Program Adjustments
1. Reciprocation - Groves et al. “people thus feel obligated to respond to positive Unconditional gift – environmentally friendly Green Bag for
behavior received (e.g., gifts, favors, services, concessions) with positive behavior in shopping & a discount voucher for the local shopping strip -
return.” to trigger a positive reciprocation response
2. Commitment and Consistency - Once an individual has taken a freely chosen
position, a tendency to act in line with the commitment has been found to guide further small initial commitment to induce further action -
actions. Before the mechanism of consistency is activated, an initial commitment must be necessity of recycling, water savings, reduction of
generated in the target person. Even if the first commitment is small, bigger requests later the use of plastic bags
on will still be accepted because of the consistency requirement.
3. Social Proof - The willingness to comply with a request is increased when it is Support of local community groups and business
supported by the belief or evidence that similar peers comply with it as well. groups shown on all marketing
4. Liking - People are increasingly inclined to follow a request brought forward by someone carefully select facilitators – esteemed/ liked. Use
they like. Factors enhancing liking have been found to be similarity of attitude (34), a peer group setting e.g. church group for
background (35), physical attractiveness (36), dress (37), and finally, the use of praise (38) meetings. All materials designed and presented in
and cooperation (39). E.g. Tupperware party’s an attractive fashion (i.e., as a gift).
5. Authority - When a person makes a decision, it is common to seek expert advice from staff members had to wear identification badges, presented an
an acknowledged source, for example, medical, legal, financial, or any other professional authorization letter from Government, and introduced as staff
of an official TravelSmart campaign
expertise or to comply with the rules of a properly constituted authority
6. Scarcity - More scarce opportunities are perceived as more valuable because of loss of Demonstrating the loss in money and time spent on traveling and the loss in
opportunities for physical activity when travel patterns remain unchanged. On
future opportunities. Social psychology recommends the use of negative message framing a community level, the loss of neighborhood quality and a pollution and
for the promotion of proenvironmental behavior and to emphasize losses, which occur as a noise-free environment would be the negative message framing.
result of inaction, rather than savings, which occur as a result of taking action.
41…at various stages in the program – including a case and control method to assess performance in
recruiting participants
42Results suggest a new letter based on the 6 principles considerably improved performance between 2.8%
and 10% in all tests undertaken
+10%
+2.8%
+5%
+5%
43Introduction Social Trends DRT and Policy Tourism Benchmarking Travel Behavior Change Pragmatic Priority
We all know PT is more efficient on roads due to people carrying ability

                                                                           45
We know that substantial benefits will result from implementing priority…
Degree of Secondary Impact
Secondary
Transit Fleet Benefits
Land & Operating Cost
Use Savings
Benefits?
% Travel Time Saving Resulting from Transit Priority
Source: Goh and Currie (2013) Before and After Source: Currie G and Sarvi M (2012) ‘A New Model for the
Studies of the Operational Performance of Secondary Benefits of Transit Priority’
Transit Priority Initiatives ITS Report Feb 2013 TRANSPORTATION RESEARCH RECORD No. 2276,
Journal of the Transportation Research Board pp 63–71
46..but very little gets implemented.
47.. WHY?
Questions of Governance: Rethinking the Study of Transportation Policy
Transportation Research Part A Policy and Practice 101 · May 2017
“…there is a need to … pay greater
attention to context, politics,
power, resources and
legitimacy”
(Marsden and Reardon 2017)
48.. WHY?
State of the Art –
Priority Design
Source: Currie G (2016) ‘Managing On-Road Public Transport
in Traffic’ in Bliemer M Mulley C and Moutou C Handbook on
Transport and Urban Planning in the Developed World,
Edward Elgar Publishing Ltd UK
49Topic 11. James Reynolds – Pragmatic Transit Priority
9. Future 10. Designing Urban Rail
1. TOD & 2. Big Data & Train to Reduce Vandalism
Transit Visualisation
Lisa Fu Amy Killen
Laura Aston Homayoun Rafati
3. Network 4. Shared
Synchronisation Mobility 11. Bus & Tram Priority 12. Simulating Bus
Rejitha Ravindra Taru Jain Implementation & Tram Priority
James Reynolds Samithree Rajapaksha
5. Changing 6. Tourism &
Travel Behaviour Public Transport
Laura McCarthy Victoria Radnell
13. Placemaking & 14. Passenger
Street Redesign Falls in Trams
7. Reliability Engineering Approaches Matthew Diemer Luke Valenza
in Best Practice Railways
Maryam Nawaz
15. Transit 16. Future
8. Improving Gender Diversity in the
Network Design Bus
Public Transport Workforce
Nora Estgfäller Sarah Roberts
Rachel Mence
17. The New 18. Road Safety Impacts
Bus Rider of Bus Safety Inspections
Prudence Blake Jianrong Qiu
50Why can London and Zurich have top quality priority, yet car dominated cities cant?....
51…because they have LEGITIMACY
Grade
Separation
52How can car dominated cities get priority without LEGITIMACY? We identified THREE APPROACHES AND
EIGHT PRAGMATIC STRATEGIES
Build legitimacy BEFORE implementation
AVOID IMPACTS on other road users
Build legitimacy THROUGH IMPLEMENTATION
53How can we get priority when we don’t have LEGITIMACY? We identified THREE APPROACHES AND
EIGHT PRAGMATIC STRATEGIES
Build legitimacy BEFORE implementation
1. Technical enquiry
2. Transport planning, and/or
3. Public processes or hearings
AVOID IMPACTS on other road users
4. Grade separation
5. Subservient priority
Build legitimacy THROUGH IMPLEMENTATION
6. Bottom-up and incremental
7. Pop-ups
8. Trials
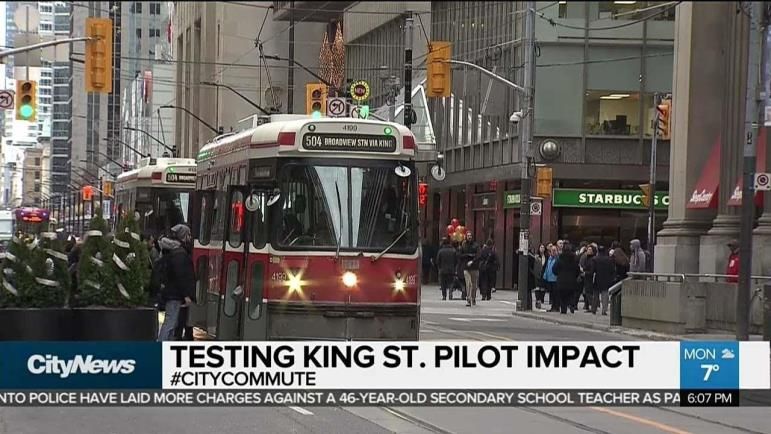
54Technical/Public Enquiries – such as the St Clair streetcar corridor in Toronto
Build legitimacy BEFORE implementation Mediate, arbitrate or resolve issues &
build legitimacy
1. Technical enquiry • Transport study
• Environmental effects statement process
2. Transport planning, and/or • Planning processes
• Independent study
3. Public processes or hearings • Public enquiry
• Plebiscite (Switzerland only)
AVOID IMPACTS on other road users
4. Grade separation
5. Subservient priority
Build legitimacy THROUGH IMPLEMENTATION
6. Bottom-up and incremental
7. Pop-ups
8. Trials
554. Grade Separation; Adelaide and Brisbane Busways
Build legitimacy BEFORE implementation
1. Technical enquiry
2. Transport planning, and/or
3. Public processes or hearings
AVOID IMPACTS on other road users
4. Grade separation
5. Subservient priority
Build legitimacy THROUGH IMPLEMENTATION
6. Bottom-up and incremental
7. Pop-ups
8. Trials
565. Subservient Priority; Melbourne; Eastern Freeway emergency lanes, Smartbus Road Widening and Tokyo
Bus Tubes
Build legitimacy BEFORE implementation
1. Technical enquiry
2. Transport planning, and/or
3. Public processes or hearings
AVOID IMPACTS on other road users
4. Grade separation
5. Subservient priority
Build legitimacy THROUGH IMPLEMENTATION
6. Bottom-up and incremental
7. Pop-ups
8. Trials
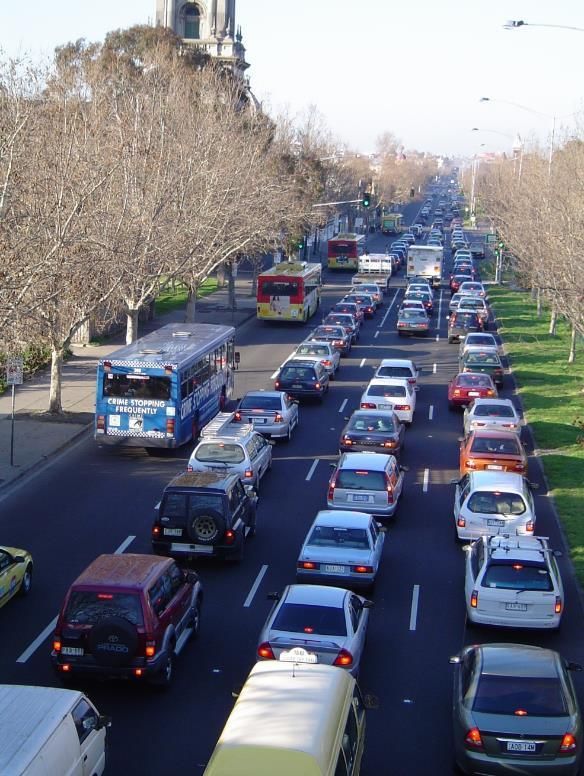
576. Bottom-up & Incremental; Melbournes vanishing streetcar secret
Build legitimacy BEFORE implementation
1. Technical enquiry
2. Transport planning, and/or
3. Public processes or hearings
AVOID IMPACTS on other road users 2009 2014
4. Grade separation
5. Subservient priority
Build legitimacy THROUGH IMPLEMENTATION
6. Bottom-up and incremental
7. Pop-ups
8. Trials
587. Pop-ups; do priority tomorrow; with traffic cones – Boston, USA
Build legitimacy BEFORE implementation
1. Technical enquiry
2. Transport planning, and/or
3. Public processes or hearings
AVOID IMPACTS on other road users
4. Grade separation
5. Subservient priority
Build legitimacy THROUGH IMPLEMENTATION
6. Bottom-up and incremental
7. Pop-ups
Tactical
8. Trials urbanism
598. Trials; Toronto King Street Trail; and the great Melbourne Clarendon Street Trial Failure; or was it
Success?
Build legitimacy BEFORE implementation
1. Technical enquiry
2. Transport planning, and/or
3. Public processes or hearings
AVOID IMPACTS on other road users
4. Grade separation
5. Subservient priority
Build legitimacy THROUGH IMPLEMENTATION
6. Bottom-up and incremental
7. Pop-ups
8. Trials
60Contact us via our website PTRG.INFO, LinkedIn or Twitter
Professor Graham Currie
FTSE
Director, SEPT-GRIP, PTRG
www.ptrg.info
61You can also read