Risk of Exposure to COVID-19: Visit Duration Data Can Inform Our Daily Activities Choices: An Epidemiological Investigation Using Community ...
←
→
Page content transcription
If your browser does not render page correctly, please read the page content below
International Journal of
               Environmental Research
               and Public Health

Article
Risk of Exposure to COVID-19: Visit Duration Data Can Inform
Our Daily Activities Choices: An Epidemiological Investigation
Using Community Mobility Data from the Metropolitan Area
of Genoa, Italy
Cristina Oliva and Giampiero Favato *

                                           Institute of Leadership and Management in Health, Kingston Business School, Kingston University,
                                           Kingston-upon-Thames KT2 7LB, UK; c.oliva@kingston.ac.uk
                                           * Correspondence: g.favato@kingston.ac.uk

                                           Abstract: COVID-19 spreads mainly among people who are in close contact. Policymakers mostly
                                           resorted to normative measures to limit close contacts and impose social distancing. Our study
                                           aimed to estimate the risk of exposure to COVID-19 by location and activity in crowded metropolitan
                                           areas. The risk of exposure to COVID-19 was defined as the product of crowding (people within
                                           a six feet distance) and exposure duration (fraction of 15 min). Our epidemiological investigation
                                           used aggregated and anonymized mobility data from Google Maps to estimate the visit duration. We
                                           collected visit duration data for 561 premises in the metropolitan area of Genoa, Italy from October

                                    2020 to January 2021. The sample was then clustered into 14 everyday activities, from grocery
                                           shopping to the post office. Crowding data by activity were obtained from pre-existing building
Citation: Oliva, C.; Favato, G. Risk of
                                           norms and new government measures to contain the pandemic. The study found significant variance
Exposure to COVID-19: Visit
Duration Data Can Inform Our Daily
                                           in the risk of exposure to COVID-19 among activities and, for the same activity, among locations. The
Activities Choices: An                     empirical determination of the risk of exposure to COVID-19 can inform national and local public
Epidemiological Investigation Using        health policies to contain the pandemic’s diffusion. Its simple numerical form can help policymakers
Community Mobility Data from the           effectively communicate difficult decisions affecting our daily lives. Most importantly, risk data by
Metropolitan Area of Genoa, Italy. Int.    location can help us rethink our daily routine and make informed, responsible choices when we
J. Environ. Res. Public Health 2021, 18,   decide to go out.
4632. https://doi.org/10.3390/
ijerph18094632                             Keywords: COVID-19; risk; exposure; visit; duration

Academic Editor: Paul Tchounwou

Received: 23 March 2021
                                           1. Introduction
Accepted: 25 April 2021
Published: 27 April 2021
                                                Policymakers mainly resorted to normative measures to mitigate the individual risk
                                           of exposure to COVID-19. Over the last 12 months, the Italian Government promulgated
Publisher’s Note: MDPI stays neutral
                                           73 Acts containing urgent measures to contain the pandemic [1]. These norms imposed on
with regard to jurisdictional claims in
                                           individuals the trade-off between mitigation of the risk of exposure and personal freedom.
published maps and institutional affil-    Stay home (lockdown), avoid crowds (limited opening hours and restricted access to stores),
iations.                                   and wear a mask became new legally binding constraints to our everyday life. A constant,
                                           systematic media campaign made everyone aware of what not to do, and the consequences
                                           of breaking the law. For the first time, the Prime Minister asked social media influencers
                                           to promote the adherence to public health policies, leveraging the connection to the civic
Copyright: © 2021 by the authors.
                                           sense of younger users [2].
Licensee MDPI, Basel, Switzerland.
                                                When people are allowed to go out, what can they do to reduce their risk of exposure
This article is an open access article
                                           to COVID-19? Which activity is riskier? Within the same activity, are there premises where
distributed under the terms and            the risk of exposure is lower than others?
conditions of the Creative Commons              The aim of our study was to estimate the risk of exposure to COVID-19 by location
Attribution (CC BY) license (https://      and activity in crowded metropolitan areas.
creativecommons.org/licenses/by/                Although social and leisure activities have been identified as significant public health
4.0/).                                     hazards related to the diffusion of COVID-19, the Centers for Disease Control (CDC)

Int. J. Environ. Res. Public Health 2021, 18, 4632. https://doi.org/10.3390/ijerph18094632                     https://www.mdpi.com/journal/ijerph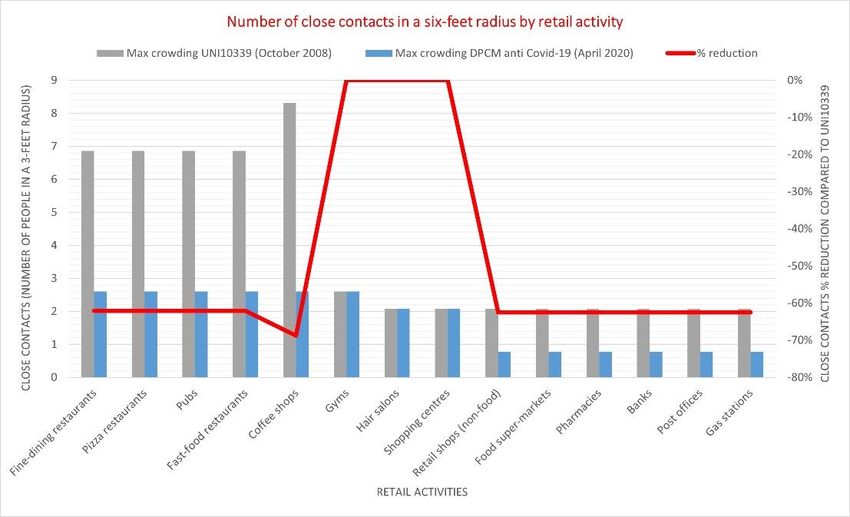
Int. J. Environ. Res. Public Health 2021, 18, 4632                                                                               2 of 14

                                        admittedly “cannot provide the specific risk level for every activity in every community”.
                                        No method or dataset in the extant literature can help individuals make informed decisions
                                        about the risk of exposure to COVID-19 when they decide to go out.
                                             Our epidemiological investigation used for the first time the newly available mobility
                                        data to estimate the risk of exposure to COVID-19 in crowded retail premises of Genoa’s
                                        metropolitan area (Italy). The newly obtained granularity of risk data could inform people’s
                                        daily choices when deciding to go out, increasing the individual acceptance of containment
                                        measures and reducing the exposure to COVID-19 at a personal and community level.

                                        2. Materials and Methods
                                        2.1. Risk of Exposure to COVID-19: A Working Definition
                                             COVID-19 spreads mainly among people who are in close contact [3]. Factors to
                                        consider when defining close contact include proximity (closer distance likely increases
                                        exposure risk) and exposure duration (longer exposure time likely increases exposure risk).
                                        Although data are still limited, 15 cumulative minutes of exposure at a distance of 6 feet
                                        or less can be used as an operational definition for close contact [4]. As recommended by
                                        CDC, the determination of close contact should generally be made irrespective of whether
                                        the contact was wearing respiratory personal protective equipment (PPE). The impact of
                                        wearing a mask on reducing the exposure risk for specific daily activities is addressed in
                                        the “Discussion” Section 4. From the CDC’s definition of closed contact, we derived a
                                        working definition of risk of exposure to COVID-19 for daily activities:

                                                               Risk of exposure = crowding × visit duration                         (1)

                                        2.2. The Measurement of Crowding
                                             To determine the exact number of people standing in the 10.4 square meters (approx-
                                        imately to the area of a circle of 6 feet radius) around you at any given time is virtually
                                        impossible. What is possible is to estimate the maximum number of people you should
                                        expect around you in any public office or retail premise. In Italy, maximum crowding
                                        standards are regulated by the UNI10339 norm, which sets the maximum number of people
                                        allowable for design purposes, for each square meter of floor area, concerning various
                                        categories of public offices and retail premises [5]. To guarantee the resumption of activities
                                        after the first lockdown phase, the maximum crowding standard attributed to commercial
                                        establishments was set at 13.3 m2 per person (example: three people can enter a 40 m2
                                        room) [6]. In May 2020, the National Institute for Occupational Accident Insurance (INAIL)
                                        produced a technical document about coffee shops and restaurants. It set the maximum
                                        crowding standard at 4 square meters per person [7]. We used both sets of crowding
                                        norms as multiplicands to determine the risk of exposure to COVID-19 before and after the
                                        Government’s containment measures.

                                        2.3. New Data: The Measure of Visit Duration
                                              The real methodological issue was estimating the time multiplier: how long do people
                                        stay in a specific store or premise in a given community? A new feature of Google Maps
                                        allowed collecting data on the mean visit duration by individual retail premise. Google
                                        made visit duration data available in October 2020, only for store with an acceptable
                                        level of customers’ daily traffic. Due to the Covid-19 limitations to mobility, we waited
                                        approximately three months (30 December 2020) before collecting visit duration data from
                                        a significant number of retail stores by type of activity.
                                              This new feature shows how much time customers typically spend in a specific store.
                                        Visit duration is based on customer visits patterns over the past several weeks and is
                                        expressed in units of time (minutes). Most retail stores show the visit duration as a range
                                        (e.g., 90–180 min), while food supermarkets indicate a mean value (e.g., 20 min) [8].
                                              Data were collected from all the retail activities resident in the Genoa metropolitan
                                        area which were visible in Google Map and reported visit duration time. Google does not
Int. J. Environ. Res. Public Health 2021, 18, 4632 3 of 14
report visit duration for those activities which do not generate a reliable number of daily
mobility data. We manually collected visit duration data for 561 retail activities, banks
and public offices located by Google Maps in the metropolitan area of Genoa, Italy. The
sample was then clustered into 14 everyday activities, from grocery shopping to going to
the post office.
Interpreting mobility data in metropolitan areas requires an in-depth understanding
of the urbanism and road mapping of the selected area. The choice of the location was
determined by the fact that one of the Authors was born and raised in the metropolitan
area of Genoa. Data collected for the study, including individual location data and a data
dictionary defining each field in the set are available in the online Supplementary Material.
2.4. Statistical Analysis
We calculated the median visit duration by activity for both the upper and the lower
limit of the range using the statistical software MedCalc (MedCalc Software Ltd, Ostend,
Belgium). We used these values as multipliers to estimate the risk of exposure to COVID-19
by type of activity. The choice of median values is consistent with Google’s method to
calculate mobility data changes across different categories of places [9]. The descriptive
statistics are reported in the online Supplementary Material.
The contact risk of Covid-19 transmission was defined by CDC as a deterministic
model, the product of one constant value (crowding) by one variable (duration). To estimate
the risk of exposure by activity, we used the median visit duration by location type as
reported by Google Map. Data on visit duration by store were non-random, since we did
not use a sample, and non-normally distributed. We tested the significance of the estimated
parameter (median visit duration by retail activity, φi ) by testing the hypothesis [10]:
Hypothesis 0 (H0): φi = 0.
Hypothesis 1 (H1): φi 6= 0.
(φi − 0)/(Std.error φi ) ∼
= tn − m (2)
where m is the number of parameters.
For α = 0.05
(φi − 0)/(Std.error φi ) > 2 (3)
To estimate the standard error of the median, visit duration data by retail activity
were resampled with replacement 1000 times using the statistical software Resampling Stat
in Excel version 2 (Resampling Stats, Inc., Arlington, VA, USA). The significance of the
derived parameter, the median value of visit duration, is reported in Table 1: all parameters
resulted significantly different from 0 (α = 0.05).
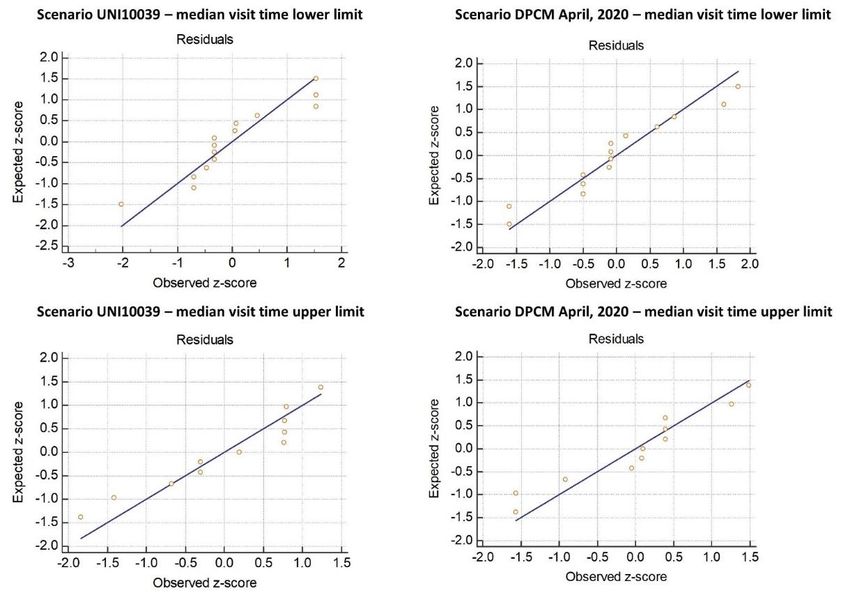
We then tested the accuracy of the contact risk model by regressing the median visit
duration by store type against the predicted risk values and checking for normality of
residuals. The normal plot of residuals for the four scenarios (crowding norm UNI10339
and DPCM 2020, lower and upper median values of visit duration by retail activity) are
reported in Figure 1. In all four scenario the hypothesis of normal distribution of residuals
could be accepted (Kolmogorov-Smirnov test).Int. J. Environ. Res. Public Health 2021, 18, 4632 4 of 14
Table 1. Significance of estimated parameter: median visit duration by retail activities.
Median Visit Duration by Retail Activity in the Metropolitan Area of Genoa (Italy)
Source: Google Maps 30 December 2020
Lower Limit of the Range Upper Limit of the Range
Retail Activities
Median Visit Standard Error Significance of Median Visit Standard Error Significance of
Sample (n) Duration Variance of the Median Median Values Sample (n) Duration Variance of the Median Median Values
(Minutes) (Resampled) (α = 0.05) (Minutes) (Resampled) (α = 0.05)
Pubs 22 60 3.8 3.8 15.6 ** 22 120 167.2 12.9 9.3 **
Pizza restaurants 41 60 0.8 0.8 73.1 ** 41 120 154.4 12.4 9.7 **
Fine-dining restaurants 36 60 12.6 12.6 4.8 ** 39 150 222.4 14.9 10.1 **
Gyms 10 53 13.9 13.9 3.8 ** 10 120 143.7 12.0 10.0 **
Hair salons 14 30 6.2 6.2 4.8 ** 14 90 305.3 17.5 5.2 **
Fast-food restaurants 19 25 4.2 4.2 5.9 ** 11 45 64.6 8.0 5.6 **
Food supermarkets * 170 20 1.8 1,8 11.1 ** N/A N/A N/A N/A N/A
Shopping centres 16 20 2.98 1.73 11.6 ** 16 60 93.5 9.7 6.2 **
Retail shops (non-food) 13 20 2.4 1.5 13.0 ** 86 25 0.4 0.7 38.2 **
Coffee shops 14 18 10.6 3.3 5.4 ** 10 60 38.7 6.2 9.6 **
Banks 38 15 0.1 0.4 38.9 ** 14 45 0.1 0.3 134.3 **
Pharmacies * 35 15 6.09 2.5 6.1 ** N/A N/A N/A N/A N/A
Post offices 57 15 6.2 2.49 6.0 ** 11 45 0.1 0.2 189.8 **
Gas stations * 20 10 2.4 1.5 13.6 ** N/A N/A N/A N/A N/A
* Google Maps only reported the average visit duration. ** Significantly different from 0 (values > 2 at α = 0.05).Int. J. Environ. Res. Public Health 2021, 18, 4632 5 of 14
Int. J. Environ. Res. Public Health 2021, 18, x 5 of 15
Figure 1. Regression of median visit duration against predicted contact risk for the four scenarios: controlling for normality
ofFigure 1. Regression of median visit duration against predicted contact risk for the four scenarios: controlling for normality
residuals.
of residuals.
The estimated predictors (median visit time by retail activity) was regressed against
the predicted contact
The estimated risk for four
predictors scenarios:
(median crowding
visit time norm
by retail UNI10039
activity) and DPCM
was regressed 2020,
against
lower and upper values of visit duration. The figure shows the Q-Q plot distribution
the predicted contact risk for four scenarios: crowding norm UNI10039 and DPCM 2020, of
residuals. For all scenarios the hypothesis of normal distribution of residual
lower and upper values of visit duration. The figure shows the Q-Q plot distribution of could be
accepted
residuals.(Kolmogorov-Smirnov test).
For all scenarios the hypothesis of normal distribution of residual could be ac-
cepted (Kolmogorov-Smirnov test).
3. Results
3.1. Study Sample and Inputs to the Model
3. Results
Food supermarkets
3.1. Study (n =
Sample and Inputs to 170), post offices (n = 57) banks (n = 38), and pharmacies
the Model
(n = 35) were among the most represented locations in the dataset (53.5% of total). This is
Food supermarkets (n = 170), post offices (n = 57) banks (n = 38), and pharmacies (n =
not surprising, since they fulfil vital needs of our daily life and they have not been subject
35) were among the most represented locations in the dataset (53.5% of total). This is not
to forced closures even during the first and second lockdown (in April and December
surprising, since they fulfil vital needs of our daily life and they have not been subject to
2020, respectively). Social activities, such as pizza restaurants (n = 41), fine dining (n = 39),
forced closures even during the first and second lockdown (in April and December 2020,
pubs (n = 22), fast-food (n = 19), and coffee shops (n = 14), represented 24% of the total
respectively). Social activities, such as pizza restaurants (n = 41), fine dining (n = 39), pubs
locations included in the sample, a true testament of the importance of personal contact in
(n = 22), fast-food (n = 19), and coffee shops (n = 14), represented 24% of the total locations
our culture. More controversial activities, such as hairdressers (n = 14) and gyms (n = 10)
included in the sample, a true testament of the importance of personal contact in our cul-
were also significantly represented in the sample.
ture. More controversial activities, such as hairdressers (n = 14) and gyms (n = 10) were
The median visit duration was reported as a range (upper and lower limits) for 11
also significantly represented in the sample.
out of 14 retail activities: for grocery shops, pharmacies and gas stations, Google Map
The median visit duration was reported as a range (upper and lower limits) for 11
displayed only the median average visit duration. The median visit time’s confidence
out of 14 retail activities: for grocery shops, pharmacies and gas stations, Google Map
intervals offer a plausible explanation to this reporting difference. While the dispersion is
displayed only the median average visit duration. The median visit time’s confidence in-
narrow for in-and-out daily activities (such as grocery shopping or filling-up the car at a
tervals offer a plausible explanation to this reporting difference. While the dispersion is
gas station), the variance of time spent in other activities can be better expressed as a range.
narrow for in-and-out daily activities (such as grocery shopping or filling-up the car at a
For example, a quick lunch in a restaurant takes on average less time than a three-course
gas station), the variance of time spent in other activities can be better expressed as a
dinner. Table 2 reports detailed information on the study sample and the inputs used to
range. For example, a quick lunch in a restaurant takes on average less time than a three-
calculate the risk of exposure to COVID-19 by retail activity.Int. J. Environ. Res. Public Health 2021, 18, 4632 6 of 14
Table 2. Study sample and inputs to the model.
Visit Duration by Retail Activity in the Metropolitan Area of Genoa, Italy Crowding Standard (Maximum
(Source: Google Maps, 30 December 2020) Number of People Allowed Per
Lower Limit of the Range Upper Limit of the Range Square Meter)
Retail Activities Median Median
MIN Median MAX Median MIN Median MAX Median DPCM Anti
Sample Visit 95% Confidence Sample Visit 95% Confidence UNI10339
Visit Duration Visit Duration Visit Duration Visit Duration Covid-19
(n) Duration Interval of the Median (n) Duration Interval of the Median (October 2008)
(Minutes) (Minutes) (Minutes) (Minutes) (April 2020)
(Minutes) (Minutes)
Pubs 22 60 45 60 15 90 22 120 120 150 90 180 0.66 0.250
Pizza restaurants 41 60 60 60 20 120 41 120 120 150 90 180 0.66 0.250
Fine-dining
36 60 60 90 30 90 39 150 120 150 60 180 0.66 0.250
restaurants
Gyms 10 53 20 60 5 90 10 120 90 120 45 150 0.66 0.250
Hair salons 14 30 25 45 10 60 14 90 60 123 60 180 0.80 0.250
Fast-food restaurants 19 25 15 30 10 45 11 45 45 65 30 90 0.25 0.250
Food supermarkets * 170 20 20 20 5 45 N/A N/A N/A N/A N/A N/A 0.20 0.200
Shopping centres 16 20 20 27 10 30 16 60 60 90 45 90 0.20 0.200
Retail shops
13 20 18 25 15 30 86 25 25 25 10 90 0.20 0.075
(non-food)
Coffee shops 14 18 15 25 10 30 10 60 45 60 45 90 0.20 0.075
Banks 38 15 15 15 10 30 14 45 45 45 45 90 0.20 0.075
Pharmacies * 35 15 15 15 10 20 N/A N/A N/A N/A N/A N/A 0.20 0.075
Post offices 57 15 15 20 10 25 11 45 45 45 45 60 0.20 0.075
Gas stations * 20 10 10 10 10 15 N/A N/A N/A N/A N/A N/A 0.20 0.075
* Google Maps only reported the average visit duration.Int. J. Environ. Res. Public Health 2021, 18, 4632 7 of 14
A simple vertical and horizontal analysis of visit duration data by activity provides
valuable insights on the potential risk of exposure to COVID-19 when we go out.
The vertical analysis shows that we spend at least one hour in restaurants and pubs,
a visit duration which is three to six-fold higher than any other activity. Moreover, the
median visit duration to restaurants and gyms more than doubles at the upper limit of the
range, providing a clear indication that social activities and indoor exercise should be, and
are, a key priority for the containment of the diffusion of COVID-19.
The horizontal comparison between lower and upper limits of the median visit time
range reflects our collective behavior’s typical traits, making the differences more credible.
For example, a quick espresso at the bar counter takes about 17 min, while an aperitif
followed by an animated discussion about football can go on for an hour. Even fast food
can be not so fast in Italy: a hamburger gobbled up between two lectures takes about 25
min, but if we sit down to plan the evening with our friends, then the median duration of
the visit can almost double.
We used both publicly available norms (UNI10339 and DPCM, 19 April 2020) to define
the maximum crowding standard (number of people per square meter) expected for each
activity included in our sample.
3.2. Absolute and Relative Risk of Exposure to COVID-19 by Retail Activity under Crowding
Norm UNI10339 (Antecedent the First Lockdown in March 2020)
The absolute values show a quite alarming variance of risk exposure to COVID-19
depending on our choice of activity and time spent on a retail premise. The range of
exposure goes from a minimum of 1.39 when we stop at a gas station to a record high of
68.64 if we decide to reward ourselves with a nice dinner out in a fine dining restaurant.
Within the same activity, the risk of exposure for a quick work-out in a gym is 9.1, but it can
more than double for prolonged fitness training (20.8). It is even worse for coffee shops: an
espresso at the counter gives an exposure of 9.7, while our beloved habit of continuing an
animated conversation at a table can cost us a risk over three times higher (33.3).
Daily errands such as grocery shopping or going to the bank, pharmacy or post office
seem to carry a much lower risk of exposure to COVID-19 (ranging from just above 2 to
4). This is a relief, not only because such activities are indispensable to our daily lives, but
also because they are an essential part of older people’s daily routine, most vulnerable to
COVID-19 infection [11].
Table 3 summarizes the absolute and relative risk of exposure to COVID-19 by retail
activity before the first lockdown initiated on 9 March 2020.Int. J. Environ. Res. Public Health 2021, 18, 4632 8 of 14
Table 3. Absolute and relative risk of exposure to COVID-19 before the first lockdown (crowding norm UNI10339, October 2008).
Median Visit
Median Visit Absolute Risk of Exposure to Relative Risk of Exposure to COVID-19
Duration as a Fraction Crowding (People in the Contact Area)
Duration (Minutes) COVID-19 (Gas Stations = 1)
of 15 min
UNI10339 Close Contact
Retail Activities Crowding Area in Max of People
Lower Upper Lower Upper
Standard Square in the Contact Lower Limit Upper Limit Lower Limit Upper Limit
Limit Limit Limit Limit
(People Per Meters (CDC, Area
Square Meter) Oct 2020)
a b a/15 b/15 c d c×d (a/15) × c × d (b/15) × c × d [(a/15) × c × d]/1.39 [(b/15) × c ×d]/1.39
/Fine-dining
60 150 4.00 10.00 0.7 10.4 6.86 27.46 68.64 19.8 49.4
restaurants
Pizza restaurants 60 120 4.00 8.00 0.7 10.4 6.86 27.46 54.91 19.8 39.5
Pubs 60 120 4.00 8.00 0.7 10.4 6.86 27.46 54.91 19.8 39.5
Fast-food restaurants 25 45 1.67 3.00 0.7 10.4 6.86 11.44 20.59 8.2 14.8
Coffee shops 18 60 1.17 4.00 0.8 10.4 8.32 9.71 33.28 7.0 23.9
Gyms 53 120 3.50 8.00 0.3 10.4 2.60 9.10 20.80 6.5 15.0
Hair salons 30 90 2.00 6.00 0.2 10.4 2.08 4.16 12.48 3.0 9.0
Shopping centres 20 60 1.33 4.00 0.2 10.4 2.08 2.77 8.32 2.0 6.0
Retail shops (non-food) 20 25 1.33 1.67 0.2 10.4 2.08 2.77 3.47 2.0 2.5
Food supermarkets * 20 1.33 0.2 10.4 2.08 2.77 2.0
Pharmacies * 15 1.00 0.2 10.4 2.08 2.08 1.5
Banks 15 45 1.00 3.00 0.2 10.4 2.08 2.08 6.24 1.5 4.5
Post offices 15 45 1.00 3.00 0.2 10.4 2.08 2.08 6.24 1.5 4.5
Gas stations * 10 0.67 0.2 10.4 2.08 1.39 1.0
* Google Maps only reported the average visit duration.Int. J. Environ. Res. Public Health 2021, 18, x 10 of 15
Int. J. Environ. Res. Public Health 2021, 18, 4632 9 of 14
3.3. Absolute and Relative Risk of Exposure after the First Lockdown (Crowding Norm DPCM,
3.3. Absolute and Relative Risk of Exposure after the First Lockdown (Crowding Norm DPCM, 19
19 April
April 2020)
2020)
Followingthe
Following thefirst
firstlockdown,
lockdown,the theItalian
Italian Government
Government decided
decided to to reduce
reduce thethe crowd-
crowding
ing standards for all premises open to the public. Figure 2 shows the
standards for all premises open to the public. Figure 2 shows the reduction in the number reduction in the
number
of of closeexpected
close contacts contactsin expected in a radius
a three-foot three-foot radiustocompared
compared the previousto the
normprevious norm
(UNI10339).
(UNI10339).
The The drop
drop exceeded 60% forexceeded 60%activities,
most daily for mostwhile
dailyonly
activities,
gyms, while only gyms,
hair salons, hair sa-
and shopping
lons, and
centers shopping
were centers
unaffected were
by the newunaffected
norm. by the new norm.
Left scale: the grey columns report
Left scale: the grey columns report the themaximum
maximumnumbernumberof ofpeople
peopleallowed
allowedbybythe
the
UNI10339 (October, 2008) norm in a six-feet radius space by retail activity.
UNI10339 (October 2008) norm in a six-feet radius space by retail activity. The blue columns The blue col-
umns the
report report the maximum
maximum numbernumber
of people ofallowed
people allowed by the
by the Prime Prime Ministerial
Ministerial Decree
Decree (DPCM)
(DPCM) anti-COVID
anti-COVID (April,
(April 2020) 2020)activity.
by retail by retailRight
activity. Right
scale: thescale: the shows
red line red line shows
the the
percent
percent reduction
reduction in the of
in the number number
closedof closed determined
contacts contacts determined
by the DPCMby thebyDPCM by compar-
comparison with
isonUNI10339
the with the UNI10339
norm. norm.
Figure
Figure2.2.Number
Numberofofclose
closecontacts
contactsininaa6-feet
6-feetradius
radiusby
byretail
retailactivity.
activity.
Table44summarizes
Table summarizes the impact of of the
the reduction
reductionofofcrowding
crowdingstandards
standardsononthe therisk of
risk
exposure
of exposure totoCOVID-19
COVID-19after
afterthe
theDPCM
DPCMin inApril
April 2020.
2020. In
In summary, the
the new
new crowding
crowding
norm introduced
norm introduced after
after lockdown
lockdown substantially
substantially confirmed
confirmed aa three-tier
three-tier risk
risk structure
structure for
for
daily
dailyactivities:
activities:
(1)
1) HIGH RISK (minimum
(minimum relative
relative risk
risk >10):
>10): fine-dining
fine-dining restaurants,
restaurants, pizza
pizza restaurants,
restaurants,
pubs and gyms;
pubs and gyms;
(2)
2) MEDIUM
MEDIUM RISKRISK(minimum
(minimum relative
relativeriskrisk
>5, >5,
but but
likely to exceed
likely the threshold
to exceed of HIGH
the threshold of
RISK
HIGHbased
RISK on the on
based duration of the of
the duration visit): fast-food
the visit): restaurants,
fast-food coffeecoffee
restaurants, shops,shops,
hair
salons, shopping
hair salons, centers;
shopping centers;
(3)
3) LOW
LOW RISK
RISK (relative
(relative risk
risk always
alwaysInt. J. Environ. Res. Public Health 2021, 18, 4632 10 of 14
Table 4. Absolute and relative risk of exposure after the first lockdown (crowding norm DPCM, April 2020).
Median Visit
Median Visit Absolute Risk of Exposure to Relative Risk of Exposure to COVID-19
Duration as a Fraction Crowding (People in the Contact Area)
Duration (Minutes) COVID-19 (Gas Stations = 1)
of 15 min
DPCM Anti
Close Contact
Retail Activities Covid-19, Max Number
Area in
Lower Upper Lower Upper Crowding of People in
Square Lower Limit Upper Limit Lower Limit Upper Limit
Limit Limit Limit Limit Standard the Contact
Meters (CDC,
(People Per Area
October 2020)
Square Meter)
a b a/15 b/15 c d c×d (a/15) × c × d (b/15) × c × d [(a/15) × c × d]/0.52 [(b/15) × c × d]/0.52
Fine-dining restaurants 60 150 4.00 10.00 0.250 10.40 2.60 10.40 26.00 20.0 50.0
Pizza restaurants 60 120 4.00 8.00 0.250 10.40 2.60 10.40 20.80 20.0 40.0
Pubs 60 120 4.00 8.00 0.250 10.40 2.60 10.40 20.80 20.0 40.0
Fast-food restaurants 25 45 1.67 3.00 0.250 10.40 2.60 4.33 7.80 8.3 15.0
Coffee shops 18 60 1.17 4.00 0.250 10.40 2.60 3.03 10.40 5.8 20.0
Gyms 53 120 3.50 8.00 0.250 10.40 2.60 9.10 20.80 17.5 40.0
Hair salons 30 90 2.00 6.00 0.200 10.40 2.08 4.16 12.48 8.0 24.0
Shopping centres 20 60 1.33 4.00 0.200 10.40 2.08 2.77 8.32 5.3 16.0
Retail shops (non-food) 20 25 1.33 1.67 0.075 10.40 0.78 1.04 1.30 2.0 2.5
Food supermarkets * 20 1.33 0.075 10.40 0.78 1.04 2.0
Pharmacies * 15 1.00 0.075 10.40 0.78 0.78 1.5
Banks 15 45 1.00 3.00 0.075 10.40 0.78 0.78 2.34 1.5 4.5
Post offices 15 45 1.00 3.00 0.075 10.40 0.78 0.78 2.34 1.5 4.5
Gas stations * 10 0.67 0.075 10.40 0.78 0.52 1.0
* Google Maps only reported the average visit duration.Int. J. Environ. Res. Public Health 2021, 18, 4632 11 of 14
4. Discussion
This study used the mean visit duration for the first time, a new feature of Google
Maps to determine the risk of exposure to COVID-19 for many daily activities in a specific
community, the metropolitan area of Genoa, Italy. The study found a significant variance
in the risk of exposure among different activities and, for the same activity, among different
locations. Since the study was informed by publicly available mobility and crowding data,
this simple method could inform individual choices when deciding to go out, containing
the risk of COVID infection by merely avoiding or reducing exposure to crowded locations.
Since this study is the first of a kind, we should answer some fundamental methodological
questions before recommending its wider adoption. The first question concerns the appro-
priateness of mobility data to inform COVID-19 analysis of risk exposure. Google publicly
discloses aggregated, anonymised GPS location data at metropolitan level containing users’
density and proximity data. Accepted applications of location data include changes to
population-level mobility and clustered behaviours useful to understand the risk of close
contact, retrace likely diseases introduction and, most importantly, to inform the projections
of risk of disease [12]. The second question is about the use of crowding standards, which
measure the maximum number of people allowable in a premise rather than the actual
number of individuals in the store at any given time. Actual crowding data can be ob-
tained by learning location profiles from heterogeneous mobility datasets based on gravity
models [13]. Collecting individual mobility data requires massive computational capacity
and a standard for exchanging data between mobile operators and regulators (Mobility
Data Specification). The outcomes of gravity models can inform public health policies but
are of little help when making individual decisions about going out. Conversely, crowding
standards are easier to understand for the general public: based on the DPCM norm, you
should expect at least one but no more than three people in your closed contact risk area, a
circle of six feet radius. If you can see more than three people around you, you know that
the premise is overcrowded. The third question concerns the accuracy of predicting the risk
of exposure to COVID-19 by activity based on crowding standards and the visit duration.
Predicting the risk of exposure to COVID-19 by activity based on crowding standards
and the visit duration accurately reflects the containment priorities and emergency mea-
sures in place so far by the Italian Government. Most of the activities have been affected by
a drastic reduction of crowding standards, after the DPCM in April 2020. Restaurants and
pubs have been closed down during the lockdown in April and December. Their opening
hours have been drastically reduced across the period, with no service in the premises
allowed after 6 p.m. Gyms are still closed. Coffee shops, fast-food restaurants, and hair
salons have also been closed down during lockdown, and their opening hours reduced as
well when re-opening has been allowed. Retail shops (non-food) were closed during the
lockdown, but their activity resumed as usual when the lockdown was lifted. Activities
showing the lowest risk level, such as grocery supermarkets, pharmacies, banks, post
offices and gas stations, have never been closed and their store hours never reduced.
When we include the use of facial masks, the assessment of exposure to COVID-19
based on crowding standards and visit duration may have underestimated the risk for
social activities, already ranked at the highest level of concern. When eating a meal or
sipping a coffee, you necessarily put your mask down. Considering that face masks may
significantly reduce the exposure to the virus [14], the risk of exposure to COVID-19 for
restaurants of any kind (including fast food), pubs, and coffee shops can be greater than
expected. Also, the notion of crowding standards may have contributed to understate the
risk of social activities. Crowding standards account for the maximum allowable people
per square meter, but they do not tell us how long the same person stays at least 15 min in
a six-foot radius. Social activities, such as dining out, sitting at a coffee shop, or having
a burger meal at the table carry a higher likelihood to have the same individuals around
for longer than fifteen minutes than moving along the aisle of a supermarket or making
an enquiry at the desk of a bank or a post office. Exercising at a gym or having your hair
done at the hairdresser are also likely to carry a higher risk than filling a prescription atInt. J. Environ. Res. Public Health 2021, 18, 4632 12 of 14
the pharmacy or refuelling your car. We can conclude that the use of face masks and the
likelihood of permanence in a six feet radius does not change the distribution of the risk of
exposure to COVID-19 as found by our study.
The risk of exposure to COVID-19, measured as the product of crowding standards
times median visit duration, can be useful to inform public health policies and individual
decision about going out.
The intuitive, numeric form that we chose to define the risk of exposure can help
policymakers effectively communicate the urgency of drastic containment measures to
limit the diffusion of COVID-19. These measures are currently imposed on the general
population as mandatory norms, without a transparent explanation of why these prohibi-
tions are necessary preventive measures and not just arbitrary limitations of individual
freedom. Prohibitions are generally poorly tolerated and, in the long run, the adherence
to the new norms on daily lifestyle sharply decreases [15]. As an example, eating out is
an essential part of the Italian lifestyle. The prolonged closure of restaurants, followed by
a severe limitation of their opening hours (take-away and delivery only after 6 p.m.) has
generated a vast dissatisfaction in the population, craving for social contact after a full
year of distancing. It is conceivable that individuals would react differently if they were
told that dining out carries the highest absolute risk of exposure to COVID-19 (from 10
to 26), fifty times higher than refuelling the car at a gas station or 20 times higher than
grocery shopping. The use of a numerical indicator would have probably placated sooner
the controversy about the re-opening of gyms and hair salons, which may carry a risk of
exposure similar to dining out in case of prolonged duration of the visit [16,17].
This study’s main contribution is defining a single number to indicate the relative risk
of exposure to COVID-19 for most of the activities that we need to perform in our daily
lives. Moreover, for the same activity, it allows us to choose between different locations
in our community where the absolute risk of exposure is lower. For example, when you
decide to go to the post office, Google Maps can help you choose the location with the
shortest mean duration of the visit. In Genoa’s metropolitan area, the post office in Via
Dante shows a mean visit duration of 45 min, while the post office in Via Ilva has a mean
visit duration of just 15 min. The two offices are both downtown, only 700 m away from
each other: a ten-minute walk can bring the risk of exposure to COVID-19 down to one
third [18].
This research presents some limitations. The study is subject to a risk of selection bias
in the population for whom data is available, limited to smartphone users who have turned
on the Location History setting, which is off by default. This is a general limitation imposed
by the use of GPS mobility data [19]. Spatially and temporally aggregated mobility data
also do not capture differences in how individuals use their phones, making unfeasible
any further cohort analysis (e.g., by users’ age, gender or income). No data privacy issue
is associated with the mobility data used to inform our risk model. Google Map publicly
provides the duration of visit data by premise in a strictly aggregated and anonymised
form. No personally identifiable information, such as an individual’s location, contacts or
movement, was made available at any point.
5. Conclusions
Our study enables everyone to understand the potential risk of going out and to make
a responsible choice of daily activities in the community of residence.
Firstly, we used a working definition of risk of exposure leading to a simple, numerical
value. Everybody understands the absolute and relative difference between two numbers:
as an example, ten is simply five times higher than two.
Secondly, the definition of the two main factors of risk, crowding and visit duration,
is intuitive.
Crowding refers to the number of people standing in a circle of three feet radius
centred around you. The visit duration simply refers to the number of minutes you spend
on average in a store or public office. The new feature of Google Maps allows everyone toInt. J. Environ. Res. Public Health 2021, 18, 4632 13 of 14
be informed about the mean visit duration for many locations in their community. Since
the crowding standards are the same for each type of activity, this simple, easy to get
information can guide everyone’s daily routine activities.
The possibility to measure the risk of exposure by a single location can inform national
and public policies aimed to contain the COVID-19 pandemic. More importantly, using a
local, numeric value to define the risk can help policymakers make explicit the rationale
of measures that have a hard impact on the population’s social life, improving adherence
over time.
The most significant impact of this research is to make aware individuals of the
absolute and relative risk of exposure to COVID-19, empowering them to make active
choices when they decide to go out.
The study’s findings suggest that the new data on the visit duration provided by
Google Map can help understand the risk of exposure to COVID-19 associated with the
most common activities in our daily life. The empirical determination of risk defined in
our study can inform national and local public health policies to contain the pandemic’s
diffusion. Its simple numerical form can help policymakers effectively communicate
difficult decisions concerning our daily lives, justifying their rationale using a language
that everyone can understand. Lastly, risk data by location can help us rethinking our daily
routine and making informed, responsible choices when we decide to go out.
Supplementary Materials: The following are available online at https://www.mdpi.com/article/10
.3390/ijerph18094632/s1. All data supporting this study.
Author Contributions: Conceptualization, C.O. and G.F.; methodology, C.O. and G.F.; data collection,
C.O.; data analysis, C.O.; writing—original draft preparation, C.O.; writing—review and editing,
G.F.; project administration, C.O. All authors have read and agreed to the published version of the
manuscript.
Funding: This research received no external funding.
Institutional Review Board Statement: Not applicable.
Informed Consent Statement: Not applicable.
Data Availability Statement: All data supporting this study can be found in the Supplementary
Materials.
Conflicts of Interest: The authors declare no conflict of interest.
References
1. Gazzetta Ufficiale. Raccolta Degli Atti Recanti Misure Urgenti in Materia di Contenimento e Gestione Dell’emergenza Epidemio-
logica da COVID-19. Available online: https://www.gazzettaufficiale.it/attiAssociati/1/?areaNode=13 (accessed on 7 January
2021).
2. AGI Agenzia Italia. Ferragni e Fedez Testimonial Anti Covid? Le Reazioni sui Social. 25 October 2020. Available online:
https://www.agi.it/cronaca/news/2020-10-25/fedez-ferragni-testimonial-anti-covid-reazioni-social-10059914/ (accessed on 11
January 2021).
3. Centers for Disease Control and Prevention (CDC). Social Distancing. Available online: https://www.cdc.gov/coronavirus/2019
-ncov/prevent-getting-sick/social-distancing.html (accessed on 21 December 2020).
4. Centers for Disease Control and Prevention (CDC). Appendix A—Glossary of Key Terms: Close Contact. Available online:
https://www.cdc.gov/coronavirus/2019-ncov/php/contact-tracing/contact-tracing-plan/appendix.html#contact (accessed on
11 January 2021).
5. Standard UNI 10339. Appendix A. Version Updated on 17 October 2008. Available online: http://www.ctslab.eu/doc/Revisione_
UNI_10339_del_081017.pdf (accessed on 21 December 2020).
6. Gazzetta Ufficiale. Prime Ministerial Decree (DPCM) of 26 April 2020. Available online: https://www.gazzettaufficiale.it/eli/id/
2020/04/27/20A02352/sg (accessed on 11 January 2021).
7. National Institute for Occupational Accident Insurance (INAIL). Documento Tecnico su Ipotesi di Rimodulazione delle Misure
Contenitive del Contagio da SARS-CoV-2 nel Settore della Ristorazione. May 2020. Available online: https://marcigaglia.it/wp-
content/uploads/2020/05/Documento-tecnico-ristorazione-2-compresso.pdf (accessed on 22 December 2020).
8. Google My Business Help. Popular Times, Wait Times, and Visit Duration. Available online: https://support.google.com/
business/answer/6263531?hl=en (accessed on 11 January 2021).Int. J. Environ. Res. Public Health 2021, 18, 4632 14 of 14
9. Google LLC. Google COVID-19 Community Mobility Reports. Available online: https://www.google.com/covid19/mobility
(accessed on 12 January 2021).
10. Newbold, P. The Principles of the Box-Jenkins Approach. Oper. Res. Q. 1975, 26, 397–412. Available online: www.jstor.org/stable/
3007750 (accessed on 20 April 2021). [CrossRef]
11. Ningthoujam, R.; Khomdram, D. WHO statement—“Older people are at highest risk from COVID-19”: Should the hypothesis be
corroborated or rejected? Med. Hypotheses 2020, 144, 109896. [CrossRef] [PubMed]
12. Grantz, K.H.; Meredith, H.R.; Cummings, D.A.; Metcalf, C.J.E.; Grenfell, B.T.; Giles, J.R.; Wesolowski, A. The use of mobile phone
data to inform analysis of COVID-19 pandemic epidemiology. Nat. Commun. 2020, 11, 4961. [CrossRef] [PubMed]
13. Ashbrook, D.; Starner, T. Using GPS to learn significant locations and predict movement across multiple users. Pers. Ubiquitous
Comput. 2003, 7, 275–286. [CrossRef]
14. MacIntyre, C.R.; Chughtai, A.A. A rapid systematic review of the efficacy of face masks and respirators against coronaviruses
and other respiratory transmissible viruses for the community, healthcare workers and sick patients. Int. J. Nurs. Stud. 2020, 108,
103629. [CrossRef] [PubMed]
15. Czeisler, M.É.; Tynan, M.A.; Howard, M.E.; Honeycutt, S.; Fulmer, E.B.; Kidder, D.P.; Robbins, R.; Barger, L.K.; Facer-Childs, E.R.;
Baldwin, G.; et al. Public Attitudes, Behaviors, and Beliefs Related to COVID-19, Stay-at-Home Orders, Nonessential Business
Closures, and Public Health Guidance—United States, New York City, and Los Angeles, 5–12 May 2020. Morb. Mortal. Wkly. Rep.
2020, 69, 751–758. [CrossRef] [PubMed]
16. Lamorte, A. Palestre e Piscine, L’ultimatum del Governo è una Barzelletta: Perché non Punire solo chi non è a Norma? Il
Riformista. 19 October 2020. Available online: https://www.ilriformista.it/palestre-e-piscine-lultimatum-del-governo-e-una-
barzelletta-perche-non-punire-solo-chi-non-e-a-norma-168775 (accessed on 14 January 2021).
17. Adnkronos News. Boschi: Perché Chiudere Parrucchieri se Rispettano Regole? 17 October 2020. Available online: https:
//www.adnkronos.com/boschi-perche-chiudere-parrucchieri-se-rispettano-regole_65Y9MQMGoDIl2JUeic1NRv (accessed on
14 January 2021).
18. Google Maps Mobility Data Obtained from a Smart Phone. Available online: https://www.google.com/maps/place/Gnova+
GE/@44.4468921,8.7507486,11z/data=!3m1!4b1!4m5!3m4!1s0x12d34152dcd49aad:0x236a84f11881620a!8m2!3d44.4056499!4d8.9
46256 (accessed on 14 January 2021).
19. Vazquez-Prokopec, G.M.; Bisanzio, D.; Stoddard, S.T.; Paz-Soldan, V.; Morrison, A.C.; Elder, J.P.; Kitron, U. Using GPS Technology
to Quantify Human Mobility, Dynamic Contacts and Infectious Disease Dynamics in a Resource-Poor Urban Environment. PLoS
ONE 2013, 8, e58802. [CrossRef] [PubMed]You can also read