Quantitative Risk Assessment Model of Human Salmonellosis Resulting from Consumption of Broiler Chicken - MDPI
←
→
Page content transcription
If your browser does not render page correctly, please read the page content below

Article
Quantitative Risk Assessment Model of Human
Salmonellosis Resulting from Consumption of
Broiler Chicken
Luma Akil 1 and H. Anwar Ahmad 2,*
 1 Department of Behavioral and Environmental Health, School of Public Health, Jackson State University,
   Jackson, MS 39211, USA; luma.akil@jsums.edu
 2 Department of Biology/Environmental Science, College of Science, Engineering and Technology,

   Jackson State University, Jackson, MS 39217, USA
 * Correspondence: hafiz.a.ahmad@jsums.edu; Tel.: +011-601-979-4048

 Academic Editor: Amal K. Mitra
 Received: 30 December 2018; Accepted: 5 February 2019; Published: 7 February 2019

 Abstract: (1) Background: Salmonella infections are a major cause of illnesses in the United States.
 Each year around 450 people die from the disease and more than 23,000 people are hospitalized.
 Salmonella outbreaks are commonly associated with eggs, meat and poultry. In this study, a
 quantitative risk assessment model (QRAM) was developed to determine Salmonella infections in
 broiler chicken. (2) Methods: Data of positive Salmonella infections were obtained from the United
 States Department of Agriculture (USDA) and the Centers for Disease Control and Prevention
 (CDC) Foodborne Disease Outbreak Surveillance System, in addition to published literature. The
 Decision Tools @RISK add-in software was used for various analyses and to develop the QRAM.
 The farm-to-fork pathway was modeled as a series of unit operations and associated pathogen
 events that included initial contamination at the broiler house (node 1), contamination at the
 slaughter house (node 2), contamination at retail (node 3), cross-contamination during serving and
 cooking (node 4), and finally the dose–response model after consumption. (3) Results: QRAM of
 Salmonella infections from broiler meat showed highest contribution of infection from the retail node
 (33.5%). (4) Conclusions: This QRAM that predicts the risk of Salmonella infections could be used as
 a guiding tool to manage the Salmonella control programs

 Keywords: Salmonella; broiler chicken; risk assessment; farm-to-fork; food safety.

1. Introduction
     Salmonella is a critical foodborne pathogen worldwide with an estimated 1.2 million illnesses,
23,000 hospitalizations, and 450 deaths in the United States of America (USA) every year [1]. Non-
typhoidal Salmonella infections are the most commonly reported bacteriological agent of human
foodborne diseases in the USA. It was estimated to contribute 11% of foodborne human illnesses,
35% of hospitalizations, and 28% of deaths attributable to infections by known foodborne pathogens,
thereby ranking highest among all bacterial foodborne pathogens with approximately 44% of
confirmed foodborne bacterial infections [1,2,3]. Prevalence of several factors including geographical
location, climatic variability, farming practice, socioeconomic factors and consumer habits
contributes to differences in Salmonella infections and incidences [4,5].
     Raw poultry and meat products consumption remain the principal source of Salmonella in many
countries. Salmonella has been reported in a variety of chicken, turkey and other meat products, in
addition to fresh produce such as lettuce and sprouts [6]. Studies have reported that poultry is found
to be associated with 25% of outbreaks, illnesses, and hospitalizations caused by a confirmed
foodborne pathogen [7,8]. The main reservoir of non-typhoidal Salmonella is the intestinal tract of
Diseases 2019, 7, 19; doi:10.3390/diseases7010019                             www.mdpi.com/journal/diseases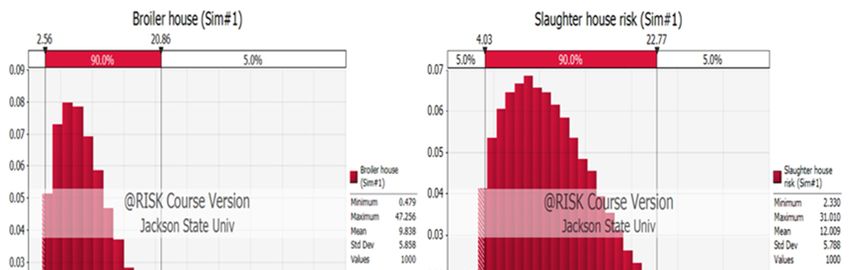
Diseases 2019, 7, 19                                                                            2 of 11

animals, which will easily lead to contamination of diverse food products. Salmonella is carried by
different animals and may contaminate fresh water by direct or indirect contact, which may lead to
contamination of fresh produce as well. Poultry is frequently colonized with Salmonella without
detectable symptoms. As a result, it was suggested that poultry is the main human health risk factor,
as it allows the bacteria to easily transmit from table eggs and poultry meat to humans [9].
      Salmonella serotypes associated with human infections are able to persist along the food chain
(during the primary production, slaughter operations, equipment, meat handlers, and retail). As live
birds are processed, the existing bacterium is introduced to the poultry production system, and each
stage of processing is a potential point for the environment for Salmonella contamination. Salmonella
could, therefore, spread from carcass to carcass along the processing stages [9]. During any of the
steps in the farm-to-consumer continuum, further microbial contamination can occur from a variety
of sources, such as environmental, animal or human, including risk of pathogenic microorganisms
[10,11]. The efficient transmission and the rapid spread are of public health relevance. A greater
understanding of salmonellosis and the source that contributes to the high rates of the disease is very
critical.
      In food safety, a quantitative risk assessment model (QRAM) describing the risk pathway
usually begins with determination of the hazard on the farm, and ends with the dose received by the
consumer or the number of human illness cases [12]. Risk assessment provides estimates on the
probability of disease occurrence based on four steps: hazard identification, exposure assessment,
hazard characterization (dose–response relationship), and risk characterization. There is, therefore, a
strong need to provide data on the frequency and level of Salmonella contamination in meat and meat
products. The QRAM aims to describe the dynamics of bacteria in a food chain and its concentration
per unit of a given food item. This variation is dependent on the variable describing the number of
bacteria at a previous stage or node and associated process parameters, like temperature, time, and
acidity. In each module, one or more of the basic microbiological processes and processing stages of
inactivation, growth, partitioning, mixing, removal and cross-contamination are modeled. These
processes are defined by functional relations, having the process parameters and the concentrations
of the bacteria at a previous module as arguments of the functions. The final model is obtained by
linking the nodes, passing information from one node to the next [12,13].
      Predictive food microbiology is a rapidly developing area of food microbiology. It allows
estimating the contamination levels of pathogens at different stages to ensure safety and quality of
food product. QRAM is widely used in literature to estimate the probability of Salmonella infections
at different stages of food production. In this research, a general framework to understand the
contributing sources of Salmonella during the broiler production process is explored.
      Objectives: Risk assessment is widely used by governmental and regulatory agencies worldwide
to protect public health from exposure to a myriad of contaminants through numerous routes of
exposure. The objective of this study is to determine human risk of Salmonella due to broiler
consumption using QRAM from the farm-to-fork infection pathway.

2. Materials and Methods
      Quantitative risk assessment uses probability distributions to model the variability and
uncertainty of important risk factors, such as time, temperature and pathogen density. The QRAM is
simulated using a spreadsheet add-in program that randomly samples the probability distributions
and uses the random numbers generated to perform calculations and generate output distributions
[13]. The QRAM forecasts the risk using Monte Carlo simulation. The basic idea behind the Monte
Carlo simulation procedure is that the simulation is iteratively refined during a number of iterations,
giving feasible representations of a real-world situation. At each iteration, numbers are drawn from
the probability distributions representing the variability of the given process. The number of
iterations is preset, or dependent on the convergence behavior of the simulation. The results of
iterations are stored. At the end, statistical methods may be employed in order to extract summary
data from the results [13–15].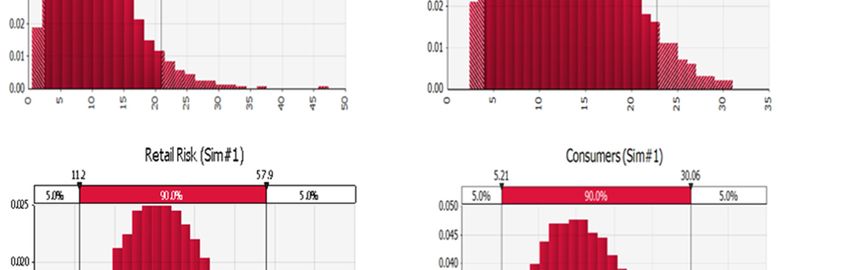
Diseases 2019, 7, 19                                                                                  3 of 11

     In this study, a quantitative risk assessment for Salmonella in broiler chicken was constructed in
a Microsoft Excel (Microsoft, Redmond, WA) spreadsheet and was simulated using the Decision
Tools @Risk (version 7.5.1, Palisade, Newfield, NY), which is an add-in for Microsoft Excel that
performs risk analysis on any spreadsheet model by using Monte Carlo simulation.
     The farm-to-fork pathway was modeled as a series of unit operations and associated pathogen
events that included initial contamination at the broiler house (node 1), contamination at the
slaughter house (node 2), contamination at retail (node 3), cross-contamination during serving and
cooking (node 4), and finally the dose–response model after consumption (Figure 1).

      Figure 1. Probability framework of Salmonella infections at different nodes using the farm-to-fork
      pathway.

2.1. Risk Assessment Model

2.1.1. Node One: Broiler House
     The United States Department of Agriculture Food Safety and Inspection Service (USDA FSIS)
uses data from its regulatory testing programs to monitor the effectiveness of its Pathogen
Reduction/Hazard Analysis and Critical Control Point Systems Final Rule, and to assess process
control in individual establishments [16,17]. The U.S. Department of Health and Human Services has
incorporated the target of 11.4 cases of salmonellosis/100,000 persons into the Healthy People 2020
objectives aimed at a 25 percent reduction in human illnesses (HealthyPeople.gov, 2018), which FSIS
recognizes as appropriate guidance for the agency's strategic planning to strengthen public health
protection.
     Data of percent positive Salmonella test were obtained from the USDA FSIS “Progress Report on
Salmonella and Campylobacter Testing of Raw Meat and Poultry Products, 1998–2011” [16]. The
average percent of positive Salmonella in broiler chicken from 2003 to 2011 is given in Table 1.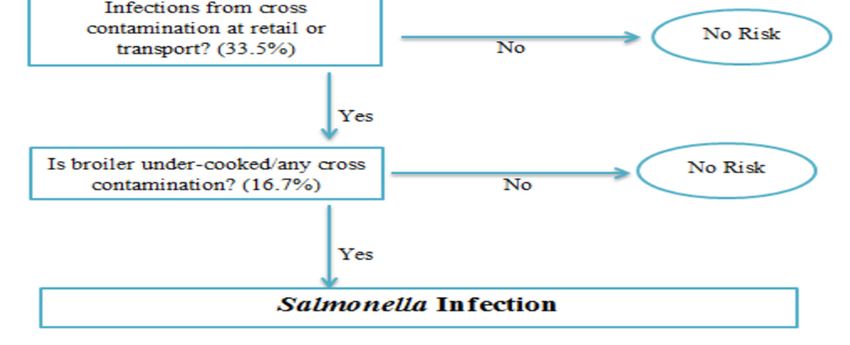
Diseases 2019, 7, 19                                                                                4 of 11

                       Table 1. Percent positive Salmonella in broiler chicken during 2003–2011.

                                                              Positive Salmonella
                                            Year
                                                                       %
                                            2003                      11.2
                                            2004                      13.5
                                            2005                      16.3
                                            2006                      11.4
                                            2007                       8.5
                                            2008                       7.3
                                            2009                       7.2
                                            2010                       6.7
                                            2011                       6.5
 Data Source: The United States Department of Agriculture Food Safety and Inspection Service (USDA FSIS).

     The data were graphed in Excel and the distributions for the node was defined using @RISK
define distribution function. The gamma distribution was the appropriate selection for this type of
data based on the slope; and related parameters, alpha (3.284) and beta (3.45), were generated using
Excel. Monte Carlo simulation with 1000 iterations using alpha and beta values was selected. During
the simulation, @Risk randomly samples values across the full range of the curve and recalculates the
spreadsheet using random values sampled from the input distribution functions and record the
output values to determine the risk for the first node. For each iteration, a new randomly generated
value is placed in the Excel cell. When the simulation is completed, the results are shown in the
@Risk’s results window.

2.1.2. Node Two: Slaughter House
     The second node of the risk assessment model simulated the data of positive Salmonella testing
at the slaughter house. Data of positive Salmonella at the slaughter house were obtained from “FSIS
Risk Assessment for Guiding, Public Health-Based Poultry, Slaughter Inspection”, USDA FSIS 2012
and 2008 reports [17].
     The PERT distribution (also called three-point estimation) was defined and selected for node
two as the appropriate distribution with minimum, most likely and maximum values of 2.2, 8.49 and
35.5, respectively, which were generated using Excel. Monte Carlo simulation with 1000 iterations
using minimum, most likely and maximum values was selected. The simulation generated the risk
for the second node.

2.1.3. Node Three: Retail
     Reviews of the scientific literature indicated that the incidence of Salmonella contamination of
broiler chickens is variable among studies because of differences in chicken production and
processing practices [13] as well as differences in sampling and detection methods. Several studies
had examined Salmonella outbreaks from retail sources [7,13,18,19]. Data of these studies were
collected and used to simulate and generate the risk of Salmonella contamination at the retail level. A
minimum value of 1.57, a median value of 30.57, and a maximum value of 77.14 of positive Salmonella
were calculated based on the collected data, and used to define the input settings for the PERT
distribution for the extent of Salmonella contamination of broiler chickens at the retail level. The data
were simulated and 1000 iterations were generated to determine the risk for the third node.

2.1.4. Node Four: Cooking and Mishandling
     The fourth node simulated thermal inactivation of Salmonella during cooking and cross-
contamination of cooked chickens with Salmonella during serving. Thermal inactivation of Salmonella
depends on a number of risk factors, such as time, temperature, product shape and size, strain of
Salmonella, methods of cooking, and physiological states of Salmonella. In this node, incidence refers
to the percentage of chickens that were mishandled by consumers, for example cutting of cooked
chicken with utensils used to prepare raw chicken.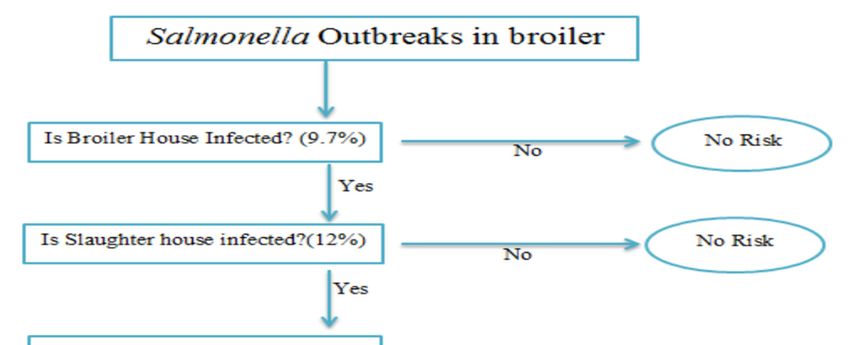
Diseases 2019, 7, 19                                                                                5 of 11

     A minimum value of 0.6, a median value of 14.57, and a maximum value of 41.7, obtained from
several literature articles of positive Salmonella [7,13,18–21], were used to define the input settings for
the PERT distribution for the extent of Salmonella contamination of broiler chickens for consumers.
The data were simulated and 1000 iterations were generated to determine the risk for the fourth node.
     Finally, all nodes were combined together to perform a concluding simulation of 10,000 iteration
using @RISK software to determine the overall risk of salmonella infection from all stages of farm-to-
fork pathway.
     Simulation models of the four nodes are shown in Figure 2.

      Figure 2. Simulation models for the four nodes of the Quantitative Risk Assessment Model (QRAM):
      broiler house, slaughter house, retail and consumers.

2.2. Consumption—Dose–Response Model
     Dose–response data for nontyphoid Salmonella in humans are limited to a large feeding trial with
healthy men [22]. Data from the study have been extensively modeled and indicate differences in
virulence among strains of Salmonella.
     Data for dose–response model were obtained from a study by Teunis [23], and The Food and
Agriculture Organization (FAO) dose–response model for Salmonella [24]. The concentration, number
of persons who are ill and number of exposed were obtained and used in Probit regression analysis.
Software package SPSS 21 was used to carry out the regression analysis using the number of ill as
response, total exposed as total observation and log dose mean as a covariate. Infectious
concentration 50 was calculated by finding the concentration at a probability of 50% illness, using
GraphPad software package.
Diseases 2019, 7, 19 6 of 11
3. Results
Detailed results of risk assessment model are summarized in Table 2.
Table 2. Results of risk assessment model for Salmonella in broiler chicken.
Risk-Broiler Risk-Slaughter
Name Risk-Retail Risk-Consumer Final Risk
House House
Description GammaRisk RiskPert RiskPert RiskPert RiskPert
Minimum 0.55332 2.332349 1.574895 1.342847 1.856516
Maximum 40.23986 30.64444 74.1679 39.25882 45.33582
Mean 9.796366 11.94164 33.51049 16.76949 19.92174
Standard
5.804362 5.724642 14.24967 7.593811 8.308862
Deviation
Variance 33.69061 32.77153 203.053 57.66596 69.03718
A QRAM was carried out, based on the understanding of production processes of broiler
chicken, to determine the risk of Salmonella infections from the farm-to-fork pathway. The QRAM
was modeled as a series of unit operations and associated pathogen events that included initial
contamination at the broiler house (node 1), contamination at the slaughter house (node 2),
contamination at the retail level (node 3), and cross-contamination during serving and cooking (node
4).
Node 1: data of Salmonella infections at the broiler house simulation using @RISK software
randomly assigned an output of risk for this node creating minimum, maximum, and mean values
of 0.55, 40.23, and 9.79, respectively.
Node 2: positive Salmonella rates at the slaughter house simulation was carried out and a random
risk output for this node was generated, which were 2.33, 30.64, and 11.94, for minimum, maximum
and mean values, respectively.
Node 3: Salmonella infection at the retail level, including data of transport, cross-contamination
at retail, and contamination related to packaging, was simulated and the random risk generated for
this node as a result of minimum, maximum and means values of 1.57, 74.16 and 33.5, respectively.
Node 4: data from literature review of Salmonella infection at the consumer level included
cooking to improper temperature, cross-contamination with raw chicken and improper hygiene
practices simulation random risk generated for this node as a result of minimum, maximum and
means values of 1.34, 39.26, and 16.76, respectively.
Collectively, the outputs of all nodes were combined for further risk simulation with 10,000
iterations. This resulted in random risk of 1.85, 45.33, and 19.92 for minimum, maximum and mean
values, corresponding to the best, worst and average scenario cases of Salmonella infections in broiler
chicken, respectively.
Results showed that infection at retail caused the highest risk of Salmonella with a mean of 33.5%.
Based on broiler production and consumption, from farm to fork, around 53 out of 100,000 broiler
chickens will be infected with Salmonella. Contaminated broiler chicken will cause an estimated 19
cases in 100,000 of Salmonella infections in human. Mississippi contributes to ten percent of broiler
chickens produced in the USA, resulting in 5 infected broiler chickens in 100,000 and causing 2 cases
in 100,000 of Salmonella infections in human.
Dose Response of Salmonella
Not all individuals in a population are equally susceptible to Salmonella infections. In order for
the human to be infected and show symptoms of salmonellosis, consumption of infectious dose of
Salmonella in broiler chicken is required.
Probit regression analysis was carried out to determine the Infectious dose-50 (ID-50) for the
most common serotypes of Salmonella resulting from broiler chicken consumption. Results showed
that the ID-50 values of Salmonella enterica serovar Enteritidis were 1.46 × 10⁴ (Figure 3), and 6.4 × 10³
for Salmonella enterica serovar Typhimurium (Figure 4). On an average, consumption of at least 1.46Diseases 2019, 7, 19 7 of 11
× 104 CFU/g for Salmonella enterica serovar Enteritidis or 6.4 × 10³ CFU/g for Salmonella enterica serovar
Typhimurium is required to develop infection in 50% of the population.
1.5
1.0
P(illness)
0.5
0.0
0 2 4 6 8 10
Log Dose
Figure 3. Dose–response graph for Salmonella enterica serovar Enteritidis.
Figure 4. Dose–response graph for Salmonella enterica serovar Typhimurium.
4. Discussion
Our QRAM of Salmonella infections from the farm-to-fork pathway determined the highest risk
of Salmonella infection at the retail level with a mean of 33.5%. The World Health Organization/ Food
and Agriculture Organization (WHO/FAO) published an international risk assessment on Salmonella
in broiler production. One of their key findings was that a reduction in the prevalence of Salmonella-
contaminated chicken was correlated with a reduction in the risk of human illness. For instance, a
50% reduction in the prevalence of contaminated poultry (20% to 10%) produced a 50% reduction in
the expected risk of illness per serving. Similarly, a large reduction in prevalence (20% to 0.05%)
would produce a 99.75% reduction in the expected risk of illness [25].
In the current study, positive Salmonella infections at the broiler house (node 1) were shown to
contribute around 10% of Salmonella risk. Newly hatched broilers are highly susceptible to Salmonella
colonization, likely due to the composition of their intestinal microbiota [26,27]. Over the last 50 years
in Southern USA, grow-out broilers in intensive production systems have been housed on deep litter
on the floor. In these economy-of-scale production systems, the birds are placed into grow-out houses
within a day after hatch, directly on litter. Therefore, if Salmonella is present in the litter, the birds are
exposed at a time when they are highly susceptible. In fact, the presence of Salmonella in the grow-
out house, specifically in the litter, prior to placement of a new flock and contamination of the
previous flock reared in the house, has shown to be precursors of higher Salmonella frequencies in the
new flock at later stages of the production continuum [26]. Salmonella may persist in dry livestockDiseases 2019, 7, 19 8 of 11
buildings for many months. A high standard of disinfection is necessary to avoid infection of poultry
placed in a previously infected house [27].
The risk assessment model showed that risk at the slaughter house is estimated to contribute
about 12% of Salmonella infections. Other studies also developed a QRAM of Salmonella from
slaughtered broiler flocks to consumers [20]. Their model estimated that approximately 0.21% of
domestically produced broiler meat mass was contaminated with Salmonella. They also suggested
that the effect of eliminating breeder flocks from production which have tested positive for Salmonella
and heat-treating the meat of detected positive broiler flocks would result in 1.0–2.5 less reported
human cases compared to the expected number of cases [20].
Further, the current risk assessment model showed that risk of Salmonella infections caused from
a retail source had the highest contribution of infections (33%). Furthermore, a study examined
Campylobacter and Salmonella in 300 raw samples (whole chicken, chicken breast with skin or chicken
pieces) that were purchased on a monthly basis for seven months. They reported that Campylobacter
and Salmonella were isolated from 68% and 29% of retail chicken, respectively. They found that
Salmonella was absent from external packaging but was isolated from 11% of whole packaging [28].
This study demonstrated that both chicken and chicken packaging are vehicles for potential cross-
contamination of Campylobacter and Salmonella. In addition, it was reported that broiler chickens at
production were contaminated at a rate of 2.49%, and increased during transportation to the
processing plants (3.95%), processing (51.32%) and retail (77.14%). It was suggested that the lower
infection rates during production may be due to voluntary control measures to reduce microbial
infection in the broiler population, which translates to an increase in profits. However, higher
Salmonella infection rates during processing and retail were due to cross-contamination from
processing procedures, and handling during these stages [18].
A risk reduction up to 17% was observed in the current risk assessment model for the consumer
node. Although the presence of Salmonella in poultry is relatively common, poultry can be safely
consumed when it is cooked at a safe internal endpoint temperature [29]. Reduction in concentration
of Salmonella on chicken at retail, and washing cutting boards (or utensils) and hands after handling
raw chicken and proper cooking at consumers’ homes can result in a marked reduction in the
predicted probability of illness. The cooking times required to reach a set endpoint temperature
differed considerably. Cooking times differed between individual poultry in the same class and
cooked in the same oven. Factors most likely contributing to the variability both between and within
individual poultry include differences in shapes, proportions of white and dark meat and fat
distribution. Furthermore, the position of the poultry in the cooking pans could have impacted the
rate of cooking in various regions of the poultry. The USDA recommended a cooking temperature of
74 °C for chicken. A study found that an endpoint temperature of 74 °C, with a hold time of less than
10 min for both chicken and turkey, could achieve a 7-log reduction of Salmonella [29]. Another study
by Oscar found that incidence of Salmonella contamination was 30% at retail and it changed to 0.16%
after cooking and then to 4% at consumption. Their model predicted 0.44 cases of salmonellosis per
100,000 consumers, which was consistent with recent epidemiological data that indicate a rate of 0.66–
0.88 cases of salmonellosis per 100,000 consumers of chicken [13].
Salmonella rates have significantly declined in farms due to technological advances and
improved preventive strategies in addition to hygiene and control measures at various production
levels. Some of these preventive strategies include feed and drinking water acidification with organic
acids, modification of nutrients and ingredients of bird feed to reduce their susceptibility to Salmonella
infections. Additionally, use of feed additives, such as antibiotics, prebiotics, probiotics, and
synbiotics, modifies the intestinal microflora, but may not be the best control measure of infections
[30].
As a result, this risk assessment model can be used as a tool to organize management control
programs to enhance awareness of the critical points, where Salmonella can be controlled the most by
the food handlers at retail and private kitchens. Training and educational programs to enhance such
practices should be encouraged. The outcome of the current model emphasizes that food safety is notDiseases 2019, 7, 19 9 of 11
one party’s responsibility; rather, it is a shared responsibility among all stakeholders in charge of
handling the broiler chicken.
Not every exposure to a pathogen in food will result in infection or illness in humans, and not
all individuals in a given population are equally susceptible to all pathogens. Therefore, the risk of
food borne disease is a combination of the likelihood of exposure to a pathogen in a food, the
likelihood that exposure will result in infection or intoxication and subsequently illness and the
severity of the illness. On a population basis, a calculation of risk can predict the expected number of
specific illnesses or deaths per 100,000 population per year attributable to the pathogen/food in
question, or risk can be defined as the probability of a specific adverse outcome per exposure to the
food [31]. The susceptibility of a person plays a major role in acquiring Salmonella infection. The
calculated risk of infection is higher and more potent for children under 5 years old, infants who are
not breastfed, adults over 65 years old, and people with weakened immune systems as they are most
likely to have severe infections. In addition, certain medications, such as treatment of hyperacidity in
stomach, can increase the risk of Salmonella infection as well [1].
Dose Response of Salmonella
In this study, a Probit regression analysis was constructed to determine the Infectious dose-50
(ID-50) for Salmonella enterica serovar Enteritidis and Salmonella enterica serovar Typhimurium.
Results of this analysis showed that in Salmonella enterica serovar Enteritidis, ID-50 values were 1.46
× 104 and 6.4 × 10³ for Salmonella enterica serovar Typhimurium, respectively. Our results were
consistent with results of other studies that determined the dose response for salmonellosis in broiler
chicken [13,24,28].
Other studies created separate dose–response models for infection and illness given infection
using a multi-level statistical framework [23]. Those models incorporated serotype and susceptibility
as categorical covariates, and adjusted for heterogeneity in exposure. Their results indicated that both
the risk of infection and the risk of illness given infection increase with dose. The dose–response
model incorporating data from all outbreaks had an infection ID-50 of 7 CFUs’ and illness ID-50 of
36 CFUs. However, for serotypes other than Salmonella enterica serovar Enteritidis and Salmonella
enterica serovar Typhimurium, literature indicated that a minor proportion of individuals exposed
will not fall ill even at high doses. The dose–response relations indicate that outbreaks are associated
with higher doses making it more likely to have a higher attack rate. In healthy humans, the infectious
dose is generally 106 to 108, but lower bacterial counts can cause disease in certain conditions, as well
as in infants and the elderly. Although uncommon, life-threatening invasive infections with
bacteremia (5%–10% of infected persons) and/or other extra-intestinal infections may occur, affecting
especially the risk groups (infants, young children, older people and immunocompromised patients)
[9]. The dose–response model based upon the observed outbreak data provides an estimate for the
probability of illness that is based on real-world data. The outbreak model offers the best alternative
for estimating the probability of illness upon ingestion of a dose of Salmonella.
Minimizing the risk of disease transmission is a major concern for governments and health
professional organizations. Understanding the contributing source to the risk of disease will allow
prevention and control measures to eliminate the disease.
5. Conclusions
This Salmonella risk assessment provides information that should be useful in determining the
impact intervention strategies may have on reducing cases of salmonellosis from contaminated
broiler. Risk assessment, along with risk management and risk communication, is one of the
components of risk analysis, which can be defined as an overall strategy for addressing risk. In this
study, a farm-to-fork risk assessment determined that the highest rates of infections are from the
retail level. However, proper hygiene and safe handling and cooking practices will reduce the rates
of infections. The QRAM model that predict the risk of Salmonella infections could be used as a
guiding tool to manage the disease control programs.Diseases 2019, 7, 19 10 of 11
Author Contributions: Conceptualization, L.A.; formal analysis, L.A. and H.A.A.; funding acquisition, H.A.A.;
methodology, L.A. and H.A.A.; supervision, H.A.A.; writing of the original draft, L.A.; writing of review and
editing, L.A. and H.A.A.
Funding: This research was funded by the National Institute on Minority Health and Health Disparities of the
National Institutes of Health under Award Number G12MD007581. The content is solely the responsibility of
the authors and does not represent the official views of the National Institutes of Health.
Conflicts of Interest: The authors declare no conflicts of interest
References
1. Centers for Disease Control and Prevention (CDC); Foodborne Illnesses and Germs. Available online:
https://www.cdc.gov/foodsafety/foodborne-germs.html. (accessed on 30 October, 2018).
2. Scallan, E.; Hoekstra, R.M.; Angulo, F.J.; Tauxe, R.V.; Widdowson, M.A.; Roy, S.L.; Jones, J.L.; Griffin, P.M.
Foodborne illness acquired in the United States--major pathogens. Emerg. Infect. Dis. 2011, 17, 7–15.
3. Brichta-Harhay, D.M.; Arthur, T..M; Bosilevac, J.M.; Kalchayanand, N.; Shackelford, S.D.; Wheeler, T.L.;
Koohmaraie, M. Diversity of Multidrug-Resistant Salmonella enterica Strains Associated with Cattle at
Harvest in the United States. Appl Environ. Microbiol. 2011, 77, 1783–1796.
4. Akil, L.; Ahmad, H.A.; Reddy, R.S. Effects of climate change on Salmonella infections. Foodborne Pathog.
Dis. 2014, 11, 974–980.
5. Akil, L.; Ahmad, H.A. Salmonella infections modelling in Mississippi using neural network and
geographical information system (GIS). BMJ Open 2016, 6, e009255, doi:10.1136/bmjopen-2015-009255.
6. Rajan, K.; Shi, Z.; Ricke, S.C. Current aspects of Salmonella contamination in the US poultry production
chain and the potential application of risk strategies in understanding emerging hazards. Crit. Rev.
Microbiol. 2017, 43, 370–392.
7. Smadi, H.; Sargeant, J.M. Quantitative risk assessment of human salmonellosis in Canadian broiler chicken
breast from retail to consumption. Risk Analysis 2013, 33, 232–248.
8. Chai, S.J.; Cole, D.; Nisler, A.; Mahon, B.E. Poultry: The most common food in outbreaks with known
pathogens, United States, 1998-2012. J. Epidemiol. Infect. 2017, 145, 316–325,
doi:https://doi.org/10.1017/S0950268816002375.
9. Antunes, P.; Mourão, J.; Campos, J.; Peixe, L. Salmonellosis: The role of poultry meat. Clin. Microbiol. Infec.
2016, 22, 110–121.
10. Mead, P.S.; Slutsker, L.; Dietz, V.; McCaig, L.F.; Bresee, J.S.; Shapiro, C.; Griffin, P.M.; Tauxe, R.V. Food-
related illness and death in the United States. Emerg. Infect. Dis. 1999, 5, 607–625.
11. Maki, Dennis, G. Coming to Grips with Foodborne Infection — Peanut Butter, Peppers, and Nationwide
Salmonella Outbreaks. N engl J. Med. 2009, 360, 949–953.
12. Smid, J.H.; Verloo, D.; Barker, G.C.; Havelaar, A. Strengths and weaknesses of Monte Carlo simulation
models and Bayesian belief networks in microbial risk assessment. Int. J. Food Microbiol. 2010, 139, S57–S63.
13. Oscar T.P. A quantitative risk assessment model for Salmonella and whole chickens. Int J. Food Microbiol
2004, 93, 231–247.
14. Qin, L.; Yang, S.X.; Meng, M.Q.H. Mathematical Model with Degree of Risk for Salmonella Infections. In
Systems, Man and Cybernetics. ISIC. IEEE International Conference on. IEEE, Montreal, Que., Canada, 7–10
Oct. 2007; 2007, pp. 2704–2709.
15. Sharma, C.S.; Ates, A.; Joseph, P.; Nannapaneni, R.; kiss, A. Reduction of Salmonella in skinless chicken
breast fillets by lauric arginate surface application. Poult. Sci. 2013, 92, 1419–1424.
16. U.S. Department of Agriculture. Progress Report on Salmonella and Campylobacter Testing of Raw Meat
and Poultry Products, 1998–2011, 2012. Available online: https://www.data.gov/ (accessed on 06 February
2019).
17. U.S. Department of Agriculture. FSIS Risk Assessment for Guiding Public Health-Based Poultry Slaughter
Inspection, 2012. Available online: https://www.data.gov/ (accessed on 06 February 2019).
18. Dookeran, M.M.; Baccus-Taylor, G.S.; Akingbala, J.O.; Tameru, B.; Lammerding, A.M. Assessing thermal
inactivation of salmonella on cooked broiler chicken carcasses in Trinidad and Tobago. Open Conf. Proc. J.
2012, 3, 12–19.
19. Alali, W.Q.; Thakur, S.; Berghaus, R.D.; Martin, M.P.; Gebreyes, W.A. Prevalence and distribution of
Salmonella in organic and conventional broiler poultry farms. Foodborne Pathog. Dis. 2010, 7, 1363–1371.Diseases 2019, 7, 19 11 of 11
20. Maijala, R.T.; Ranta, J.; Seuna, E.; Pelkonen, E.; Johansson, T. A Quantitative Risk Assessment of the Public
Health Impact of the Finnish Salmonella Control Program for Broilers. Int. J. Food Microbiol. 2005, 102, 21–
35.
21. World Health Organization & Food and Agriculture Organization of the United Nations. Risk assessments
of Salmonella in eggs and broiler chickens; World Health Organization & Food and Agriculture
Organization of the United Nations: Geneva, Switzerland, 2002; pp. 177–181.
22. McCullough, N.B.; Eisele, C.W. Experimental human salmonellosis. 1. Pathogenicity of strains of
Salmonella meleagridis and Salmonella anatum obtained from spray-dried whole egg. J. Infect. Dis. 1951,
88, 278–289.
23. Peter, F.M.T.; Fumiko K.; Aamir F.; Iain, D.O.; Ovidiu R.; Norval, J.C.S. Dose–response modeling of
Salmonella using outbreak data. Int. J. Food Microbiol. 2010, 144, 243–249.
24. Food and Agriculture Organization of the United Nations Statistics Division. Available online:
www.faostat.fao.org (accessed on 15 October 2018).
25. RISK, A. Joint FAO/WHO Expert Consultation on Risk Assessment of Microbiological Hazards in Foods.
Available online: http://citeseerx.ist.psu.edu/viewdoc/download?doi=10.1.1.110.5983&rep=rep1&type=pdf
(accessed on 1 February 2019).
26. Volkova, V.V.; Bailey, R.H.; Wills, R.W. Salmonella in Broiler Litter and Properties of Soil at Farm Location.
PLOS ONE 2009, 7, e6403.
27. Wray, C.; Davies R.H.; Evans, S.J. Salmonella infection in poultry: The production environment. In Poultry
Meat Science, Poultry Science Symposium Series Volume Twenty-Five; CABI Publishing: Wallingford, Oxford,
UK, 1999; pp. 257–275.
28. Harrison, W.A.; Griffith, C.J.; Tennant, D.; Peters, A.C. Incidence of Campylobacter and Salmonella isolated
from retail chicken and associated packaging in South Wales. Letters in applied microbiology. Lett. Appl.
Microbiol. 2001, 33, 450–454.
29. Gosia, K.K.; Hélène, C.; Thomas, G.; Kim, H.; Paulett, M.; Thuy, P.; Jeffrey, M.F. Safe Endpoint Temperature
for Cooking Whole Raw Poultry: Health Canada Recommendation. Food Protection Trends 2010, 30, 580–
587.
30. Vandeplas, S.; Dauphin, R.D.; Beckers, Y.; Thonart, P.; Thewis, A. Salmonella in chicken: Current and
developing strategies to reduce contamination at farm level. J. Food Protect. 2010, 73, 774–785.
31. Lammerdinga, A.M.; Aamir F. Hazard identification and exposure assessment for microbial food safety
risk assessment. Int. J. Food Microbiol. 2000, 58, 147–157.
© 2019 by the authors. Licensee MDPI, Basel, Switzerland. This article is an open access
article distributed under the terms and conditions of the Creative Commons
Attribution (CC BY) license (http://creativecommons.org/licenses/by/4.0/).You can also read