MIDDLE EAST & NORTH AFRICA
INVESTMENT OPPORTUNITIES
IN FOOD & DRINK:
RISK/REWARD ANALYSIS
←
→
Page content transcription
If your browser does not render page correctly, please read the page content below

MIDDLE EAST & NORTH AFRICA INVESTMENT OPPORTUNITIES IN FOOD & DRINK: RISK/REWARD ANALYSIS
MENA Investment Opportunities In
Food & Drink: Risk/Reward Analysis

Published by: BMI Research

 BMI Research                                                                  © 2018 Business Monitor International Ltd
 30 North Colonnade,                                                           All rights reserved.
 London
 E14 5GN, UK                                                                   All information contained in this publication is
 Tel: +44 (0)207 248 0468                                                      copyrighted in the name of Business Monitor
 Fax: +44 (0)20 7248 0467                                                      International Ltd, and as such no part of this
 Email: subs@bmiresearch.com                                                   publication may be reproduced, repackaged,
 Web: http://www. bmiresearch.com                                              redistributed, resold in whole or in any part, or used in
                                                                               any form or by any means graphic, electronic or
                                                                               mechanical, including photocopying, recording, taping,
                                                                               or by information storage or retrieval, or by any other
                                                                               means, without the express written consent of the
                                                                               publisher.

 DISCLAIMER
 All information contained in this publication has been researched and compiled from sources believed to be accurate and reliable at the time of
 publishing. However, in view of the natural scope for human and/or mechanical error, either at source or during production, Business Monitor
 International Ltd accepts no liability whatsoever for any loss or damage resulting from errors, inaccuracies or omissions affecting any part of the
 publication. All information is provided without warranty, and Business Monitor International Ltd makes no representation of warranty of any
 kind as to the accuracy or completeness of any information hereto contained.
MENA Investment Opportunities in Food & Drink: Risk/Reward Analysis
CONTENTS
MENA Food & Non-Alcoholic Drinks: Sin Tax Won't Impede Top Ranked UAE ....................................... 3
Sin Tax: Not A Major Threat To Consumption ........................................................................................................................................................... 4
UAE Still An Outperformer ......................................................................................................................................................................................... 6
Morocco Outperforms North Africa And Two GCC Markets ...................................................................................................................................... 7
Saudi Arabia - Q1 2018 .................................................................................................................................. 12
Egypt - Q1 2018 .............................................................................................................................................. 14
Iran - Q1 2018 ................................................................................................................................................. 16
United Arab Emirates - Q1 2018 ................................................................................................................... 17
Methodology .................................................................................................................................................. 19
Food & Drink (Non-Alcoholic Drinks) Risk/Reward Index ....................................................................................................................................... 20
Food & Drink (Alcoholic Drinks) Risk/Reward Index, Indicators ....................................................................................................................... 23
Food & Drink (Alcoholic Drinks) Risk/Reward Index............................................................................................................................................... 24
Food & Drink (Alcoholic Drinks) Risk/Reward Index, Indicators ....................................................................................................................... 27
© Business Monitor International Ltd Page 2MENA Investment Opportunities in Food & Drink: Risk/Reward Analysis
MENA Food & Non-Alcoholic Drinks: Sin Tax Won't
Impede Top Ranked UAE
BMI View: MENA ranks fourth out of six regions globally in our Food and Non-Alcoholic Drinks
Risk/Reward Index. The Middle Eastern sub-region remains the outperformer, occupying the top five
MENA spots. We highlight Morocco as a North Africa bright spot, placing in sixth position in the region
and first in North Africa, outperforming two of the GCC markets.
Middle East Remains Top Pick To North Africa
MENA - Food & Non-Alcoholic Drinks Risk/Reward Heat Map
Note: Scores out of 100; higher score= more attractive market. Source: BMI
Important Note: Our entire Food & Drink Risk/Reward Index (RRI) includes two Food & Drink
Risk/Reward indices: our Food & Non-Alcoholic Drinks RRI and our Alcoholic Drinks RRI. The first
quantifies the risks and rewards associated with food and non-alcoholic drink sales in each country, while
the other quantifies the risks and rewards associated with the alcoholic drinks sector.
Main Regional Features And Latest Updates
The Middle East and North Africa (MENA) region is ranked fourth in BMI's Food & Non-
Alcoholic Drinks RRI. The regional average RRI score is 47.0, compared to the global average
of 50.0.
The UAE remains the most attractive market in the region for food and non-alcoholic drinks in
MENA and is the region's only country to score within the global top 10.
Our top five countries in our MENA RRI score above the global average of 50.0.
Morocco slips out of the top five, ranking sixth. Its sixth position is worth highlighting, as it far
exceeds it North African regional peers as well as two Gulf Cooperation Council (GCC)
markets.
© Business Monitor International Ltd Page 3MENA Investment Opportunities in Food & Drink: Risk/Reward Analysis
Strong Rewards Balanced With Risks
MENA - Food & Non-Alcoholic Drinks Risk/Reward Index
Note: Scores out of 100; higher score = more attractive market. Source: BMI
Sin Tax: Not A Major Threat To Consumption
The UAE has introduced excise tariffs at a rate of 100% on tobacco and energy drinks, and 50% on
sugary drinks, with the law coming into effect on October 1 2017. Following in the footsteps of Saudi
Arabia, which implemented a similar levy in June 2017, the move towards so-called 'sin taxes' by GCC
states aims to discourage consumption of unhealthy products, while also providing a welcome boost to
fiscal revenues amid the low oil price environment.
© Business Monitor International Ltd Page 4MENA Investment Opportunities in Food & Drink: Risk/Reward Analysis
Affluent Consumer Able To Absorb Added Cost
UAE - Household Disposable Income Breakdown
f = BMI forecast. Source: BMI, UAE National Bureau of Statistics
In terms of sales and consumption of carbonates, we believe the overall impact of the excise duty in the
UAE will be limited. We have only slightly adjusted our forecasts for consumption of carbonated drinks
in response to the tax, with the five-year (2017-2021) compound annual growth rate (CAGR) projected to
be 4.9%, compared to 5.2% CAGR previously.
Below we outline the key factors behind this modest revision:
We were already forecasting slower growth in carbonates relative to other soft drinks categories,
such as mineral water and fruit and vegetable juices, as we were already anticipating health
consciousness trends to prevail in consumption patterns.
The tax will have minimal impact on our carbonates forecasts for 2017 given that it does not
come into effect until Q417. We forecast 5.1% y-o-y growth in 2017, down from 5.35% y-o-y
previously. We expect to see a more marked slowdown in growth in 2018, with sales growth
slowing by one percentage point to 4.7% y-o-y.
The majority of consumers in the UAE are high earners, with our forecasts showing over three
quarters of the population having disposable incomes of USD25,000-plus in 2017, and 44% with
a disposable income of USD50,000-plus. Given that retail prices of carbonated drinks in the
UAE range between AED1.5 (USD0.40) and AED3 (USD0.80), this level of disposable income
is more than sufficient to absorb a 50% to 100% price increase.
© Business Monitor International Ltd Page 5MENA Investment Opportunities in Food & Drink: Risk/Reward Analysis
The regressive nature of the tax means lower-income consumers will be hardest hit, particularly
as these consumers tend to purchase carbonated drinks on a frequent basis, often due to a lack of
awareness of health concerns such as obesity.
Energy drinks such as Red Bull are most exposed. We expect consumers to switch to other
beverages for sources of caffeine, such as coffee or carbonates - which have a lower price point
to begin with and are subject to a 50% rather than 100% tax rate.
UAE Still An Outperformer
The UAE is the MENA region's outperformer in our Food & Non-Alcoholic Drinks RRI, with the country
obtaining a score of 74.0 out of 100. This score places the country in the top 10 globally, finishing in third
position. The UAE is, however, the only MENA state to place within the global top 10, with the region's
second-placed state, Saudi Arabia, trailing the UAE by some distance with a score of 61.7, which equates
to 29th place out of 107 states measured worldwide in our RRI.
The UAE's top regional position is earned through high scores for both industry rewards and industry
risks, scoring highly for per capita food and drink spending. While the country and the population might
be relatively small and so the volume of food and drink consumption is lower, the comparative wealth of
the population ensures high spending levels on food and drink. The country also offers growth potential
for the sector, with the household spending real growth outlook over the next five years (2017-2021)
projected by BMI to average an annual increase of 4.1%. The UAE's strong food and drink spending
growth outlook ensures the country's industry reward score of 79.6, which is the highest industry reward
score in the region.
© Business Monitor International Ltd Page 6MENA Investment Opportunities in Food & Drink: Risk/Reward Analysis
UAE Top Market
UAE And MENA RRI Breakdown
Note: Scores out of 100, higher score = more attractive market. Source: BMI
From an industry risks perspective, the UAE benefits from its position as a regional business and logistics
hub. This has meant that the country has developed a robust regulatory framework for international
companies to operate in and a strong infrastructure network, with its airports and ports functioning as
transhipment points, offering companies plenty of supply chain options at competitive rates. The
country's industry risk score of 79.9 is also a high score for the country by comparison to the region.
Morocco Outperforms North Africa And Two GCC Markets
Morocco stands out in our MENA Food and Non-Alcoholic Drinks RRI owing to it high score for North
Africa of 50.5. This places Morocco in sixth place out of 14 MENA markets, far higher than other North
African peers. Morocco ranks first in the sub-region (North Africa) and we also highlight that the country
outperforms two of the GCC countries - Bahrain and Oman. Bahrain scores 44.2 and Oman scores 45.5,
ranking ninth and eighth respectively.
© Business Monitor International Ltd Page 7MENA Investment Opportunities in Food & Drink: Risk/Reward Analysis
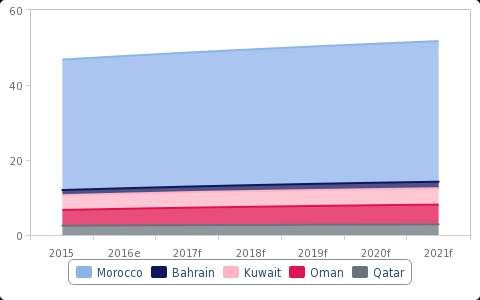
Morocco Offers Large Consumer Base
Selected Countries - Population (mn)
f = BMI forecast. Source: National sources, BMI
Morocco benefits from a large population of over 35mn and an urban population of close to 60%, leading
to a rewards score of 52.8. Although Bahrain and Oman have high urbanisation rates of nearly 90% and
80% respectively, they each are home to a consumer base of less than 5mn. However, we caution that
Morocco's risks scores reflect the key downside risks to operating in a North African market. Its risks
score of 44.9 is below the two aforementioned GCC countries, due to higher logistics risks and much
weaker retail formalisation.
© Business Monitor International Ltd Page 8MENA Investment Opportunities in Food & Drink: Risk/Reward Analysis
MENA Food & Non-Alcoholic Drinks Risk/ Reward Index
Rewards & Risks Scores
Note: Scores out of 100, higher score = more attractive market. Source: BMI
© Business Monitor International Ltd Page 9MENA Investment Opportunities in Food & Drink: Risk/Reward Analysis
MENA Food & Non-Alcoholic Drinks Rewards
Industry Rewards & Country Rewards Scores
Note: Scores out of 100, higher score = more attractive market. Source: BMI
© Business Monitor International Ltd Page 10MENA Investment Opportunities in Food & Drink: Risk/Reward Analysis
MENA Food & Non-Alcoholic Drinks Risks
Industry Risks & Country Risks Scores
Note: Scores out of 100, higher score= more attractive market. Source: BMI
Please Note: Our Risk/Reward Indices are updated frequently and, as a result, scores in this section may
not match scores in the rest of the report.
© Business Monitor International Ltd Page 11MENA Investment Opportunities in Food & Drink: Risk/Reward Analysis
Saudi Arabia - Q1 2018
BMI View: Saudi Arabia's food and drink sector faces a number of challenges which will dampen
growth prospects for investors over the short term. Anaemic economic growth, combined with new
regulations such as the selective tax on sugary drinks and tobacco and restrictions on non-Saudi
employees in the grocery retail sector, raise the risks for companies operating in the market. We maintain
a more optimistic outlook over the back end of our 2017-2021 forecast period as the economy picks up in
line with oil prices, with Saudi Arabia offering one of the largest and most youthful consumer bases in the
MENA region.
Food And Drink Spending
(2014-2021)
e/f = BMI estimate/forecast. Source: BMI, national statistics
Latest Updates And Industry Developments
The Saudi Arabian economy will fall into recession in 2017 before returning to modest growth in
2018. With our expectations for oil sector growth to remain in negative territory in the second
half of 2017, and for the government's paring back of fiscal consolidation measures to only
slowly feed through to stronger consumer spending, we are now forecasting a recession of 0.5%
in 2017, before gradually picking up to 1.3% in 2018.
Saudi Arabia's Ministry of Labour and Social Development has confirmed plans to ban foreign
workers from jobs in grocery stores by 2020. The move is part of the kingdom's wider
'Saudisation' agenda which aims to reduce unemployment among Saudi nationals. We believe
© Business Monitor International Ltd Page 12MENA Investment Opportunities in Food & Drink: Risk/Reward Analysis
this poses a downside risk to investment by grocery retailers as it will increase operating costs
and drive up wage pressures.
Soft drink companies operating in Saudi Arabia are lowering prices and rolling out smaller can
sizes in an effort to mitigate against weaker demand following the introduction of 100%
selective tax on sugary and energy drinks in June 2017.
As part of Vision 2030 and the Kingdom's wider economic diversification efforts, Saudi Arabia's
food processing sector will continue to attract considerable investment, particularly in key
segments such as dairy and halal.
Looking beyond the short-term economic slowdown, premiumisation and rising health
awareness will fuel dynamism in Saudi Arabia's food and drink market over our five-year
forecast period, as consumers increasingly adopt Western-influenced consumption patterns.
© Business Monitor International Ltd Page 13MENA Investment Opportunities in Food & Drink: Risk/Reward Analysis
Egypt - Q1 2018
BMI View: While high inflation remains a major issue for Egypt's food and drink industry, we expect the
pressures on consumer purchasing power and profit margins to gradually ease from 2018 onwards.
However, prices of imported products will remain elevated over the near term, and the majority of
consumers will prioritise the purchasing of staple food and drink items, while switching to discounters,
private labels and local produce wherever possible.
Food And Drink Spending
2014-2021
e/f = BMI estimate/forecast. Source: BMI, national statistics
Latest Updates And Industry Developments
Surging prices have hurt the food sector as Egyptians choose to downgrade to cheaper
alternatives or go without discretionary products.
In US dollar terms, BMI forecasts a 26% contraction in headline food sales over 2017. However,
a recovery is expected in 2018, following sharp devaluation in the Egyptian currency.
Egypt's rising interest rates and soaring inflation have hit second quarter profits at the country's
largest food companies, providing evidence that consumers' purchasing power is being squeezed.
Knockmart Food Industries and Jumia Egypt announced in a joint statement in November 2017
that they have entered into a strategic partnership to launch online grocery platform Jumia Fresh.
© Business Monitor International Ltd Page 14MENA Investment Opportunities in Food & Drink: Risk/Reward Analysis
Because of their early-mover advantage and Jumia's expertise in e-commerce in Egypt, we
believe the new platform will become a major force in the country's nascent online grocery
market.
Edita Food Industries launched a new product, Todo Donuts, in October 2017, further
consolidating its position as the leader in Egypt's packaged snack food market. This follows the
opening of a new production facility in July 2017. The company now has five facilities in Egypt,
encompassing 28 production lines and a nationwide distribution network. The firm's customer
base includes more than 67,000 wholesale and retail customers, while it exports to more than 16
markets in the region.
© Business Monitor International Ltd Page 15MENA Investment Opportunities in Food & Drink: Risk/Reward Analysis
Iran - Q1 2018
BMI View: Rising urbanisation and a large youth population will bolster Iran's consumer market. Over
our forecast period to 2021, we expect Iran to present increasingly attractive opportunities for food and
drink companies, further supported by rising income levels.
Food And Drink Spending
(2014-2021)
e/f = BMI estimate/forecast. Source: BMI, national statistics
Latest Updates And Industry Developments
Although we expect diversification in consumer tastes and preferences, spending on staple foods
such as rice and bread will still form an important part of local diets and remain dominant.
We forecast strong growth for Iran's non-alcoholic drinks sector, growing at a compound annual
growth rate of 12.2% over 2017-2021, in local currency terms.
Iran's food retail market is dominated by small independent retailers and open air markets.
Organised food retail accounts only for around 10% of the total sales, a figure which we expect
to increase gradually over the next five years. Considering their local knowledge, regional
companies hold a distinct advantage entering Iran's highly prospective mass grocery retail
market, while other investments are likely to come in a form of joint ventures with local
partners.
© Business Monitor International Ltd Page 16MENA Investment Opportunities in Food & Drink: Risk/Reward Analysis
United Arab Emirates - Q1 2018
BMI View: In line with consumer spending more broadly, our outlook for the UAE food and drink
market remains positive over our 2017-2021 forecast period. Ongoing rises in disposable incomes
combined with increasing adoption of Westernised consumption patterns will drive industry growth,
particularly for premium food and drink products. While we note downside risks posed by regulatory
changes such as the imposition of a tax on tobacco and sugary drinks in late 2017, and VAT in 2018, we
believe the overall impact will be limited due to the affluence of the consumer base and relatively low
retail prices to begin with.
Food And Drink Spending
(2014-2021)
e/f = BMI estimate/forecast. Source: BMI, National statistics
Latest Updates And Industry Developments
Health consciousness trends are starting to prevail in the consumption patterns, with slower
growth in carbonated soft drinks.
Fast-evolving e-commerce sector will present new growth opportunities for retailers to penetrate
the market.
The UAE will introduce excise tariffs at a rate of 100% on tobacco and energy drinks and 50%
on sugary drinks from October 2017. The UAE will be the second country in the Arabian Gulf to
© Business Monitor International Ltd Page 17MENA Investment Opportunities in Food & Drink: Risk/Reward Analysis
introduce excise taxes after Saudi Arabia began implementing the tax at the same rate in June
2017.
In terms of sales and consumption of carbonates, we believe the overall impact of the excise duty
in the UAE will be limited. We have only slightly adjusted our forecasts for consumption of
carbonated drinks in response to the tax, with the five-year compound annual growth rate
(CAGR) projected to be 5.0%, compared to 5.2% CAGR previously.
India's Hielo Beverages, maker of premium healthy soft drinks, will enter the UAE market at the
end of 2017 under its flagship brand name PEAUR. The initial roll out will see the company
promoting their PEAUR Natural Mineral Water sourced in the Himalayas and PEAUR nectar
based fruit juices. Initially the company has tied up with exclusive retail outlets in Dubai, but
plans to expand more widely.
Majid Al Futtaim, which owns the franchise rights for Carrefour in MENA, acquired Retail
Arabia in July 2017, the franchise owner of Geant hypermarkets in UAE, Bahrain and Kuwait,
and will rebrand its 29 stores under the Carrefour brand before the end of 2017.
© Business Monitor International Ltd Page 18MENA Investment Opportunities in Food & Drink: Risk/Reward Analysis
Methodology
BMI Food & Drink Forecasting & Sourcing
How We Generate Our Industry Forecasts
BMI's industry forecasts are generated using the best-practice techniques of time-series modelling and
causal/econometric modelling. The precise form of model we use varies from industry to industry, in each
case being determined, as per standard practice, by the prevailing features of the industry data being
examined. BMI mainly uses OLS estimators and in order to avoid relying on subjective views and
encourage the use of objective views, BMI uses a 'general-to-specific' method. BMI mainly uses a linear
model, but simple non-linear models, such as the log-linear model, are used when necessary. During
periods of 'industry shock', for example a deep industry recession, dummy variables are used to determine
the level of impact.
Effective forecasting depends on appropriately-selected regression models. BMI selects the best model
according to various different criteria and tests, including, but not exclusive to:
R2 tests explanatory power; Adjusted R2 takes degree of freedom into account
Testing the directional movement and magnitude of coefficients
Hypothesis testing to ensure co-efficients are significant (normally t-test and/or P-value)
All results are assessed to alleviate issues related to auto-correlation and multi-co-linearity
BMI uses the selected best model to perform forecasting.
It must be remembered that human intervention plays a necessary and desirable role in all of BMI's
industry forecasting. Experience, expertise and knowledge of industry data and trends ensures that
analysts spot structural breaks, anomalous data, turning points and seasonal features where a purely
mechanical forecasting process would not.
Within the Food & Drink industry, this intervention might include, but is not exclusive to: significant
company expansion plans; new product development that might influence pricing levels; dramatic
changes in local production levels; product taxation; the regulatory environment and specific areas of
legislation; changes in lifestyles and general societal trends; the formation of bilateral and multilateral
trading agreements and negotiations; political factors influencing trade; and the development of the
industry in neighbouring markets that are potential competitors for foreign direct investment.
© Business Monitor International Ltd Page 19MENA Investment Opportunities in Food & Drink: Risk/Reward Analysis
Example of Food Consumption Model:
(Food Consumption)t = β0 + β1*(GDP)t + β2*(Inflation)t + β3*(Lending Rate)t + β4* (Foreign
Exchange Rate)t + β5*(Government Expenditure)t + β6*(Food Consumption)t-1 + εt
Sourcing
BMI uses the following sources in the compilation of data, developments and analysis for its range of
Food & Drink reports: national statistics offices; local industry governing-bodies and associations; local
trade associations; central banks; government departments, particularly trade, agricultural and commerce
ministries; officially-released information and financial results from local and multinational companies;
cross-referenced information from local and international news agencies and trade press outlets; figures
from global organisations, such as the World Trade Organization (WTO), the World Health Organization
(WHO), the United Nations Food and Agricultural Organization (FAO) and the Organisation for
Economic Co-operation and Development (OECD).
Food & Drink (Non-Alcoholic Drinks) Risk/Reward Index
Our Food & Drink (Non-Alcoholic Drinks) Risk/Reward Index (RRI) quantifies and ranks a country's
attractiveness within the context of the Food & Drink (Non-Alcoholic Drinks) industry, based on the
balance between the Risks and Rewards of entering and operating in different countries.
We combine industry-specific characteristics with broader economic, political and operational market
characteristics. We weight these inputs in terms of their importance to investor decision making in a given
industry. The result is a nuanced and accurate reflection of the realities facing investors in terms of:
1) the balance between opportunities and risk; and
2) between sector-specific and broader market traits.
This enables users of the index to assess a market's attractiveness in a regional and global context.
The index uses a combination of our proprietary forecasts and analyst assessments of the regulatory
climate. As regulations evolve and forecasts change, so the index scores change providing a highly
dynamic and forward-looking result.
The Food & Drink (Non-Alcoholic Drinks) Risk/Reward Index universe comprises 107 countries.
© Business Monitor International Ltd Page 20MENA Investment Opportunities in Food & Drink: Risk/Reward Analysis
Benefits of using BMI's Food & Drink (Non-Alcoholic Drinks) RRI
Global Rankings: One global table, ranking all the countries in BMI's universe for Food & Drink
(Non-Alcoholic Drinks) from least (closest to zero) to most attractive (closest to 100).
Accessibility: Easily accessible, top down view of the global, regional or sub-regional
Risk/Reward profiles.
Comparability: Identical methodology across 107 countries for Food & Drink (Non-Alcoholic
Drinks) allows users to build lists of countries they wish to compare, beyond the confines of a
global or regional grouping.
Scoring: Scores out of 100 with a wide distribution, provide nuanced investment comparisons.
The higher the score, the more favourable the country profile.
Quantifiable: Quantifies the rewards and risks of doing business in the Food & Drink (Non-
Alcoholic Drinks) sector in different countries around the world and helps identify specific
flashpoints in the overall business environment.
Comprehensive: Comprehensive set of indicators, assessing industry-specific risks and rewards
alongside political, economic and operating risks.
Entry Point: A starting point to assess the outlook for the Food & Drink (Non-Alcoholic Drinks)
sector, from which users can dive into more granular forecasts and analyses to gain a deeper
understanding of the market.
Balanced: Multi-indicator structure prevents outliers and extremes from distorting final scores
and rankings.
Methodology is a combination of proprietary BMI forecasts, analyst insights and globally
acceptable benchmark indicators (for example, World Bank's Doing Business Scores,
Transparency International's Corruption Perceptions Index).
© Business Monitor International Ltd Page 21MENA Investment Opportunities in Food & Drink: Risk/Reward Analysis
Weightings Of Categories And Indicators
Food & Drink (Non-Alcoholic Drinks) Risk/Reward Index
Source: BMI
The RRI matrix is divided into two distinct categories:
Rewards
Evaluation of an industry's size and growth potential (Industry Rewards), and also macro industry and/or
country characteristics that directly impact the size of business opportunities in a specific sector (Country
Rewards).
Risks
Evaluation of micro, industry-specific characteristics, crucial for an industry to develop to its
potential (Industry Risks) and a quantifiable assessment of the country's political, economic and
operational profile (Country Risks).
Assessing Our Weightings
Our matrix is deliberately overweight on Rewards (60% of the final RRI score for a market) and within
that, the Industry Rewards segment (60% of the final Rewards score). This is to reflect the fact that when
it comes to long-term investment potential, industry size and growth potential carry the most weight in
indicating opportunities, with other structural factors (demographic, labour statistics and infrastructure
availability) weighing in, but to a slightly lesser extent. In addition, our focus and expertise in emerging
and frontier markets has dictated this bias towards industry size and growth to ensure we are able to
identify opportunities in countries where regulatory frameworks are not as developed and industry sizes
© Business Monitor International Ltd Page 22MENA Investment Opportunities in Food & Drink: Risk/Reward Analysis
are not as big (in USD terms) as in developed markets, but where we know there is a strong desire to
invest.
Indicators - Explanation And Sources
Food & Drink (Alcoholic Drinks) Risk/Reward Index, Indicators
Indicator Source Rationale
Rewards
Industry Rewards
Denotes per capita spending on food & non-alcoholic drinks in
F&D Spending Per Capita BMI Forecast USD. Wealthier populations spend more on F&D products.
Denotes food & non-alcoholic drinks sector dynamism as a %.
Scores based on annual average growth over our five-year
F&D Five-Year Growth Rate BMI Forecast forecast period.
Denotes total household spending on food & non-alcoholic
drinks in USDbn. Large markets score higher than smaller
Total F&D Expenditure BMI Forecast ones.
Country Rewards
Size of the population in millions as a measure for the total
Population BMI Forecast addressable market.
Proportion of households with an income that exceeds
USD10,000. Excludes those in poverty but demonstrates
Mass Affluent Class BMI Forecast potential demand for branded products.
Size of the urban population in millions. Higher urban
population size is a positive for distribution, higher economic
development and accessing products through a network of
Urban Population BMI Forecast retailers.
Proportion of the population between 20-39 years old as a %.
This is typically the range that companies target as a high
Spending Population BMI Forecast spending/trendsetting generation.
Risks
Industry Risks
Uses Operational Risk's Economic Openness as a proxy for
BMI Operational determining the ease of entering and doing business in a
Regulatory Environment Risk Index market.
Uses our urban/rural split (%) data as a proxy for determining
the level of retail/hospitality formalisation in the market. Highly
urbanised markets allow companies to easily serve more
F&D Formalisation BMI Forecast consumers.
Uses Operational Risk's Logistics Risk to determine the risks
and costs associated with moving products around a market.
BMI Operational Higher scores indicate quality transport, cheap fuel/electricity
Logistics Risk Risk Index and high levels of tech adoption
Country Risks
© Business Monitor International Ltd Page 23MENA Investment Opportunities in Food & Drink: Risk/Reward Analysis
The Long-Term Economic Risk Index takes into account the
structural characteristics of economic growth, the labour
market, price stability, exchange rate stability and the
Long-Term Economic Risk BMI Country Risk sustainability of the balance of payments, as well as fiscal and
Index Index external debt outlooks for the coming decade.
The Short-Term Economic Risk Index seeks to define current
vulnerabilities and assess real GDP growth, inflation,
unemployment, exchange rate fluctuation, balance of payments
Short-Term Economic Risk BMI Country Risk dynamics, as well as fiscal and external debt credentials over
Index Index the coming two years
The Long-term Political Risk Index assesses a country's
structural political characteristics based on our assumption that
liberal, democratic states with no sectarian tensions and broad-
BMI Country Risk based income equality exhibit the strongest characteristics in
Long-Term Political Risk Index Index favour of political stability, over a multiyear timeframe.
The Short-Term Political Risk Index assesses pertinent political
BMI Country Risk risks to investment climate stability over a shorter time frame,
Short-Term Political Risk Index Index up to 24 months forward.
The Operation Risk Index focuses on existing conditions
BMI Operational relating to four main risk areas: Labour Market, Trade and
Operational Risk Index Risk Index Investment, Logistics, and Crime and Security.
Source: BMI
Food & Drink (Alcoholic Drinks) Risk/Reward Index
Our Food & Drink (Alcoholic Drinks) Risk/Reward Index (RRI) quantifies and ranks a country's
attractiveness within the context of the Food & Drink (Alcoholic Drinks) industry, based on the balance
between the Risks and Rewards of entering and operating in different countries.
We combine industry-specific characteristics with broader economic, political and operational market
characteristics. We weight these inputs in terms of their importance to investor decision making in a given
industry. The result is a nuanced and accurate reflection of the realities facing investors in terms of:
1) the balance between opportunities and risk; and
2) between sector-specific and broader market traits.
This enables users of the index to assess a market's attractiveness in a regional and global context.
The index uses a combination of our proprietary forecasts and analyst assessments of the regulatory
climate. As regulations evolve and forecasts change, so the index scores change providing a highly
dynamic and forward-looking result.
The Food & Drink (Alcoholic Drinks) Risk/Reward Index universe comprises 90 countries.
© Business Monitor International Ltd Page 24MENA Investment Opportunities in Food & Drink: Risk/Reward Analysis
Benefits of using BMI's Food & Drink (Alcoholic Drinks) RRI
Global Rankings: One global table, ranking all the countries in BMI's universe for Food & Drink
(Alcoholic Drinks) from least (closest to zero) to most attractive (closest to 100).
Accessibility: Easily accessible, top down view of the global, regional or sub-regional
risk/reward profiles.
Comparability: Identical methodology across 90 countries for Food & Drink (Alcoholic Drinks)
allows users to build lists of countries they wish to compare, beyond the confines of a global or
regional grouping.
Scoring: Scores out of 100 with a wide distribution, provide nuanced investment comparisons.
The higher the score, the more favourable the country profile.
Quantifiable: Quantifies the rewards and risks of doing business in the Food & Drink (Alcoholic
Drinks) sector in different countries around the world and helps identify specific flashpoints in
the overall business environment.
Comprehensive: Comprehensive set of indicators, assessing industry-specific risks and rewards
alongside political, economic and operating risks.
Entry Point: A starting point to assess the outlook for the Food & Drink (Alcoholic Drinks)
sector, from which users can dive into more granular forecasts and analysis to gain a deeper
understanding of the market.
Balanced: Multi-indicator structure prevents outliers and extremes from distorting final scores
and rankings.
Methodology is a combination of proprietary BMI forecasts, analyst insights and globally
acceptable benchmark indicators (for example, World Bank's Doing Business Scores,
Transparency International's Corruption Perceptions Index).
© Business Monitor International Ltd Page 25MENA Investment Opportunities in Food & Drink: Risk/Reward Analysis
Weightings Of Categories And Indicators
Food & Drink (Alcoholic Drinks) Risk/Reward Index
Source: BMI
The RRI matrix is divided into two distinct categories:
Rewards
Evaluation of an industry's size and growth potential (Industry Rewards), and also macro industry and/or
country characteristics that directly impact the size of business opportunities in a specific sector (Country
Rewards).
Risks
Evaluation of micro, industry-specific characteristics, crucial for an industry to develop to its
potential (Industry Risks) and a quantifiable assessment of the country's political, economic and
operational profile (Country Risks).
Assessing our Weightings
Our matrix is deliberately overweight on Rewards (60% of the final RRI score for a market) and within
that, the Industry Rewards segment (60% of the final Rewards score). This is to reflect the fact that when
it comes to long-term investment potential, industry size and growth potential carry the most weight in
indicating opportunities, with other structural factors (demographic, labour statistics and infrastructure
availability) weighing in, but to a slightly lesser extent. In addition, our focus and expertise in emerging
and frontier markets has dictated this bias towards industry size and growth to ensure we are able to
identify opportunities in countries where regulatory frameworks are not as developed and industry sizes
are not as big (in USD terms) as in developed markets, but where we know there is a strong desire to
invest.
© Business Monitor International Ltd Page 26MENA Investment Opportunities in Food & Drink: Risk/Reward Analysis
Indicators - Explanation And Sources
Food & Drink (Alcoholic Drinks) Risk/Reward Index, Indicators
Indicator Source Rationale
Rewards
Industry Rewards
Denotes per capita consumption of Alcoholic Drinks in litres.
Measures which populations consume more on alcohol
Alcohol Consumption Per Capita BMI Forecast products at the individual level rather than total size.
Denotes Alcoholic Drinks sector dynamism as a %. Scores
based on annual average growth over our five-year forecast
Alcohol 5-Year Growth Rate BMI Forecast period.
Denotes total consumption of Alcoholic Drinks in millions of
Total Alcohol Consumption BMI Forecast litres. Large markets score higher than smaller ones.
Country Rewards
Size of the population in millions as a measure for the total
Population BMI Forecast addressable market.
Proportion of households with an income that exceeds
USD10,000. Excludes those in poverty but demonstrates
Mass Affluent Class BMI Forecast potential demand for branded alcohol products.
Size of the urban population in millions. Higher urban
population size is a positive for distribution, higher economic
development and accessing products through a network of
Urban Population BMI Forecast retailers.
Proportion of the population between 20-39 years old as a %.
This is typically the range that companies target as a high
spending/trendsetting generation and are generally over the
Spending Population BMI Forecast legal drinking age.
Risks
Industry Risks
Uses Operational Risk's Economic Openness as a proxy for
BMI Operational determining the ease of entering and doing business in a
Regulatory Environment Risk Index market.
Uses our Urban/Rural Split (%) data as a proxy for determining
the level of retail/hospitality formalisation in the market. Highly
urbanised markets allow companies to easily serve more
F&D Formalisation BMI Forecast consumers.
Uses Operational Risk's Logistics Risk to determine the risks
and costs associated with moving products around a market.
BMI Operational Higher scores indicate quality transport, cheap fuel/electricity
Logistics Risk Risk Index and high levels of tech adoption
Country Risks
The LT ERI takes into account the structural characteristics of
economic growth, the labour market, price stability, exchange
rate stability and the sustainability of the balance of payments,
BMI Country as well as fiscal and external debt outlooks for the coming
Long Term Economic Risk Index Risk Index decade.
© Business Monitor International Ltd Page 27MENA Investment Opportunities in Food & Drink: Risk/Reward Analysis
The ST ERI seeks to define current vulnerabilities and assess
real GDP growth, inflation, unemployment, exchange rate
BMI Country fluctuation, balance of payments dynamics, as well as fiscal
Short Term Economic Risk Index Risk Index and external debt credentials over the coming two years
The LT PRI assesses a country's structural political
characteristics based on our assumption that liberal,
democratic states with no sectarian tensions and broad-based
BMI Country income equality exhibit the strongest characteristics in favour
Long Term Political Risk Index Risk Index of political stability, over a multiyear timeframe.
The ST PRI assesses pertinent political risks to investment
BMI Country climate stability over a shorter time frame, up to 24 months
Short Term Political Risk Index Risk Index forward.
The ORI focuses on existing conditions relating to four main
BMI Operational risk areas: Labour Market, Trade and Investment, Logistics,
Op Risk Index Risk Index and Crime and Security.
Source: BMI
© Business Monitor International Ltd Page 28You can also read