THE 2016 U.S. GOLF ECONOMY REPORT - We Are Golf
←
→
Page content transcription
If your browser does not render page correctly, please read the page content below

THE 2016 U.S. GOLF ECONOMY REPORT
Acknowledgements
This report was prepared by TEConomy Partners, LLC, in agreement with GOLF 20/20. Support for this report comes from the
following allied national golf organizations: GCSAA, IAGA, LPGA, NGCOA, PGA of America, PGA TOUR, and USGA. The 2016
U.S. Golf Economy Study was conducted by Jennifer Ozawa, Peter Ryan, and Marty Grueber at TEConomy Partners, LLC.
Table of Contents

Overview ................................................................................................................................................................ 1

Economic Activity by Demographic Segment ............................................................................................................ 4

Methodology .......................................................................................................................................................... 5
Golf Facility Operations ........................................................................................................................................... 8
Golf Facility Capital Investment ..............................................................................................................................12

Golf-Related Supplies .............................................................................................................................................14
Tournaments, Associations & Charitable Events ......................................................................................................16
Golf Real Estate .....................................................................................................................................................19

Golf Tourism..........................................................................................................................................................21
Economic Impact ...................................................................................................................................................23
References ............................................................................................................................................................25
2016 U.S. Golf Economy Report

Overview
The game of golf drove $84.1 billion of economic activity across the United States in 2016, up from $68.8 billion in
2011. This direct economic activity includes not only core golf facility operational expenditures and capital
investments, but also golf-related supplies (i.e., equipment, apparel, and media); golf tournaments, associations,
player endorsements, and charitable events; and golf-enabled tourism and real estate, as depicted in Figure 1.

When golf’s combined effect (direct, indirect, and induced impact) is calculated, the game of golf generated
$191.9 billion in total economic output, 1.886 million jobs, and $58.7 billion in compensation.

               Figure 1 U.S. Golf’s Economic Impact, 2016

               Source 1 TEConomy Partners, LLC

The 2016 U.S. Golf Economy Report represents the fourth study aimed at measuring golf’s impact on different
sectors of the economy over time. The previous studies estimated golf’s direct and total economic impact for the
base years: 2000, 2005, and 2011. The 2016 study findings point to the golf industry’s strong recovery from the
Great Recession of 2008-2010. The total size of the U.S. golf economy grew by 22.2% since 2011 (which
represents a 4.1% compound annual growth rate).

                                                                                                                  1
2016 U.S. Golf Economy Report
Table 1 shows the estimated size of each of the six golf industry segments in 2000, 2005, 2011, and 2016. The
three largest golf industry segments in 2016 were:
• Golf Facility Operations: Despite a net decline of 737 total facilities since 2011, average revenue for the
U.S.'s 15,014 regulation golf facilities and over 2,300 alternative facilities grew in 2016, generating $34.4
billion of direct economic activity and marking a solid recovery of 2.9% compound annual growth since
2011.
• Golf Tourism: Home to half of the world's golf courses and year-round opportunities to play, U.S. golf
generated $28.5 billion of tourism spending in 2016 making it the second largest golf industry segment.
This is up from $20.6 billion in 2011, driven by greater spending per trip and growth in total trips taken,
and represents a 4.6% compound annual growth rate (CAGR).
• Golf Real Estate: The desire to live in an active, outdoor community in a beautiful setting has fueled new
golf home construction in both golf communities and golf resorts over the past several decades. New golf
home construction, which closely tracks national trends, grew to $7.2 billion in 2016, up from $3.1 billion
in 2011 (18.5% CAGR). The other component of golf real estate is the premium associated with living in a
golf community. The estimated golf premium increased to $2.0 billion 2016, up from $1.6 billion in 2011,
reflecting recovery in the sale of existing golf homes and slight growth in the total number of existing
homes in golf communities.
For comparison, the three largest segments in 2011 were Golf Facility Operations, Golf Tourism, and Golf-Related
Supplies. Golf Real Estate fell out of the top three in 2011 due to the impact of the financial crisis and economic
recession on the real estate market. Looking across all six industry segments over the past 16 years, most have
closely tracked national industry sector trends and business cycles. The exception is new golf course construction,
which peaked in 2000, and has been correcting for the over-supply in courses since then.
In terms of the performance of the other three industry segments:
• Golf-Related Supplies: On-course and off-course sales of golf equipment, apparel, and media were up in
2016 ($6.0 billion), compared to 2011, with strongest sales growth in the golf equipment category.
• Tournaments, Associations, and Player Endorsements: Spending on professional tournaments,
associations, and player endorsements grew to $2.4 billion, up from $2.0 billion in 2011.
• Golf Charitable Events: Despite fewer total golf facilities in 2016 compared to 2011, the U.S. golf
industry supported a slightly higher level of charitable fundraising in 2016: $3.94 billion compared to
$3.91 billion in 2011. 1
• Golf Capital Investment: New golf course construction was down to $210 million in 2016, but existing
facilities invested $1.9 billion in existing courses, bringing total capital investment to $2.16 billion, up from
$2.07 billion in 2011.
1 National Golf Foundation (2017). The Charitable Impact Report.
22016 U.S. Golf Economy Report
Table 1. Size of U.S. Direct Golf Economy by Industry Segment:
2000, 2005, 2011 and 2016 ($M)
CAGR
2000 2005 2011 2016
(2011-16)
CORE INDUSTRIES
Golf Facility Operations $20,496 $28,052 $29,852 $34,417 2.9%
Golf Course Capital Investments $7,812 $3,578 $2,073 $2,156 0.8%
New course construction $5,646 $1,419 $516 $210 -16.4%
Investment in existing facilities $2,166 $2,159 $1,557 $1,946 4.6%
Golf-Related Supplies $5,982 $6,151 $5,639 $6,043 1.4%
Tournaments, Associations, and Player
$1,293 $1,682 $2,045 $2,442 3.6%
Endorsements
Golf Charitable Events $3,200 $3,501 $3,911 $3,940 0.1%
Total Core Industries $38,783 $42,964 $43,520 $48,998 2.4%
ENABLED INDUSTRIES
Golf Real Estate $9,904 $14,973 $4,735 $9,341 14.6%
New home construction $8,400 $11,628 $3,140 $7,235 18.5%
Realized golf premium $1,504 $3,345 $1,595 $2,016 4.8%
Golf Tourism $13,480 $18,001 $20,555 $25,724 4.6%
Total Enabled Industries $23,384 $32,975 $25,290 $35,065 6.8%
TOTAL GOLF ECONOMY $62,167 $75,939 $68,810 $84,064 4.1%
Source: TEConomy Partners, LLC, 2016 study. SRI International, 2000, 2005, and 2011 studies.
32016 U.S. Golf Economy Report
Economic Activity by Demographic Segment
This study illustrates that the U.S. golf economy has grown substantially over the past 16 years. The golf economy
expands and contracts largely in tandem with U.S. economic expansions and recessions, but also driven by
fluctuations in overall golf participation. One strategy to maintain and strengthen the economic impact of the
game, over time, is to increase participation and to welcome more diverse slices of the U.S. population to the
game. Accordingly, major U.S. Golf associations and industry partners are dedicated to growing the game through
several programs focused on participation.
According to the NGF’s Golf Participation in the U.S. 2017, overall participation at golf facilities declined slightly
over the past five years, from 25.7 million people to 23.8 million. However, during the same period, latent
demand (non-golfers interested in playing golf) doubled from 6.4 million to 12.8 million, while beginning golfers
(playing on a golf course for the first time) also grew from 1.5 million to 2.5 million. Although golf’s recovery from
the recession of 2008-2010 has been slow, the NGF data suggests there may be greater demand as the U.S.
economy improves—particularly for women and non-Caucasian players. In this scenario, the industry should track
participation, as well as the various segments of economic impact over time.
The table below presents the direct economic impact of all participants on the core golf economy segments, as
well as the estimated direct economic impact of women and non-Caucasians participants relative to their
participation.
Table 2. Size of U.S. Direct Golf Economy by Demographic Segment, 2016
Segment All Participants Women Non-Caucasian
Number of golfers (M) 23.8 (100%) 5.8 (24%) 4.6 (19%)
Direct core golf economy ($M) $48,998 $11,759 $9,309
Source: NGF (2017). Golf Participation in the U.S. 2017 edition.
This direct economy breakdown assumes equal distribution of women and non-Caucasian expenditures across the
price continuum—from value products and services to those at the high-end. Data is not available at a more
granular level. In addition, the women’s and non-Caucasian’s segments are not mutually exclusive since “Women”
includes Caucasian and non-Caucasian women and non-Caucasians includes both male and female participants.
42016 U.S. Golf Economy Report
Methodology
Framework
For over 15 years, the World Golf Foundation’s GOLF 20/20, allied national golf associations, and key golf industry
stakeholders in many states have successfully measured and communicated golf’s economic impact—i.e., how
much the game contributes to state and national economies through direct, indirect, and induced economic
activity and employment. As a result, the framework has been replicated internationally—e.g., see Ernst &
Young’s The Australian Golf Industry Economic Report 2010 and Sports Marketing Survey Inc.’s The Economic
Impact of Golf on the Economy of England 2012. 2 Adoption of the WGF’s golf industry impact framework 3 has
enabled the golf industry to assess its overall growth and the growth of individual industry segments over time
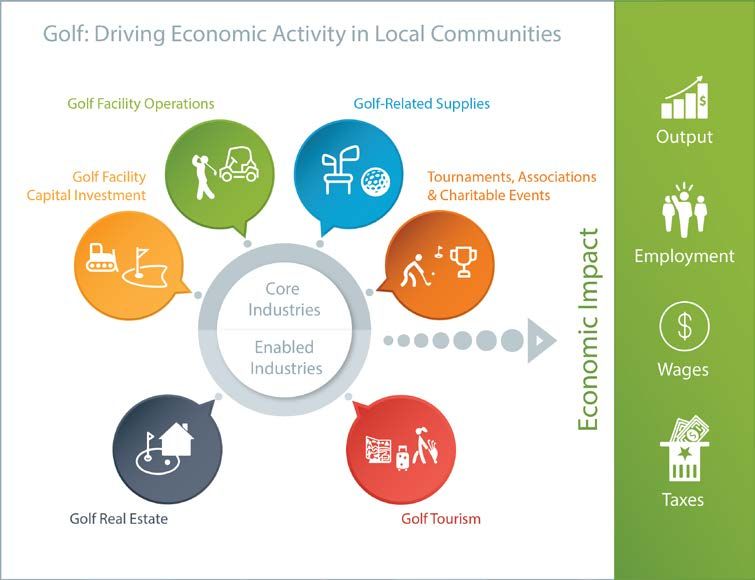
and across geographic regions. Figure 1 presents the WGF’s golf industry and economic impact framework.
Figure 2 Golf Industry Impact Framework
Source: TEConomy Partners, LLC
2 Enrnst & Young (2011). The Australian Golf Industry Economic Report 2010,
https://www.clearinghouseforsport.gov.au/__data/assets/pdf_file/0003/437610/AGIC_2010_Golf_Industry_Economic_Report.pdf Sports
Marketing Survey Inc. (2014). The Economic Impact of Golf on the Economy of England 2012, http://www.englandgolf.org/library-
media%5Cdocuments%5CThe%20Economic%20Impact%20of%20Golf%20on%20the%20Economy%20of%20England.pdf.
3 The World Golf Foundation’s golf industry cluster framework debuted in its commissioned study performed by SRI International (2002).
The Golf Economy Report. http://www.golf2020.com/media/30717/2002golf2020economicreport.pdf
52016 U.S. Golf Economy Report
The framework divides the golf industry into core and enabled industries. The four core industry segments include
Golf Facility Operations, Golf Facility Capital Investments (course construction and renovations), Golf-Related
Supplies (production and retail sales), and Golf Tournaments, Associations, and Charitable Events. The two
enabled industry segments are Golf Real Estate (new home construction and premiums related to the sale of
existing homes in golf communities) and Golf Tourism.
Methodology and Data
To estimate golf’s economic impact, TEConomy first collected and analyzed secondary data from a wide range of
long-standing data sources with time-series data for each of the six industry segments. These data were used to
develop direct expenditure impact estimates for each of the four core and two enabled industry segments. These
data sources include: the National Golf Foundation’s US Golf Facilities report and Golf’s Charitable Impact report,
the Professional Golfers’ Association of America’s PGA Operations Survey and Compensation Survey, the U.S.
Economic Census, the Golf Course Superintendents Association of America’s Capital Expenditures Survey, the Golf
Course Builders Association of America, Dun & Bradstreet/Hoovers, National Sporting Goods Association’s The
Sporting Goods Market Survey, golf association tax filings, TNS America and D.K. Shiflett for golf visitor trip data,
and other surveys and studies commissioned by state tourism agencies.
TEConomy also performed primary research, such as online searches for major golf communities and interviews
with developers and real estate agents to collect data on the number of homes constructed and the average
construction cost of homes in these developments. In cases where response rates to other surveys are low,
TEConomy works with state golf task forces to implement golf facility surveys to collect additional economic data.
Using these data, TEConomy estimated the direct expenditure impacts for each of the four core and two enabled
industry segments. Based on the golf task force’s review and approval of these estimates, TEConomy then used
the U.S. Bureau of Economic Analysis Regional Input-Output Modeling System (RIMS) II multipliers to estimate the
golf industry’s total economic impact on the state economy. In economics, the idea of the multiplier is that
changes in the level of economic activity in one industry impacts other industries in the economy through changes
in expenditures and incomes. The channels by which growth or decline in a particular industry sector impacts the
level of overall economic activity in a state are:
• Direct effects: The direct employment and other economic activity generated by the core and enabled
golf industry segments’ operations and expenditures.
• Indirect effects: The demand generated for supplier firms by the six golf industry segments.
• Induced effects: The additional economic activity generated by the spending of these supplier firms and
employees in the overall economy.
The sum of these three effects is referred to as the total impact.
62016 U.S. Golf Economy Report
RIMS II calculates the indirect and induced effects stemming from the direct economic activity. It is the base data
upon which all other proprietary economic impact modeling software is built. One change to RIMS II from
previous years is that the BEA no longer provides multipliers at the national level. Therefore, TEConomy
constructed a national multiplier from the 48 contiguous U.S. states and the District of Columbia.
The subsequent chapters present TEConomy’s estimates of the size of each of the six golf industry segments in
2016, as well as an explanation of what was measured and the estimation approach. The final chapter presents
our calculation of the golf economy’s total economic impact having run the direct impact estimates through the
RIMS II multipliers and analyzing the results.
72016 U.S. Golf Economy Report
Golf Facility Operations
Finding
The U.S. golf industry’s 15,014 regulation golf facilities and over 2,300 alternative facilities generated a total
$34.417 billion in operating revenue in 2016, up from $29.852 billion in 2011 and representing a 2.9% CAGR.
Traditional facilities generated $33.286 billion in operating revenue in 2016, up from $28.945 billion in 2011,
representing a CAGR of 2.8%. The total number of golf facilities declined during this period (down by 737 facilities,
or a total 4.7%, from 2011), however average revenue for the remaining facilities grew as the U.S. economy
recovered from the major economic downturn that ended in 2010. Lower unemployment and stronger growth in
consumer spending and tourism supported golf facility operations in 2016, as did the absence of extreme weather
across most of the country.
Alternative facilities—practice ranges, miniature golf, and indoor centers—also experienced recovery and growth
over this period. Alternative facilities generated $1.131 billion, up from $907.1 million in 2011. Notable among the
alternative facilities has been the strong performance of Texas-based Topgolf. Started in 2000 by two brothers,
Topgolf has grown to 33 venues across the U.S. and UK with estimated revenue of $300 million in 2016. 4 Analysts
are interested to see whether Topgolf’s business model innovation translates into growth in rounds on traditional
courses. Topgolf marries a technology-enabled golf gaming experience (through RFID chips that tag the ball to the
player) with food, beverage, and a social atmosphere that appeals to a younger and more diverse crowd of
players. The average time spent at Topgolf is 2 hours; 37% of visitors are non-golfers; 67% of visitors are under 35
years of age; and Topgolf venues averaged 26,000 visits a day in 2016. 5
Table 3. U.S. Golf Facility Revenue ($M):
2005, 2011, and 2016
2005 2011 2016
Regulation facilities $26,958 $28,945 $33,286
Alternative facilities $516 $907 $1,131
Total $28.052 $29.852 $34,417
Source: TEConomy Partners, LLC, 2016 calculations. SRI International, 2005 and 2011 calculations.
4 Indap, Sujeet (2016). “Topgolf targets expansion beyond the green,” The Financial Times. 9 March 2016.
5 Topgolf (2017). Fact Sheets 2016. Accessed 18 September 2017.
82016 U.S. Golf Economy Report
Approach
What is measured:
Golf facilities generate operating revenue through greens fees, membership fees, range fees, golf cart rental, and
associated spending on food and beverage. The golf facilities use this revenue to support facility operations
through direct employment and purchases of a range of goods and services from other vendors—e.g., turfgrass
equipment and maintenance providers, golf equipment and apparel manufacturers, food and beverage providers,
etc. These expenditures by golf facilities is what drives the economic impact.
How it’s measured:
This industry segment’s direct economic impact is calculated by multiplying the number of regulation golf facilities
in each of four categories—private, daily fee/semi-private, municipal/university/military, and resort—by the
average revenue for that type of facility. TEConomy did the same for alternative facilities, which includes practice
ranges, miniature golf, and others.
TEConomy collected and analyzed data on the number of facilities and operational revenue by facility type from
three sources: the U.S. Economic Census, the PGA of America, and the National Golf Foundation. The Economic
Census is conducted every five years and reports the total number of facilities, revenue, employment, and wages
for private facilities and daily fee facilities in the U.S. The Economic Census does not survey and report on golf
resorts or municipal, university or military golf facilities as profit and loss centers separate from their larger
institutions. 6 The PGA of America surveys facilities with a PGA Professional, which represents the majority of golf
facilities, but not all. NGF has tracked golf facility openings and closures for over two decades. However, 2010 was
the last year that NGF conducted a financial operations survey.
TEConomy used NGF data for total number of facilities broken down by type and PGA and Economic Census data
for average revenue. NGF facility numbers and PGA average revenue data were also used for the previous 2011
study. The NGA facilities data show a total decline of 737 facilities from 2011-2016, with the steepest decline in
private facilities, followed by daily fee/semi-private facilities, and then resorts. For alternative facilities,
TEConomy included 1,019 miniature golf facilities and 1,304 golf ranges based on Economic Census 7 and PGA of
America data.
6 Golf resorts are included in the Accommodation industry code rather than the Golf Courses industry code. The Accommodation industry
data do not break out golf resorts from hotels, ski resorts, etc. Municipal/university/military facilities are also not
7 The 2012 Economic Census is the latest available. The next Economic Census will be conducted in 2017, with data publicly released a
couple years after that.
92016 U.S. Golf Economy Report
Table 4. Number of U.S. Golf Facilities by Type of Facility: 2011-2016
Daily fee/ Municipal/
Private Public Semi- University/ Resort Total
private Military
NGF 2016 3,670 11,344 8,102 2,462 780 15,014
NGF 2015 3,707 11,497 8,259 2,453 785 15,204
NGF 2014 3,792 11,580 8,336 2,453 791 15,372
NGF 2013 3,901 11,615 8,385 2,441 789 15,516
NGF 2012 3,826 11,793 8,580 2,426 787 15,619
NGF 2011 4,059 11,692 8,492 2,406 794 15,751
% change 2011-16 -9.6% -3.0% -4.6% 2.3% -1.8% -4.7%
Source: National Golf Foundation. U.S. Golf Facilities, 2012-2017.
For average facility revenue, TEConomy used PGA Compensation Survey data and Economic Census data. Facilities
with a PGA Professional tend to be higher-end, 18-hole facilities. To adjust for this upwards bias in the data,
TEConomy took the average of the reported revenue for privates and daily fees from the PGA Compensation
Survey and Economic Census. The Economic Census revenue data is more representative of the true distribution
of all golf facilities and all facilities are required by law to respond to the Census. TEConomy used the same
approach for municipal/university/military facilities, using Census daily fee revenue to adjust for bias. As
mentioned, the Economic Census does not survey and report on golf resorts, and the PGA Compensation Survey
had a relatively high response rate for resorts. TEConomy used the PGA data for resorts after removing three
outliers.
TEConomy used $3.936 million for private facilities, up from $3.336 million in 2011; $1.710 million for daily fee
facilities, up from $1.398 million in 2011; $1.613 million for municipal/university/military facilities, up from $1.448
million; and $4.463 million for resorts, up from $3.278 million in 2011.
102016 U.S. Golf Economy Report
Table 5. U.S. Average Golf Facility Revenue by Type: 2002-2016
Municipal/
Daily fee/
Private University/ Resort
Semi-private
Military
TEConomy 2016 $3,935,877 $1,710,140 $ 1,613,434 $ 4,462,871
SRI 2011 $3,336,057 $1,397,765 $1,447,725 $3,278,233
Economic Census 2012 $3,044,789 $1,380,794 - -
Economic Census 2007 $2,827,092 $1,374,046 - -
Economic Census 2002 $2,041,960 $1,189,179 - -
Source: U.S. Census Bureau, U.S. Economic Census 2002, 2007 and 2012. TEConomy Partners, LLC, 2016 estimates and
SRI International, 2011 estimates.
112016 U.S. Golf Economy Report
Golf Facility Capital Investment
Finding
In 2016, U.S. golf facilities invested $1.946 billion in capital improvements to existing greens and tees, equipment,
and structures, up from $1.557 billion in 2011. This represents a compound annual rate of growth of 4.6% over
this five-year period. In 2011, many golf facilities still had major capital projects on hold waiting to see how quickly
the economy would recover from the recession that ended in 2010. Golf course superintendent responses to a
2016 survey show strong recovery in average capital investment by existing facilities, but new course construction
remains on a downward trend. According to the National Golf Foundation, 190 courses closed in 2016, and half of
new course constructions and openings are expansions or renovations to existing facilities as opposed to new golf
courses. Consequently, new course construction expenditures declined from $515.8 million in 2011 to $210.2
million in 2016, as the market continues to correct for over-supply of courses. Among the eight new golf courses
that opened in 2016 were The Loop at Forest Dunes, a Tom Doak-designed reversible course in Michigan, and
Mossy Oak, a Gil Hanse-designed course in Mississippi. Gil Hanse last designed the highly acclaimed Olympic golf
course in Rio de Janeiro, Brazil.
Table 6. U.S. Golf Facility Capital Investment ($M): 2005, 2011, and 2016
2005 2011 2016
Existing Facilities $2,159 $1,557 $1,946
New Course Construction $1,421 $516 $210
Source: TEConomy Partners, LLC, 2016 calculations. SRI International, 2005 and 2011 calculations.
Approach
What is measured:
Capital investments are major improvements outside of normal maintenance and operating expenditures by golf
facilities for turf maintenance and grounds upkeep. Golf facilities periodically make major investments to improve
greens and tees, renovate clubhouses and other buildings, and purchase turf maintenance equipment and
irrigation systems. In addition to capital investments by existing facilities, construction of new golf courses
constitutes is the other major type of capital investment.
How it’s measured:
Golf facility capital investment data comes from a survey of golf course superintendents. The Golf Course
Superintendents Association of America includes a golf facility capital budget question on its annual
Compensation Survey. Coming out of the 2008-2010 great recession, many golf facilities were still waiting to see
122016 U.S. Golf Economy Report
how quickly the economy would recover, and therefore held off on major capital investments. GCSAA survey data
indicate that average golf facility capital investment was only $98,873 in 2011, but rose to $129,603 in 2016, as
shown in Table 4.
Table 7. U.S. Golf Facility Capital Investment in Existing Facilities:
2005, 2011, and 2016
2005 2011 2016
Number of facilities (NGF) 16,052 15,751 15,014
Average capital investment (GCSAA) $134,513 $98,873 $129,603
Source: NGF. U.S. Golf Facilities, 2006, 2012, 2017 editions. GCSAA. Compensation Survey 2006, 2012, 2016.
The National Golf Foundation tracks the number of new golf courses under construction and the number of new
golf facility openings each year as part of its annual U.S. Golf Facilities publication. In 2016, NGF estimated there
were 17 new 18-hole equivalent golf courses and 20 expansions under construction. The Golf Course Builders
Association of America provides data on golf course construction and expansion costs based on its survey of golf
course builders around the country. The most recent data is from 2011. TEConomy adjusted the average cost of
construction for inflation.
Table 8. New 18-Hole Equivalent Golf Course Construction and Expansions:
2005, 2011, and 2016
2005 2011 2016
New 85.0 12.5 7.5
Openings Expansions 39.5 6.5 8.0
Total 124.5 19.0 15.5
New 238.5 36.5 17.0
Under construction Expansions 69.5 20.0 20.0
Total 308.0 56.5 37.0
Source: NGF. U.S. Golf Facilities, 2006, 2012, 2016 editions.
132016 U.S. Golf Economy Report
Golf-Related Supplies
Finding
Consumer purchases of golf apparel, golf equipment, and golf media drive significant economic activity. The
economic value that accrues to the U.S. economy comes from both the manufacture and retail sale of these
goods. However, because the U.S. is a net importer of golf-related supplies, TEConomy focuses on the retail side
of the equation.
U.S. golf and apparel spending totaled $5.494 billion in on-course and off-course sales in 2016, up from $5.272
billion in 2011 representing a 1.4% CAGR. Retail sales of golf equipment experienced stronger growth and
recovery (1.8% CAGR) over this period compared to golf apparel (0.7% CAGR). Golf media, which includes golf
books, magazines, video games, and streamed video on-demand (SVOD) and DVDs/blu-ray also grew to $549.1
million in 2016, up from $522.6 million in 2011. Recovery in magazine ad revenue and sales coupled with growth
in SVOD outweighed declines in book revenue and the poor debut of the Rory McIlroy PGA TOUR game from EA
Sports, which replaced the Tiger Woods PGA TOUR game. 8
Table 9. U.S. Golf-Related Supplies Revenue ($M): 2005, 2011, and 2016
2005 2011 2016
Golf Equipment and Apparel $5,225 $5,116 $5,494
Golf Media $926 $523 $549
Total $6,151 $5,639 $6,043
Retail Sales Margin 39.7% 40.1% 41.7%
Source: TEConomy Partners, LLC, 2016 calculations, and SRI International, 2005 and 2011 calculations.
Approach
What is measured:
This segment measures the revenue that accrues to U.S. retailers, wholesalers, and distributors from spending by
golfers on golf equipment, golf shoes, golf apparel, and golf media.
8 Wiedey, Brian (2017). “EA Sports Still Thriving in 2017, Despite Some High-Profile Failures,” SportingNews.
http://www.sportingnews.com/other-sports/news/the-state-of-sports-gaming-from-ea-sports-in-2017-madden-fifa-nba-live-pga-
tour/1d0s4veq69dxq15rzlplyvlsfi
142016 U.S. Golf Economy Report
How it’s measured:
Data to calculate on-course and off-course retail spending on golf clubs, bags, shoes, balls, and apparel comes
from the National Sporting Goods Association. The NSGA conducts an annual survey of 100,000 households. NSGA
has collected this data since 2002. TEConomy subtracted merchandise sales from Golf Facility Operations revenue
to avoid double counting.
TEConomy estimated golf book sales using IBIS World’s estimate of retail book sales. Total retail book revenue
declined from $16.3 billion to $12.4 billion, and TEConomy estimates that golf’s share of total book sales also
declined over this period. Golf magazine revenue, on the other hand, rebounded driven by strong recovery in ad
revenue. TEConomy’s estimate is based on subscription levels for the major golf magazines and the paid
subscriptions share of total revenue. While video game sales experienced growth from 2011-2016, the best-selling
golf video game encountered problems in EA Sports’ transition to the Frostbite Engine and shift from Tiger Woods
to Rory McIlroy PGA TOUR game. The absence of a blockbuster golf video game led to a decline in golf video game
revenue in 2016. DVD and Streaming Video On Demand grew according to date from the Digital Entertainment
Group, and golf DVD and Streaming Video On Demand followed this national trend.
The estimation of economic impact is based upon the retail margin that accrues to U.S. companies that sell golf
equipment and apparel after paying for the cost of goods from the wholesaler or manufacturer (be they domestic
or foreign). The U.S. Census Bureau’s Annual Retail Trade Survey reports the retail margin for different industry
sectors.
152016 U.S. Golf Economy Report
Tournaments, Associations & Charitable Events
Finding
The economic activity driven by professional golf events, advertising expenditures on star player endorsements,
and amateur tournaments, turf maintenance research, and other activities organized by national and regional golf
member associations generated $2.422 billion in 2016. This is up from $2.045 billion in 2011, and represents a
3.6% CAGR. All three segments—tournaments, associations, and player endorsements—grew over this five-year
period as seen in the table below.
This section also includes an estimate for charitable giving generated through charitable golf events. While
charitable giving is considered a direct transfer of income rather than new economic activity, in economic
accounting terms, it is still the case that golf is an important fundraising vehicle for many local, regional, and
national nonprofit and charitable organizations and an impact that the golf industry is proud of. According to
survey data from the National Golf Foundation, charitable giving totaled $3.94 billion in 2016, up slightly from
2011 despite the net closure of 737 golf facilities from 2011-2016.
Table 10. Golf Tournaments, Associations, Player Endorsements & Charitable Giving ($M):
2005, 2011 and 2016
2005 2011 2016
Professional Tournaments $954 $1,171 $1,236
Associations $464 $554 $876
Player Endorsements $265 $320 $330
Total $1,682 $2,045 $2,442
Charitable Events $3,501 $3,911 $3,940
Source: TEConomy Partners, LLC, 2016 calculations, and SRI International, 2005 and 2011 calculations. NGF, 2005,
2011, and 2016 golf charitable giving estimates.
Tournaments: The professional golf tours organized by the PGA TOUR, The PGA of America, the USGA, and the
LPGA generated direct expenditures of $1.236 billion in 2016, up from $1.171 million in 2011. 9 Tournament
expenditures include the cost of TV broadcasting and other media coverage, tournament operations, managed
events, prize money and player benefits, and charitable contributions. Tournament revenues include ticket sales,
9This growth was largely driven by better data availability for association expenditures and marginal net growth in tournament revenue
despite the loss of one championship tournament.
162016 U.S. Golf Economy Report
sale of tournament broadcast rights, corporate sponsorship of events, merchandise, and related events
management.
Associations: State, regional, and national golf associations represent golfers, golf professionals, golf course
superintendents, golf course owners, and club managers across the United States. The associations support
economic activity in the local and regional economy by organizing junior and amateur tournaments, holding
professional development trainings and meetings, supporting turf maintenance research, and providing other
services. In 2016, golf associations spent $876.4 million (excluding the cost to hold the professional tournaments
which are included in the Tournaments calculation), up from $554.4 million in 2011. The major associations at the
national level include (in alphabetical order) the Club Managers Association of America, the Golf Course
Superintendents Association of America, the Ladies Professional Golfers Association, the National Golf Course
Owners Association, The PGA of America, the PGA TOUR, and the United States Golf Association. At the state
level, most states have a PGA Section, a state golf association, a chapter of the GCSAA, and a chapter of the
CMAA.
Player Endorsements: Golf equipment and apparel companies, but also makers of everything from watches to
software solutions, pay players to endorse their products. In 2016, Rory McIlroy, Arnold Palmer, and Phil
Mickelson rounded out the top 3 in Golf Digest’s Highest Paid Golfers list. Off-course endorsement earnings often
exceed on-course earnings for many of the players on Golf Digest list. Case in point is Arnold Palmer, who was the
most highly paid retired golfer before his death in late 2016. Companies paid players who reside in the U.S. $329.7
million in 2016, up from $319.7 million in 2011.
Charitable Events: Charitable golf events serve as important fundraisers for many local, regional, and national
charitable organizations. According to the National Golf Foundation’s most recent survey, approximately 84% of
all U.S. golf facilities hosted 142,600 charitable events in 2016 raising an average $26,400 per event. Despite
fewer golf facilities in 2016 compared to 2011, the golf industry supported a slightly higher level of charitable
fundraising: $3.94 billion, consisting of $3.76 billion of charitable monies raised and $180 million of in-kind and
cash donations, compared to $3.91 billion in 2011.
Approach
What is measured: Tournaments measure direct annual expenditures to host professional golf tournaments,
including the cost of TV broadcasting and other media coverage, tournament operations, managed events, prize
money and player benefits, etc. Associations measure the direct annual expenditures of major state and national
golf associations that are usually related to hosting amateur tournaments, meetings and professional
development trainings, turf maintenance research, etc., in addition to direct employment and operational
expenditures. Player endorsements are corporate advertising expenditures on star golfers who reside in the U.S.
172016 U.S. Golf Economy Report
Charitable giving captures both the net proceeds and in-kind contributions resulting from charitable golf events
that are hosted by golf facilities across the United States.
How it’s measured: TEConomy calculated the Tournaments estimate from the professional tournament-related
expenditures in profit and loss statements, annual reports, and/or tax filings of the LPGA, The PGA of America, the
PGA TOUR, and the USGA. Lodging, food and beverage, and other tourism-related expenditures associated with
these high-impact events are captured in the Golf-Related Tourism segment estimate. The Associations estimate
is the sum of the non-tournament-related operational expenditures of the national golf associations and the total
expenditures of the major state-level golf associations (e.g., PGA Sections, GCSA chapters, state golf associations)
from their annual tax filings. The Player Endorsements figure is calculated using the Golf Digest Highest Paid
Golfers list for 2016 and using a logarithmic function to extend the list to the top 100 players residing in the U.S.
The charitable giving estimate comes from the National Golf Foundation’s 2016 charitable giving survey. 10 The
national study of charitable giving is based on the number of golf facilities that hold charitable golf events, the
average number of events held by each facility, the net proceeds raised, and in-kind fees, services, and discounts
donated. Charitable giving is not included in economic impact estimation because it is considered a direct transfer
of income in economic impact accounting.
10 National Golf Foundation (2017). Estimating the Charitable Impact of Golf. January 2017.
182016 U.S. Golf Economy Report
Golf Real Estate
Finding
Beautiful and relaxing views married with being part of an active, outdoor community are reasons that have
fueled the growth in golf residences. TEConomy estimates that the construction of new golf homes generated
$7.233 billion in 2016, up from only $3.140 billion in 2011, representing a CAGR of 18.5%. The U.S. golf real estate
market closely tracks trends in the overall real estate market, and both the U.S. economy and the U.S. real estate
market were much stronger in 2016 compared to 2011. According to the National Association of Home Builders,
the number of new housing starts grew to 1,174,000 in 2016, up from 609,000 in 2011 (CAGR of 14.0% from 2011-
16). New residential construction has not recovered to levels seen in 2005, however, when there were 2,068,000
new home starts. Average construction costs for new homes have also grown over the 2011-2016 period. NAHB
data for single family homes indicate the average construction cost has increased from $184,197 in 2011 to
$289,421 in 2015 (latest available year).
There were an estimated 3,272 golf communities and golf resorts with residences in 2016, down from 3,324 in
2011. 11 TEConomy estimates the “golf” premium, the additional amount a buyer is willing to pay to purchase a
home located on a golf course or within a golf community, was $2.016 billion in 2016. This is up from an
estimated golf premium of $1.595 billion in 2011, reflecting recovery in the sale of existing golf homes and slight
growth in the total number of existing homes in golf communities.
Table 11. U.S. Golf Real Estate ($M): 2005, 2011, and 2016
2005 2011 2016
New Golf Home Construction $11,628 $3,140 $7,235
Existing Home Sales Golf Premium $3,345 $1,605 $2,016
Source: TEConomy Partners, LLC, 2016 calculations, and SRI International, 2005 and 2011 calculations.
Approach
What is measured: New golf home construction generates significant regional economic activity and impact. For
this segment, TEConomy measures expenditures related to new golf home construction, as well as economic
activity associated with the resale of existing golf homes and the premium associated with these homes. The “golf
premium” is the extra value a homeowner can expect to receive on the sale of a home located in a golf
community that goes beyond the home’s other features.
11 National Golf Foundation. 2012 and 2017 Golf Facilities in the U.S.
192016 U.S. Golf Economy Report
How it’s measured: TEConomy staff have conducted over 30 state-level impact studies over the past 15 years.
As part of these studies, we have conducted online research to identify golf communities and resorts with active
residential development and interviewed developers and listing agents about the average construction cost of
these new homes. To estimate total new golf home construction expenditures, TEConomy multiplied the average
number of homes under construction per development by the average cost of new homes by the 3,272 golf
communities and resorts with residences in the U.S.
To calculate the golf premium, TEConomy multiplied the existing golf communities and golf resorts with
residences by the median number of housing units per golf course by the home turnover rate. TEConomy
estimates that in 2016, the national home turnover rate (percentage of homes sold relative to the total housing
stock) was 4.0%, up from 3.2% in 2011.
202016 U.S. Golf Economy Report
Golf Tourism
Finding
Home to half of the world’s golf courses and year-round opportunities to play, golf drives billions of dollars in golf
tourism each year. Whether it’s a buddies trip, a seasonal vacation, or a recreational activity while on business or
visiting friends and family, golf tourism is major golf industry segment. In 2016, TEConomy estimates that U.S.’s
golf-related tourism expenditures totaled $25.7 billion. This is up from $20.6 billion in 2011 and represents a 4.6%
CAGR. The growth in golf tourism is driven by greater spending per trip and strong growth in the total number of
all types of trips taken, which helped to offset the slight decline in the percentage of people who played golf while
on a trip. This strong growth in trips (technically, “person stays” 12) signals the full recovery of the U.S. tourism
industry from the U.S. great recession of 2008-2010 (whose impact could be felt as late as 2012) and the global
economic recession of 2009.
Table 12. U.S. Golf Tourism: 2005, 2011, and 2016
2005 2011 2016
Golf Person Stays N/A 115,926,593 102,673,896
Average Spending per Trip ($)
N/A $252/$46 $350/$74
Overnight Trip/Day Trip
Total Travel Expenditures ($M) $18,001 $20,555 $25,724
Source: TEConomy Partners, LLC, 2016 calculations, and SRI International, 2005 and 2011 calculations.
Approach
What is measured: The golf tourism industry segment estimates the golf-related travel expenditures in which a
person travels 50-plus miles and plays or watches golf as a key recreational activity while on business or leisure
travel.
How it’s measured: Data for this calculation comes from D.K. Shifflet & Associates PERFORMANCE/MonitorSM
Travel Intelligence SystemSM. The data for the 2011 golf-related tourism expenditures estimate also came from
D.K. Shifflet. The company collects monthly data from a representative sample of over 60,000 traveling U.S.
households. In 2016, D.K. Shifflet estimates there were 3.949 billion total U.S. person stays, up from 3.238 billion
U.S. person stays in 2011, which represents a 22% increase, or 4.0% CAGR.
12 D.K. Shifflet defines a “person stay” as each person who stays at each location. One trip in which a person visits three places counts as
three person stays.
212016 U.S. Golf Economy Report
According to the National Golf Foundation, golf participation declined by approximately 8% from 2010-2015. D.K.
Shifflet reported that the share of people who reported playing golf while on a trip fell from 2.28% to 1.04% of
overnight trips and from 1.3% to 0.58% of day trips from 2011-2016. This translates into a -45% decline in golf
stays (115,926,593 to 63,973,735 under this scenario), which seems high against the reported 22% increase in all
types of trips (person stays) over this five-year period.
To validate the data, TEConomy looked at the state-level survey data where visitors were asked to report if they
had played golf while on a trip. Data is not publicly available for many states, but 2016 D.K. Shifflet and 2016 TNS
TravelsAmerica surveys for two very large states, Texas and California, indicate that golf trips accounted for 1.6%
of all trips for Texas and 0.4% of day trips and 2.1% of overnight trips for California. 2015 TNS TravelsAmerica
survey data for North Carolina, the tenth most populous state, indicate that golf trips accounted for 0.8% of day
trips and 2.0% of overnight trips. At the lower end, 2015 Longwoods survey data for Oregon and Pennsylvania
indicate that golf trips accounted for 1.0% and 0.8% of all trips, respectively, but references 2.0% for the U.S. as a
whole. Given these data points and the NGF golf participation data, TEConomy believes that the 2016 national
D.K. Shifflet survey data (i.e., golf accounting for 0.58% of day trips and 1.04% of overnight trips) is biased
downwards, especially for overnight trips.
To address this, TEConomy used the average of the 2011 and 2016 data to calculate golf trips. This gives us 0.94%
for day trips and 1.66% for overnight trips. This yields 102.7 million golf person stays in 2016, down -11% from
115.9 million person stays in 2011, which seems reasonable given the 8% decline in golf participation.
For average trip spending, TEConomy used the D.K. Shifflet data. The survey data showed strong growth in trip
spending since 2011. Once slight difference in the data is that the 2011 average trip spending data is for all types
of trips, whereas 2016 average trip spending data is from people who responded to the D.K. Shifflet survey that
they had played golf while on a trip. Average spending on day trips was $74.44, up from $46.32 in 2011. Average
trip spending on overnight trips was $350.26, up from $252.00 in 2011.
Calculating the number of golf trips by average spending yields $25.724 billion in golf-related tourism
expenditures in 2016, up from $20.555 billion in 2011, representing a 25.1% increase or 4.6% CAGR. This is similar
to the 20.6% growth during the same time period for U.S. travel and tourism expenditures overall, according to
the U.S. Travel Association. 13
13 U.S. Travel Association (2017). U.S. Travel and Tourism Overview 2016.
222016 U.S. Golf Economy Report
Economic Impact
Economic impact analysis is an effective method of modeling how growth or decline of a target industry sector
contributes to changes in the overall level of economic activity in a regional (local, state, or national) economy. In
the case of the golf industry, the analysis focuses on the impact of each of the six core and enabled golf industry
segments defined by the WGF’s golf industry framework and estimated by TEConomy. Economic impact analysis
measures three major pathways by which growth or decline of an industry sector impacts the level of overall
economic activity in a state:
• Direct effects: The direct employment and economic activity stemming from the core and enabled golf
industry segments’ operations and expenditures.
• Indirect effects: The demand generated for supplier firms by the six golf industry segments.
• Induced effects: The additional economic activity generated by the spending of the golf industry’s and
related supplier firms’ employees in the overall economy.
The sum of these three effects is referred to as the total impact. The conceptual framework for thinking about
how a dollar of investment is re-spent multiple times throughout the economy as it passes from business to
business, or business to employee, is known as the “multiplier effect.” The result of the multiplier effect is that
one dollar of expenditure or investment ends up having a total economic impact that is a few multiples higher
than the original dollar.
Multiplier effects are larger when the initial investment spurs follow-on investment, when the consumption
component, including purchases from suppliers, is higher, and when the spending occurs locally. To calculate
economic impact, TEConomy used the U.S. Bureau of Economic Analysis Regional Input-Output Modeling System
(RIMS) II multipliers to estimate the golf industry’s total economic impact on the state economy. RIMS II calculates
the indirect and induced effects stemming from the direct economic activity.
Most, but not all, of the U.S.’s total golf economy expenditures are considered in the total economic impact
calculation. Table 13 presents the total economic impacts stemming from the direct effect of each of the six golf
industry segments. Only the margin on total retail sales of golf-related supplies and golf tourism retail (e.g.,
shopping for gifts/souvenirs and gasoline purchases) expenditures are included. The capital investment in existing
golf facilities portion of golf course capital investment is not included to avoid double counting, because it is
assumed to be financed through golf facility operation revenue. The realized golf premium on the sale of existing
golf homes is not included, because the sale of existing homes is considered a transfer of assets. Finally, money
raised through golf charitable golf events is not included, because it is considered a transfer of income.
232016 U.S. Golf Economy Report
Table 13. U.S. Golf’s Total Economic Impact in 2016
by Industry Segment ($M)
Total Output Compensation
Employment
($M) ($M)
CORE INDUSTRIES
Golf Facility Operations $94,094 1,016,787 $27,813
Golf Course Construction $604 4,040 $191
Golf-Related Supplies $6,435 60,891 $2,021
Tournaments, Associations, and
$6,568 64,846 $2,645
Player Endorsements
Total Core Industries $107,701 1,146,565 $32,670
ENABLED INDUSTRIES
Golf Residential Construction $21,058 140,759 $6,670
Golf Tourism $63,151 598,349 $19,325
Total Enabled Industries $84,209 739,109 $25,995
TOTAL $191,911 1,885,674 $58,665
Source: TEConomy Partners, LLC analysis using the U.S. Bureau of Economic Analysis Regional Input-Output Modeling System II.
Note: The economic impact analysis calculates total impact on the margin of retail sales for both the Golf-Related Supplies and Tourism
estimates, and on only the new golf course construction and new golf residential construction portions of Golf Course Capital Investment
and Golf Real Estate. Golf charitable giving is also excluded from the impact analysis, because it is considered a transfer of income.
TEConomy constructed a U.S. multiplier using RIMS II multipliers for of the 48 contiguous states and the District of Columbia.
242016 U.S. Golf Economy Report
References
Digital Entertainment Group (2017). 2016 U.S. Home Entertainment Report. Los Angeles, CA: Digital Entertainment
Group.
D.K. Shifflet & Associates (2017). 2016 U.S. Travel Data. PERFORMANCE/MonitorSM Travel Intelligence SystemSM.
McLean, VA: D.K. Shifflet & Associates.
Ernst & Young (2011). The Australian Golf Industry Economic Report 2010. Melbourne: Ernst & Young.
Golf Course Builders Association of America (2011). Guide to Estimating Cost for Golf Course Construction. Lincoln,
NE: Golf Course Builders Association of America.
Golf Course Superintendents Association of America (2016). 2015 Compensation Survey. Lawrence, KS: Golf
Course Superintendents Association of America.
Golf Course Superintendents Association of America (2012). 2011 Compensation Survey. Lawrence, KS: Golf
Course Superintendents Association of America.
Indap, Sujeet (2016). “Topgolf targets expansion beyond the green,” The Financial Times. 9 March 2016.
IBISWorld (2017). Industry Report 45121: Book Stores in the U.S. Los Angeles, CA: IBISWorld.
Ladies Professional Golfers Association (2017). 2016 Season Recap. Daytona Beach, FL: Ladies Professional Golfers
Association.
National Association of Home Builders (2017). Construction Costs Survey, 2016. Washington, DC: National
Association of Home Builders.
National Association of Realtors (2017). Existing Home Sales 2016. Washington, DC: National Association of
Realtors.
National Golf Foundation (2017). The Charitable Impact Report. Jupiter, FL: National Golf Foundation.
National Golf Foundation (2011). The Charitable Impact Report. Jupiter, FL: National Golf Foundation.
252016 U.S. Golf Economy Report
National Golf Foundation (20012-2017). Golf Facilities in the U.S., 2012-2017 editions. Jupiter, FL: The National
Golf Foundation.
National Golf Foundation (2017). Golf Participation in the U.S., 2017 edition. Jupiter, FL: The National Golf
Foundation.
National Sporting Goods Association (2017). The Sporting Goods Market, 2017 edition. Mt. Prospect, IL: National
Sporting Goods Association.
The Professional Golfers Association of America (2016). 2015 Operations Survey. Palm Beach Gardens, FL: The
Professional Golfers Association of America.
The Professional Golfers Association of America (2017). 2016 Compensation Survey. Palm Beach Gardens, FL: The
Professional Golfers Association of America.
The Professional Golfers Association of America (2017). Combined Financial Statements: June 30, 2017 and 2016.
Palm Beach Gardens, FL: The Professional Golfers Association of America.
PGA TOUR (2017). 2016-2017 PGA TOUR Annual Report. Ponte Vedra Beach, FL: PGA TOUR.
Silber, Tony (2016). B2C Revenue Sources in 2014 in “The Untold Story of How Magazine Media is Winning,” Folio
Magazine. 1 March 2016. Accessed November 18, 2017. http://www.foliomag.com/untold-story-magazine-
media-winning/
SRI International (2002). The Golf Economy Report. Arlington, VA: SRI International.
SRI International (2007). The 2005 Golf Economy Report. Arlington, VA: SRI International.
SRI International (2013). The 2011 Golf Economy Report. Arlington, VA: SRI International.
Topgolf (2017). Fact Sheets 2016. Accessed 18 September 2017. http://press.topgolf.com/fact-sheets
United States Golf Association (2017). Financial Statements: Years Ended November 30, 2016 and 2015. Fars Hill,
NJ: United States Golf Association.
U.S. Bureau of Economic Analysis (2017). Regional Input-Output Multiplier System II. Washington, DC: U.S.
Department of Commerce.
262016 U.S. Golf Economy Report
U.S. Census Bureau (2017). Census of Population and Housing. Washington, DC: U.S. Department of Commerce.
U.S. Census Bureau (2017). Construction Reports, Series C-20, Housing Starts. Prepared by National Association of
Home Builders Economics Department. Washington, DC: U.S. Department of Commerce.
U.S. Census Bureau (2015). 2012 Economic Census: Arts, Entertainment, and Recreation: Geographic Series.
Washington, DC: U.S. Department of Commerce.
U.S. Census Bureau (2010). 2007 Economic Census: Arts, Entertainment, and Recreation (NAICS 71): Geographic
Series. Washington, DC: U.S. Department of Commerce.
U.S. Census Bureau (2015). 2002 Economic Census: Arts, Entertainment, and Recreation (NAICS 71): Geographic
Series. Washington, DC: U.S. Department of Commerce.
U.S. Census Bureau (2017). Estimated Annual Gross Margin as a Percentage of Sales of U.S. Retail Firms by Kind of
Business: 1993 Through 2016. Washington, DC: U.S. Department of Commerce.
27You can also read