Methodological proposal for the redistribution of deaths due to garbage codes in mortality estimates for Noncommunicable Chronic Diseases
←
→
Page content transcription
If your browser does not render page correctly, please read the page content below
https://doi.org/10.1590/1980-549720210004.supl.1

     ORIGINAL ARTICLE / ARTIGO ORIGINAL

Methodological proposal for the redistribution of
deaths due to garbage codes in mortality estimates
for Noncommunicable Chronic Diseases
Proposta metodológica para redistribuição de óbitos por causas garbage
nas estimativas de mortalidade para doenças crônicas não transmissíveis
Renato Azeredo TeixeiraI , Lenice Harumi IshitaniII , Fátima MarinhoIII ,
Elzo Pereira Pinto JuniorIV , Srinivasa Vittal KatikireddiV , Deborah Carvalho MaltaI

      ABSTRACT: Objective: To propose a method for improving mortality estimates from noncommunicable
      diseases (NCD), including the redistribution of garbage codes in Brazilian municipalities. Methods: Brazilian
      Mortality Information System (MIS) was used as a data source to estimate age standardized mortality
      rates, before and after correction, for NCD (cardiovascular, chronic respiratory, diabetes, and neoplasms).
      The treatment for the correction of data addressed missing data, under-registration, and redistribution of
      garbage codes (GCs). Three-year periods 2010–2012 and 2015–2017, and the Bayesian method were used to
      estimate mortality rates, reducing the effect of fluctuation caused by small numbers at the municipal level.
      Results: GCs redistribution step showed greater weight in corrections, about 40% in 2000 and roughly 20% as
      from 2007, with stabilization starting in this year. Throughout the historical series, the quality of information
      on causes of death has improved in Brazil, with heterogeneous results being observed among municipalities.
      Conclusion: Methodological studies that propose correction and improvement of the MIS are essential for
      monitoring mortality rates due to NCD at regional levels. The methodological proposal applied, for the first
      time in real data from Brazilian municipalities, is challenging and deserves further improvements. Improving
      the quality of the data is essential in order to build more accurate estimates based on the raw data from the SIM.
      Keywords: Noncommunicable diseases. Data accuracy. Cause of death. Small-area analysis.

I
 Postgraduate Program in Public Health, School of Medicine, Universidade Federal de Minas Gerais – Belo Horizonte (MG), Brazil.
II
  Research Group on Epidemiology and Health Evaluation, Universidade Federal de Minas Gerais – Belo Horizonte (MG), Brazil.
III
   Institute of Advanced Studies, Universidade de São Paulo – São Paulo (SP), Brazil.
IV
    Institute of Collective Health, Universidade Federal da Bahia – Salvador (BA), Brazil.
V
  Public Health Social & Public Health Sciences Unit, University of Glasgow – Glasgow, United Kingdom.
Corresponding author: Renato Azeredo Teixeira. School of Medicine, Universidade Federal de Minas Gerais. Avenida Alfredo
Balena, 190, sala 731, Santa Efigênia, CEP: 30130-100, Belo Horizonte, MG, Brasil. E-mail: renato115@yahoo.com
Conflict of interests: Nothing to declare – Financial support: Small Areas Project, Health Surveillance Secretariat, Ministry of
Health (TED 148-2018), and National Institute for Health Research (NIHR) (GHRG / 16/137/99) with the UK government.

                                                            1
                                       REV BRAS EPIDEMIOL 2021; 24: E210004.SUPL.1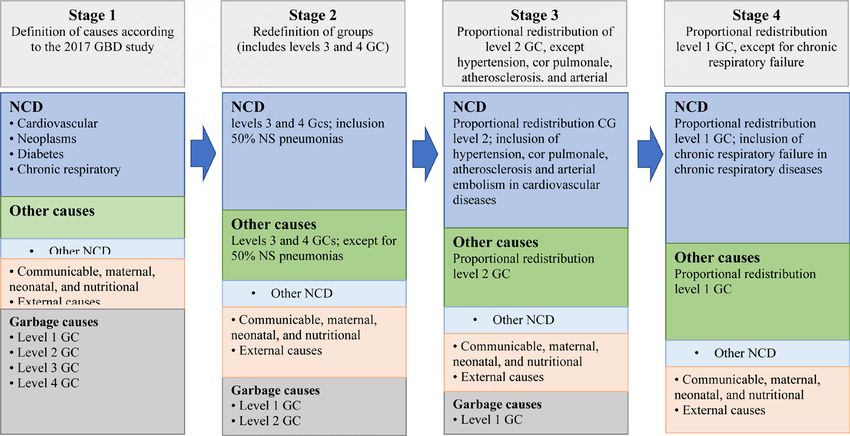
TEIXEIRA, R.A. ET AL.

RESUMO: Objetivo: Propor método para melhoria das estimativas de mortalidade por doenças crônicas não
transmissíveis, incluindo a redistribuição de causas garbage nos municípios brasileiros. Métodos: O Sistema de
Informações sobre Mortalidade foi utilizado como fonte de dados para estimar as taxas padronizadas por idade,
antes e depois da correção de dados, para as doenças crônicas não transmissíveis (cardiovasculares, respiratórias
crônicas, diabetes e neoplasias). O tratamento para correção dos dados abordou dados faltantes, sub-registro e
redistribuição de causas garbage. Foram utilizados os triênios 2010–2012 e 2015–2017 e o método bayesiano para
estimar as taxas de mortalidade, diminuindo-se o efeito da flutuação provocada pelos pequenos números no nível
municipal. Resultados: A etapa de redistribuição causas garbage mostrou maior peso nas correções: cerca de 40%
em 2000 e aproximadamente 20% a partir de 2007, com estabilização neste ano. Ao longo da série histórica, a
qualidade da informação sobre causas de morte melhorou no Brasil, sendo vistos resultados heterogêneos nos
municípios. Observaram-se clusters com as maiores proporções de correção nas regiões Nordeste e Norte. O diabetes
foi a causa com maior proporção de acréscimo (mais de 40%, em 2000). Conclusão: Estudos metodológicos que
propõem correção e melhoria do Sistema de Informação sobre Mortalidade são essenciais para o monitoramento
das taxas de mortalidade por doenças crônicas não transmissíveis em níveis regionais. A proposta metodológica
aplicada, pela primeira vez em dados reais de municípios brasileiros, é desafiadora e merece aprimoramentos.
Apesar da melhora nos dados, o método utilizado neste estudo para tratamento dos dados brutos mostrou grande
impacto nas estimativas finais.
Palavras-chave: Doenças não transmissíveis. Confiabilidade dos dados. Causas de morte. Análise de pequenas áreas.

INTRODUCTION
    Noncommunicable diseases (NCD) are responsible for approximately 40 million annual
deaths worldwide, and the vast majority occur in low and middle income countries, largely
affecting premature mortality, under 70 years of age.1 Despite the decrease in standard-
ized mortality rates, the scenario in Brazil is no different from that observed in the rest of
the world, and NCD represent about 75% of total deaths that occurred in the country.2,3
Because of the magnitude of NCD, target 3.4, regarding health and well-being, was included
in the Sustainable Development Goals (SDG) in 2015, to be achieved by 2030: to reduce
premature mortality from NCD (diabetes, cardiovascular diseases, respiratory diseases, and
neoplasms), with prevention and treatment, and foster mental health.4 Therefore, monitor-
ing these causes of death is essential.
    For tracking NCD, continuous follow-up with epidemiological surveys and health infor-
mation systems for variables such as risk factors, morbidity, and social determinants is rec-
ommended. Vital statistics on causes of death are essential for the epidemiological knowl-
edge of the population’s health situation and, especially, for tracking NCD. Information
generated from such data serves as a subsidy for public management through analyzes for
health planning, monitoring, and evaluation.

                                                            2
                                      REV BRAS EPIDEMIOL 2021; 24: E210004.SUPL.1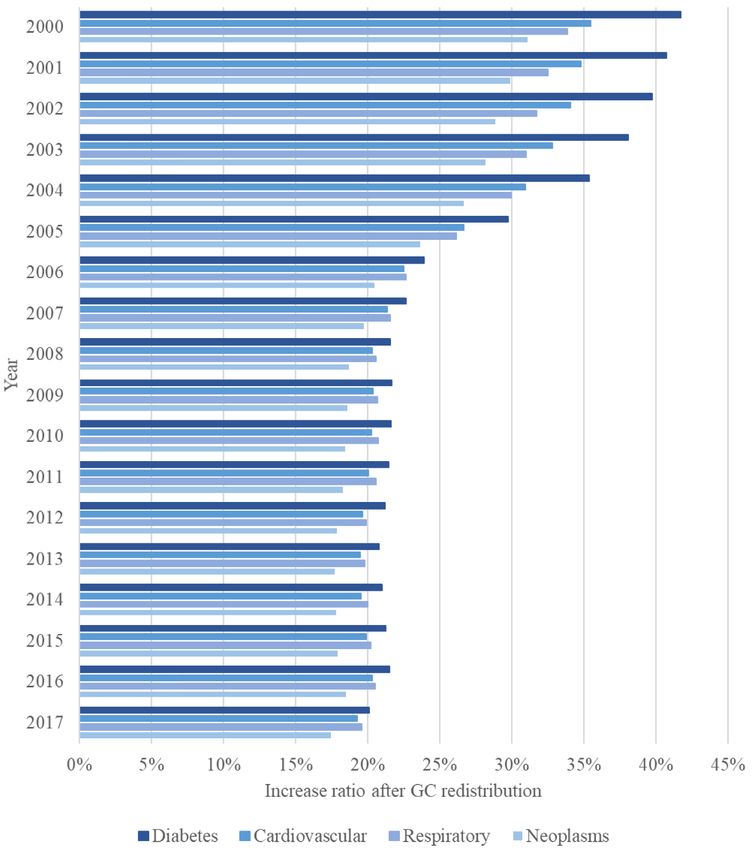
METHODOLOGICAL PROPOSAL FOR THE REDISTRIBUTION OF GCS FOR NCD

    Even though they are aware of the relevance of these data, few low- and middle-income
countries have mortality systems with desirable coverage and quality, which are essential
characteristics to generate information reliability.5
    In Brazil, Mortality Information System (MIS) is responsible for capturing, storing,
and making this data available in the country. Created in 1975 by the Brazilian Ministry
of Health, despite being considered a consolidated system, MIS has heterogeneous char-
acteristics with regard to the quality of its data, especially in the analysis of coverage
indicators and causes of death. Thus, usual indicators of underreporting of deaths and
the high ratio of ill-defined causes and garbage codes present different scenarios in the
regions and states of Brazil, in addition to differences according to socioeconomic and
demographic levels.6-8
    Death is the result of a chain of events that must be considered in their logical sequence.
However, for public health mortality statistics, a death is represented by a cause of death,
which must be defined by the cause that started the chain of events, called the basic cause.
The declaration of the basic cause in a death certificate (DC) must be made by a physician,
a technically qualified professional and capable of giving accuracy to the definition of the
cause that culminated in death. Analyzes on mortality are conducted in countries based on
this declaration.
    For this reason, the concern with the quality of information on the cause of death
is a widely discussed issue. In this sense, new definitions of non-specific causes of death
have been addressed.9 Garbage causes (GCs) represent a group of nonspecific causes
with no relevance to public health, since identifying actions for prevention or control is
not feasible.10
    In addition to chapter 18 of the tenth revision of the International Statistical Classification
of Diseases and Related Health Problems (ICD-10), all other chapters have codes considered
to be GCs. An example are deaths from malignant neoplasms without a specified location
(C80), which is not considered a basic cause of death, as the disease that started the chain
of events culminating in death is not defined.
    Due to the limitations of mortality databases in the country, in order to obtain estimates
for more precise causes, correcting the underreporting of deaths, as well as the redistribution
of GCs, is recommended to be done in a regionalized manner and over time.11,12 There are
methodological proposals for working with these causes, including the proportional redis-
tribution of ill-defined causes (IDC) or the total of GCs.11-13 In the Global Burden of Disease
(GBD) study, this step is fundamental for the treatment of the causes of death and uses
weights generated by statistical models and redistributed by algorithms among the group
of defined causes (target) as a basis.14
    Since there are no analyzes that consider correction methods for mortality data at
municipal levels, the present study aimed to propose a method for improving the esti-
mates of causes of death from NCD, including the redistribution of GCs in Brazilian
municipalites, which will support the country’s effort to monitor the targets of reduc-
ing such diseases.

                                                      3
                                 REV BRAS EPIDEMIOL 2021; 24: E210004.SUPL.1
TEIXEIRA, R.A. ET AL.
METHODS
DATABASE
Open data from MIS between 2000 and 2017 were used, which do not contain personal
information, making it feasible to prepare studies without the need for approval by the
Research Ethics Committee Involving Human Beings.
DATABASE TREATMENT
In order to standardize and improve the accuracy of mortality data, the correction
method for the suggested MIS data was carried out in steps.
Step 1: Redistribution of missing data
Despite the completeness of MIS being currently considered adequate,15 it varies among
municipalities over a longer period and at the municipal level. Thus, a proportional redistri-
bution between deaths was made with information on the following missing or incomplete
variables: municipality of residence, age, and sex. Deaths without information as to munic-
ipality of residence contained information from their Federative Unit (FU).
Step 2: Correction of MIS underreporting
State correction coefficients of the 2017 GBD study were used, according to age and sex.
Each municipality was corrected for its respective state coefficient, which was applied only in
those municipalities with a general mortality rate of less than five deaths per 1,000 inhabitants.2
Step 3: Redistribution of GCs
Definitions of the groups of causes followed the list of the 2017 GBD study.14 GBD clas-
sification considers three major groups of diseases:
• NCD;
• communicable, maternal, neonatal, and nutritional diseases;
• external causes.
All groups are hierarchical and can be broken down to level 4. The classification of GCs
is conceptually divided into four levels. Level 1 considers GCs to be redistributed among
4
REV BRAS EPIDEMIOL 2021; 24: E210004.SUPL.1METHODOLOGICAL PROPOSAL FOR THE REDISTRIBUTION OF GCS FOR NCD
any of the three major groups of GBD causes, such as septicemia, which may be due to an
accident or even pneumonia. Accordingly, level 2 GCs can be redistributed at most to a level
2 group, such as unspecified gastrointestinal tract hemorrhage, which must be redistributed
in the group of NCD. On the other hand, level 3 GCs refer to causes such as unspecified
cancer, which will be attributed to cancer and will be redistributed to the level 3 group of
specific causes of cancer. Finally, level 4 GCs refer to a defined level 4 cause, such as unspec-
ified stroke, which can be redistributed into ischemic or hemorrhagic, and diabetes, which
can be redistributed as type 1 or 2 diabetes.
The process of redistributing GCs followed the concept of GCs levels. An analysis of the
codes was carried out to identify which are the GCs specifically related to NCD (diabetes,
cardiovascular diseases, chronic respiratory diseases, and neoplasms) and the other specific
causes. This process consisted of four steps, as detailed in Figure 1.
Step 3.1: Definition of codes among groups studied
In this stage, deaths whose basic causes were specified codes of the ICD-10 and defined
by the 2017 GBD study were identified, considered as the target causes, for which GCs
will be redistributed. The present study had NCD as its focus, composed of the four
major groups of causes, as used in the target 3.4 of the SDGs,4 as previously mentioned.
The analyzes considered the four groups of causes together and separately. However, no
detailed breakdown for the subgroups in the considered causes was adopted. The other
causes were grouped into other NCD, transmissible, maternal, neonatal and nutritional,
and external causes.
GCs: garbage causes; NCD: noncommunicable diseases; GBD: Global Burden Disease; NS: not specified.
Figure 1. Flowchart of the redistribution of GCs to NCD.
5
REV BRAS EPIDEMIOL 2021; 24: E210004.SUPL.1TEIXEIRA, R.A. ET AL.
Step 3.2: Redefinition of the groups of causes with the inclusion of levels 3 and 4 GCs
As these are codes with more specific information on the causes of death, CGs deaths
from levels 3 and 4 were included in the large groups defined in step 3.1. For example, malig-
nant neoplasm without specifying the location, a level 3 GC, was classified as a neoplasm in
the study. This cause does not define the location of the primary tumor, hiding the real basic
cause of death, and, according to the GBD study, it is redistributed to different specific types
of cancers, such as breast, liver, prostate, among others. The same process was considered
for the other levels 3 and 4 GCs that were classified as one of the other three major groups
of causes of the analysis, except for unspecified pneumonias, of which 50% were redistrib-
uted into NCD, and 50%, into transmissible, maternal, neonatal, and nutritional causes.
Step 3.3: Redistribution of level 2 GCs
In this step, level 2 GCs were redistributed proportionally to the target cause groups,
defined in step 3.1. The exceptions to this step were hypertension (I10 and I15), cor pulmo-
nale (I27), atherosclerosis (I70), and arterial embolism (I74), which were classified as car-
diovascular diseases.
Step 3.4: Redistribution of level 1 GCs
At this stage, level 1 GCs were redistributed proportionally among the groups of causes
studied, with the exception of chronic respiratory failure ( J96.1), included in the group of
chronic respiratory patients. This step includes ill-defined causes (chapter 18 of ICD-10).
The list of GCs selected for each group is found in Appendix 1, as well as the exceptions
in relation to the GC classification levels.
DATABASE TREATMENT: GEOGRAPHIC LEVEL OF ANALYSIS
The geographical unit considered for the study was municipalities, aiming to contem-
plate local characteristics for data correction.
In order to smooth the estimates of mortality rates for small areas, the analyzes of rate
distributions were based on the local empirical Bayesian estimator (EBS),16-19 which con-
siders the neighborhood structure to estimate municipal rates. In addition, the analysis by
municipalities evaluated the three-year periods from 2010 to 2012 and 2015 to 2017. All rates
considered in the study, both those that used raw data and those that used corrected data,
were standardized by age.
RESULTS
Figures 2A, 2B, and 2C show the proportional increase in the number of deaths after
data treatment according to the correction steps, missing data, under-registration, and
6
REV BRAS EPIDEMIOL 2021; 24: E210004.SUPL.1METHODOLOGICAL PROPOSAL FOR THE REDISTRIBUTION OF GCS FOR NCD
40%
30%
Increase ratio
20%
10%
0%
2000 2001 2002 2003 2004 2005 2006 2007 2008 2009 2010 2011 2012 2013 2014 2015 2016 2017
Year
A Missing data Under-reporting Redistribuiton of GCs
0,5%
0,4%
Increase ratio
0,3%
0,2%
0,1%
0,0%
2000 2001 2002 2003 2004 2005 2006 2007 2008 2009 2010 2011 2012 2013 2014 2015 2016 2017
Year
B Missing data
3%
2%
Increase ratio
1%
0%
2000 2001 2002 2003 2004 2005 2006 2007 2008 2009 2010 2011 2012 2013 2014 2015 2016 2017
Year
C Under-reporting
GCs: garbage causes
Figure 2. Historical series of the proportional variation in the number of deaths after treatment,
according to stages of redistribution of missing data, correction of under-registration and
redistribution of GCs in deaths from chronic diseases. Brazil, 2000 to 2017.
redistribution of GCs in comparison with the total gross deaths from NCD in Brazil, from
2000 to 2017. The country has significantly improved as to the quality of mortality data over
the years, since the ratio decreases over time in all stages. In addition, redistribution of GCs
is the stage in which there was a greater increase in mortality after data treatment. A stabi-
lization of 19% from 2007 onwards could be observed, for this correction stage.
7
REV BRAS EPIDEMIOL 2021; 24: E210004.SUPL.1TEIXEIRA, R.A. ET AL.
Diabetes was the cause with the highest increase ratio (more than 40% in 2000).
Respiratory diseases became the second most corrected cause in 2006, surpassing cardio-
vascular diseases. Neoplasms present the smallest corrections in the entire period (Figure 3).
GCs: garbage causes
Figure 3. Increase ratio of the number of deaths after total treatment of data on deaths
from diabetes, cardiovascular diseases, chronic respiratory diseases, and neoplasms.
Brazil, 2000 to 2017.
8
REV BRAS EPIDEMIOL 2021; 24: E210004.SUPL.1METHODOLOGICAL PROPOSAL FOR THE REDISTRIBUTION OF GCS FOR NCD
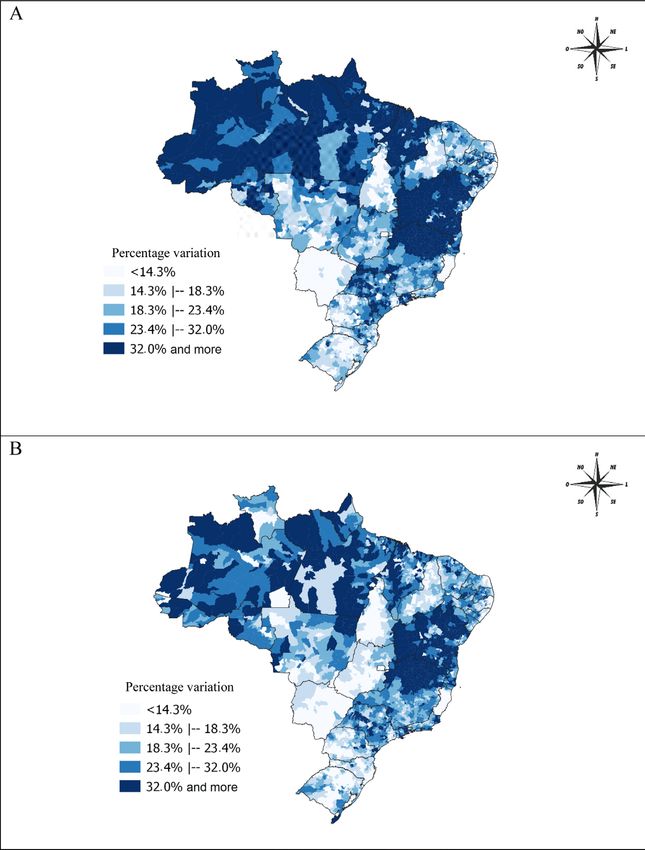
Spatial distribution of the percentage changes in mortality rates with corrected and
uncorrected data, according to three-year periods, is shown in Figure 4. In general, there
is a clearing on the map for the most recent period, 2015 to 2017, which shows a decrease
in variation. There are clusters with the highest ratios in the Northeastern and Northern
regions. High correction is also seen in the Northern region of Minas Gerais State.
NCD: noncommunicable diseases.
Figure 4. Maps of percentage variations in mortality rates due to NCD standardized with raw data
and corrected data in municipalities. Brazil, (A) 2010 to 2012, (B) 2015 to 2017.
9
REV BRAS EPIDEMIOL 2021; 24: E210004.SUPL.1TEIXEIRA, R.A. ET AL.
DISCUSSION
In the present study, the impact on the final estimates of mortality due to NCD was
demonstrated after the application of a methodology for the redistribution of GCs in
Brazilian data. NCD are the leading causes of death in the world and in Brazil,20,21 account-
ing for roughly two-thirds of total deaths. The inclusion of the target to reduce premature
deaths from NCD by 30% by 2030, set in the 2030 Agenda of the United Nations, results in
an important priority for monitoring these causes at more disaggregated levels, seeking to
identify inequalities and act to correct these inequities.4,22,23 Therefore, methodological stud-
ies that propose the correction and improvement of the MIS become essential for tracking
mortality rates at different geographic levels.
The appropriate methodology for analyzing small areas, which includes Bayesian meth-
ods and the use of triennial periods, allows using data at more disaggregated geographic
levels. This is opportune, as it considers information about the local reality. Therefore, min-
imizing differences in the quality of data generated by death information systems in small
areas and over time is feasible, thus allowing the obtention of more accurate estimates.
Although the quality of mortality data has been improved in the country, the present
study shows the importance of comparing rates before and after data correction. Caution in
the use of mortality estimates from direct methods with raw data is of utmost importance,
since proportional increases of more than 20% were found in estimates comparison before
and after the correction of NCD.
Data analyzed herein pointed to an improvement in the quality of mortality data in
Brazilian municipalities over the last decade, evidenced by the reduction in percentage
variations between mortality rates, with the use of raw and corrected data (missing data,
under-registration and redistribution of GCs). These advances were the result of efforts
by the Brazilian Ministry of Health in partnership with federative units and municipal-
ities to better track deaths through MIS, such as the project to reduce ill-defined causes
in 2005 and the project to reduce regional inequalities and infant mortality in the states
of the Northeastern Region and the Legal Amazon.24-28 The proactive search of deaths
project is highlighted, which made it possible to define methodologies for redistributing
underreported deaths.29,30 This commitment, together with the corrections, was essen-
tial for the most adequate interpretation and comparability of the historical series in the
different regions of the country.
In the analysis of the increase in rates after correction according to NCD causes, diabe-
tes showed the highest correction ratio, reaching more than 40% in the year 2000, perhaps
because many deaths were originally declared as unspecified diabetes (level 4-GC). On the
other hand, since these are diseases that require specialized and highly complex care after
diagnosis, neoplasms had the smallest increase in rates after correction.
Despite the improvement in the quality of the data,31 large regional increases were still
observed in mortality rates estimates from NCD after corrections. In addition to the impor-
tance of continuously searching to improve the quality of information, in order to obtain
10
REV BRAS EPIDEMIOL 2021; 24: E210004.SUPL.1METHODOLOGICAL PROPOSAL FOR THE REDISTRIBUTION OF GCS FOR NCD
more accurate estimates, less quality in filling out the causes of death in the death certifi-
cate may signal less access to health services and the quality of medical care.5,32
The accuracy of mortality data is essential, since they serve to support the planning of
health actions, the monitoring of disease trends, the evaluation of public policies, the iden-
tification of the most vulnerable populations, among others.
GCs are a relevant indicator for assessing the quality of the death information system,
since high ratios can impair analyzes, especially when it comes to more stratified analyzes,
such as specific causes, according to age and sex or in small areas. The analysis of time series
must be conducted carefully especially when using raw data, seen that quality can vary over
time, as pointed out in the present study, with progressive improvement of the MIS and
consequent reduction of GCs, under-registration of deaths, etc.
The proportional distribution of ill-defined causes (chapter 18 of ICD-10) is used in sev-
eral mortality studies.12,33,34 Other, more robust methods are available and provide better
estimates. Reclassification of deaths based on death investigations, for example, is a widely
used strategy.8,35 With this methodology, obtaining more accurate information about the
individual’s cause of death is possible, because it uses information from medical records,
cross-checking data from different sources and including home interviews with close rel-
atives. Despite being considered a great strategy, death investigations require high invest-
ment for good results to be obtained.
Despite that, as well as the method proposed in this study, there are other methodological
ways to treat GCs in mortality data without making local investigations. The GBD study pro-
poses the redistribution of this group of causes in a robust manner, with an analytical method-
ology based on standardized algorithms for all regions studied. Its main step is the redistribution
of GCs, considering redistribution weights generated according to sex, age, and specific cause
in each of the locations studied.8,35 Other approaches aim to recover inaccurate information
with simpler redistributions, in a proportional way, as is the case of R99 – other ill-defined and
unspecified causes of mortality, and redistributions with the use of machine learning techniques,
which have regression models, multiple cause redistribution techniques, among others.10,36
Estimates generated by the GBD study have been used by researchers around the world.
However, replicating this methodology is hampered by the absence of structure, compu-
tational and human resources, and knowledge generated by the group of the Institute of
Metrics and Health Assessment. For this reason, looking for alternative methods applicable
in the local context is important.
The applied methodology represents an advance in relation to the redistribution of ill-de-
fined causes in a pro rata way in the treatment of raw data to improve the quality of vital
statistics, but it is still not enough. Among the study limits, under-registration of deaths
due to the use of secondary bases is pointed out, as well as the validation of this correc-
tion without field research, making it exceedingly difficult to obtain real local information.
The definition of the basic cause of death is extremely important information, registered
by mortality systems. Therefore, the ideal would be filling out the death certificate with
well-defined causes, by the corresponding doctors.
11
REV BRAS EPIDEMIOL 2021; 24: E210004.SUPL.1TEIXEIRA, R.A. ET AL.
Another important limitation population estimates in the country may be subject to
errors, in addition to the difficulties of working with numerators, that is, deaths, for small
areas. However robust the demographic methods applied in population estimates are, dis-
tance from the last census makes validations more complex, since a series of assumptions
must be made based on the distance in-between two censuses.
The methodological proposal applied, for the first time in real data from Brazilian
municipalities, is challenging and subject to improvement. Comparisons with other
proposals should be encouraged and tested. The application of GBD correction meth-
ods at the municipal level, the redistribution of ill-defined causes, and the analysis of
investigations of deaths from GCs deserve further analysis so that the knowledge of
several proposals can lead to the best final estimate of the country’s vital statistics at
the level of small areas.
Finally, the results of the present study highlight the importance of redistributing GCs,
especially those related to NCD, to obtain more accurate estimates of the risk of death
in the country. NCD are a global priority and are included in the SDGs. Thus, in order to
achieve the United Nations motto “Leave No One Behind (LNOB)”, investing in quality of
data and advance in estimates that allow correction and analysis in municipalities and other
smaller geographic areas is essential, because there are still large inequalities, difficulty in
accessing services, and high mortality rates in these places.
By proposing a methodology based on local information, with empirical data, in a rep-
licable way and tested at the municipal level, the present study proved to be an important
management tool. Although the development of this methodology represents an advance
in the use of mortality data in the country, efforts to universalize death records and improve
the definition of causes of deaths must continue progressing. Improving the quality of mor-
tality data is essential so that, in the future, building more accurate estimates based on the
original MIS data is possible.
ACKNOWLEDGMENTS
The authors would like to thank Professor Elisabeth França, from the Postgraduate Program
in Public Health at the Faculty of Medicine, for her guidance and support in the study.
REFERENCES
1. World Health Organization: Global status report on 3. Malta DC, França E, Abreu DMX, Perillo RD,
noncommunicable diseases 2010. Genebra: World Salmen MC, Teixeira RA, et al. Mortality due to
Health Organization; 2011. noncommunicable diseases in Brazil, 1990 to 2015,
2. Abouzahr C, Mikkelsen L, Rampatige R, Lopez A. according to estimates from the global burden of
Mortality statistics: a tool to improve understanding disease study. Sao Paulo Med J 2017; 135(3): 213-21.
and quality. Health Information Systems; 2010. https://doi.org/10.1590/1516-3180.2016.0330050117
12
REV BRAS EPIDEMIOL 2021; 24: E210004.SUPL.1METHODOLOGICAL PROPOSAL FOR THE REDISTRIBUTION OF GCS FOR NCD
4. United Nations. Transforming Our World: the 2030 territories, 1980–2017: a systematic analysis for
Agenda for Sustainable Development. A/RES/70/1. the Global Burden of Disease Study 2017. Lancet
United Nations; 2015. 2018; 392(10159): 1736-88. https://doi.org/10.1016/
5. Mathers CD, Fat DM, Inoue M, Rao C, Lopez AD. s0140-6736(18)32203-7
Counting the dead and what they died from: An 15. Romero DE, Maia L, Muzy J. Tendência e desigualdade
assessment of the global status of cause of death data. na completude da informação sobre raça/cor dos
Bull World Health Organ 2005; 83(3): 171-7. óbitos de idosos no Sistema de Informações sobre
6. Szwarcwald CL, Leal M do C, Andrade CLT de, Mortalidade no Brasil, entre 2000 e 2015. Cad
Souza Jr. PRB de. Estimação da mortalidade infantil Saúde Pública 2019; 35(12): e00223218. https://doi.
no Brasil: o que dizem as informações sobre óbitos org/10.1590/0102-311x00223218.
e nascimentos do Ministério da Saúde? Cad Saúde 16. Assunção RM, Barreto SM, Guerra HL, Sakurai E.
Pública 2002; 18(6): 1725-36. https://doi.org/10.1590/ Mapas de taxas epidemiológicas: uma abordagem
S0102-311X2002000600027 Bayesiana. Cad Saúde Pública 1998; 14(4): 713-23.
7. França E, de Abreu DX, Rao C, Lopez AD. Evaluation https://doi.org/10.1590/S0102-311X1998000400013
of cause-of-death statistics for Brazil, 2002-2004. 17. Carvalho AXY, Silva GDM, Almeida Júnior GR,
Int J Epidemiol 2008; 37(4): 891-901. https://doi. Albuquerque PHM. Taxas bayesianas para o
org/10.1093/ije/dyn121 mapeamento de homicídios nos municípios brasileiros.
8. Campos D, França E, Loschi RH, Souza M de FM de. Cad Saúde Pública 2012; 28(7): 1249-1262. https://doi.
Uso da autópsia verbal na investigação de óbitos com org/10.1590/S0102-311X2012000700004
causa mal definida em Minas Gerais, Brasil. Cad Saúde 18. Justino JR, Freire FHM de A, Lucio PS. Estimação de
Pública 2010; 26(6): 1221-33. https://doi.org/10.1590/ sub-registros de óbitos em pequenas áreas com os
S0102-311X2010000600015 métodos bayesiano empírico e algoritmo EM. Rev
9. Naghavi M, Richards N, Chowdhury H, Eynstone- Bras Est Popul 2012; 29(1): 87-100.
Hinkins J, Franca E, Hegnauer M, et al. Improving 19. Marshall RJ. Mapping Disease and Mortality Rates
the quality of cause of death data for public health Using Empirical Bayes Estimators. J R Stat Soc Ser C
policy: Are all “garbage” codes equally problematic? Appl Stat 1991; 40(2): 283-94.
BMC Med 2020; 18(1): 55. https://doi.org/10.1186/ 20. World Health Organization. Global action plan for
s12916-020-01525-w the prevention and control of noncommunicable
10. Naghavi M, Makela S, Foreman K, O’Brien J, Pourmalek diseases 2013-2020. Genebr a: World Health
F, Lozano R. Algorithms for enhancing public health Organization; 2013.
utility of national causes-of-death data. Popul Health 21. GBD 2016 Brazil Collaborators. Burden of disease in
Metr 2010; 8: 9. https://doi.org/10.1186/1478-7954-8-9 Brazil, 1990–2016: a systematic subnational analysis
11. França E, Teixeira R, Ishitani L, Duncan BB, Cortez- for the Global Burden of Disease Study 2016. Lancet
Escalante JJ, Morais Neto OL, et al. Ill-defined causes 2018; 392(10149): 760-75. https://doi.org/10.1016/
of death in Brazil: A redistribution method based s0140-6736(18)31221-2
on the investigation of such causes. Rev Saúde 22. Beaglehole R, Bonita R, Horton R, Ezzati M, Bhala
Pública 2014; 48(4): 671-81. https://doi.org/10.1590/ N, Amuyunzu-Nyamongo M, et al. Measuring
S0034-8910.2014048005146 progress on NCDs: One goal and five targets. Lancet
12. Malta DC, Teixeira R, Oliveira GMM de, Ribeiro AL. 2012; 380(9850): 1283-5. https://doi.org/10.1016/
Mortalidade por Doenças Cardiovasculares Segundo s0140-6736(12)61692-4
o Sistema de Informação sobre Mortalidade e as 23. Malta DC, Duncan BB, Barros MB de A, Katikireddi
Estimativas do Estudo Carga Global de Doenças no SV, Souza FM de, Silva AG da, et al. Medidas de
Brasil, 2000-2017. Arq Bras Cardiol 2020; 115(2): 152- austeridade fiscal comprometem metas de controle
60. https://doi.org/10.36660/abc.20190867 de doenças não transmissíveis no Brasil. Ciênc
13. França E, Rao C, de Abreu DMX, Souza MFM, Lopez Saúde Coletiva 2018; 23(10): 3115-22. https://doi.
AD. Comparison of crude and adjusted mortality rates org/10.1590/1413-812320182310.25222018
from leading causes of death in northeastern Brazil. 24. França EB, Cunha CC da, Vasconcelos AMN, Escalante
Pan Am J Public Health 2012; 31(4): 275-82. https:// JJC, Abreu DX de, Lima RB de, et al. Investigation of
doi.org/10.1590/s1020-49892012000400002 ill-defined causes of death: assessment of a program’s
14. GBD 2017 Causes of Death Collaborators. Global, performance in a State from the Northeastern region
regional, and national age-sex-specific mortality of Brazil. Rev Bras Epidemiol 2014; 17(1): 119-34.
for 282 causes of death in 195 countries and https://doi.org/10.1590/1415-790X201400010010ENG
13
REV BRAS EPIDEMIOL 2021; 24: E210004.SUPL.1TEIXEIRA, R.A. ET AL.
25. Brasil. Ministério da Saúde. Manual para Investigação la región de las Américas. Boletín Epidemiológico.
do Óbito com Causa Mal Definida. Brasil: Ministério Organización Panamericana de la Salud; 2003.
da Saúde; 2009. Série A(48). 33. Oliveira GMM, Klein CH, Souza e Silva NA.
26. Marinho MF, França EB, Teixeira RA, Ishitani LH, da Mortalidade por doenças cardiovasculares em três
Cunha CC, dos Santos MR, et al. Data for health: Impact estados do Brasil de 1980 a 2002. Rev Panam Salud
on improving the quality of cause-of-death information Pública 2006; 19(2): 85-93.
in Brazil. Rev Bras Epidemiol 2019; 22(Supl. 3): 1-13. 34. Oliveira GMM, Souza e Silva NA, Klein CH. Mortalidade
https://doi.org/10.1590/1980-549720190005.supl.3 Compensada por Doenças Cardiovasculares no período
27. Malta DC, Santos MAS, Stopa SR, Vieira JEB, Melo EA, de 1980 a 1999 - Brasil. Arq Bras Cardiol 2005; 85(5): 305-
dos Reis AAC. A Cobertura da Estratégia de Saúde da 13. https://doi.org/10.1590/S0066-782X2005001800002
Família (ESF) no Brasil, segundo a Pesquisa Nacional de 35. França E, Teixeira R, Ishitani L, Duncan BB, Cortez-
Saúde, 2013. Ciênc Saúde Coletiva 2016; 21(2): 327-38. Escalante JJ, Morais Neto OL, et al. Causas mal
https://doi.org/10.1590/1413-81232015212.23602015 definidas de óbito no Brasil: métodos se redistribuição
28. Brasil. Ministério da Saúde. Secretaria de Vigilância em baseado na investigação de óbito. Rev Saúde Pública
Saúde. Departamento de Vigilância de Doenças e Agravos 2014; 48(4): 671-81. https://doi.org/10.1590/
Não Transmissíveis e Promoção da Saúde. Saúde Brasil S0034-8910.2014048005146
2015/2016: uma análise da situação de saúde e da epidemia 36. GBD 2015 Mortality and Causes of Death Collaborators.
pelo vírus Zika e por outras doenças transmitidas pelo Global, regional, and national life expectancy, all-
Aedes aegypti. Brasil: Ministério da Saúde; 2017. 388 p. cause mortality, and cause-specific mortality for 249
29. Almeida WS, Szwarcwald CL. Adequação das causes of death, 1980–2015: a systematic analysis for
informações de mortalidade e correção dos óbitos the Global Burden of Disease Study 2015. Lancet
informados a partir da Pesquisa de Busca Ativa. Ciênc 2016; 388(10053): 1459-544. https://doi.org/10.1016/
Saúde Coletiva 2017; 22(10): 3193-203. https://doi. s0140-6736(16)31012-1
org/10.1590/1413-812320172210.12002016
30. Frias PG, Szwarcwald CL, Morais Neto OL, Leal Received on: 11/10/2020
MC, Cortez-Escalante JJ, Souza Junior PRB, et al. Revised on: 12/04/2020
Utilização das informações vitais para a estimação Accepted on: 12/10/2021
de indicadores de mortalidade no Brasil: Da busca Preprint on: 15/12/2020
ativa de eventos ao desenvolvimento de métodos.
Cad Saúde Pública 2017; 33(3): e00206015. https:// Authors’ contributions: RAT, LHI, FM, and DCM
doi.org/10.1590/0102-311x00206015 conceived and designed the study. RAT developed
31. Teixeira RA, Naghavi M, Guimarães MDC, Ishitani the management, exploration, and analysis of the
LH, França EB. Quality of cause-of-death data in Brazil: data, the elaboration and interpretation of results,
Garbage codes among registered deaths in 2000 and 2015. and the discussion. EPJ assisted in writing and final
Rev Bras Epidemiol 2019; 22(Supl. 3): e90002.supl.3. proofreading. All authors critically reviewed the
https://doi.org/10.1590/1980-549720190002.supl.3 manuscript and contributed to the entire process.
32. Organización Panamericana de la Salud. Sobre la All authors read, contributed to the final manuscript,
estimación de tasas de mortalidad para países de and approved it.
© 2021 Associação Brasileira de Saúde Coletiva
This is an open access article distributed under the terms of the Creative Commons license.
14
REV BRAS EPIDEMIOL 2021; 24: E210004.SUPL.1You can also read