Climate Changes, Impacts and Implications for New Zealand to 2100 - CCII
←
→
Page content transcription
If your browser does not render page correctly, please read the page content below
Climate Changes, Impacts and
Implications for New Zealand to 2100
Synthesis Report: RA1
Updated Climate Change Projections for New Zealand
for Use in Impact Studies
Andrew Tait1*, Abha Sood1, Brett Mullan1, Stephen Stuart1, Greg Bodeker2,
Stefanie Kremser2 and Jared Lewis2
1
 National Institute of Water & Atmospheric Research Ltd, Wellington, New Zealand
2
 BodekerScientific, Alexandra, New Zealand
* Corresponding author, email: andrew.tait@niwa.co.nz


                               PSConsulting Ltd
© All rights reserved. The copyright and all other intellectual property rights in this report remain vested solely in the
organisation(s) listed in the author affiliation list.

The organisation(s) listed in the author affiliation list make no representations or warranties regarding the accuracy of the
information in this report, the use to which this report may be put or the results to be obtained from the use of this report.
Accordingly the organisation(s) listed in the author affiliation list accept no liability for any loss or damage (whether direct or
indirect) incurred by any person through the use of or reliance on this report, and the user shall bear and shall indemnify and
hold the organisation(s) listed in the author affiliation list harmless from and against all losses, claims, demands, liabilities, suits
or actions (including reasonable legal fees) in connection with access and use of this report to whomever or how so ever caused.

When quoting, citing or distributing this Synthesis Report or its individual sections, please provide the full reference: Tait, A.,
Sood, A., Mullan, B., Stuart, S., Bodeker, G., Kremser S, and Lewis, J (2016) Updated Climate Change Projections for New Zealand
for Use in Impact Studies. Synthesis Report RA1. Climate Changes, Impacts and Implications (CCII) for New Zealand to 2100. MBIE
contract C01X1225. 18pp.

2
CONTENTS
HIGHLIGHTS                                                        5

INTRODUCTION                                                     6
   The CCII project                                              6
   The need for updated climate data                             6

BACKGROUND                                                       7
  Previous climate change projections for New Zealand            7
  The CMIP-5 dataset                                             8
  Representative Concentration Pathways (RCPs)                   8

DERIVATION OF CLIMATE DATA                                       10
  Dynamical downscaling using NIWA’s Regional Climate Model      10
  Further bias corrections and downscaling                       10
  Large ensemble temperature projections using pattern scaling   10

IMPROVED CLIMATE PROJECTIONS FOR NEW ZEALAND                     12
  RCM-derived data                                               12
  Large ensemble temperature projections                         13

WEB-BASED VISUALISATION TOOLS                                    15
  Our Future Climate New Zealand                                 15
  The Future Extremes interactive web page                       16

CONCLUSIONS                                                      17

REFERENCES                                                       18

                                                                      3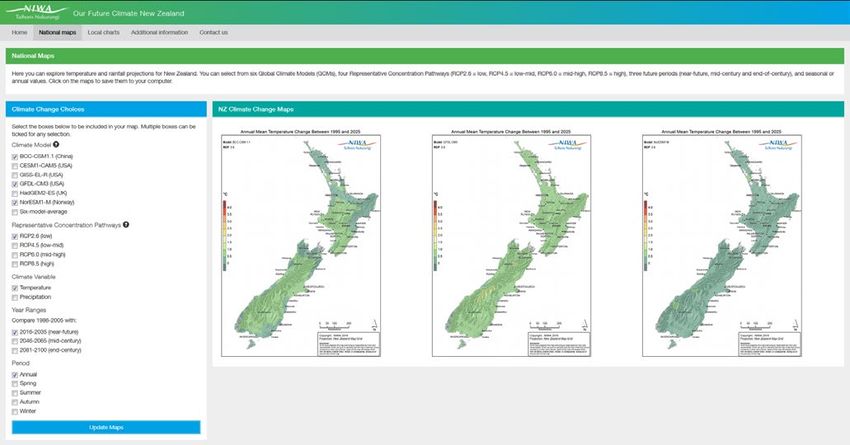
4
HIGHLIGHTS
• Over 35 TB of global climate data were           • The New Zealand-downscaled GCM and RCM
  downloaded from the Coupled Model Inter-           data have been analysed and the results
  comparison Project (CMIP-5) data repository        presented in a comprehensive report for the
  from over 40 General Circulation Model (GCM)       Ministry for the Environment (http://www.mfe.
  runs, performed for the Intergovernmental          govt.nz/node/21990).
  Panel on Climate Change (IPCC) Fifth
                                                   • Maps of projected climate changes have
  Assessment Report (AR5).
                                                     been produced for several variables, with
• The six best-performing GCMs for the New           the temperature and precipitation maps
  Zealand region were selected, based on             available for each of the six GCMs and the
  comparisons with observations over the             6-model-average, via the Our Future Climate
  historical data period of the models. These        New Zealand (http://ofcnz.niwa.co.nz). The
  models are: HadGEM2-ES (UK), CESM1-CAM5            OFCNZ tool also allows users to view time
  (USA), NorESM1-M (Norway), GFDL-CM3                series charts of changes in temperature
  (USA), GISS-E2-R (USA) and BCC-CSM1.1              and precipitation for 15 locations around the
  (China). Each of these models performs better      country.
  than the 12 CMIP-3 models used previously for
                                                   • The Future Extremes web page
  New Zealand climate change assessments.
                                                     (http://futureextremes.ccii.org.nz/) has also
• Sea surface temperature (SST) data from            been developed. This tool allows the user
  these six GCMs were bias-corrected and,            to select any location in New Zealand and
  together with a global atmospheric GCM, were       the variable of interest (hot days, frosts, hot
  used as initial and boundary conditions for        spells or cold spells), the emissions scenario,
  the higher spatial resolution (~27km) NIWA         and whether the results should be shown as
  Regional Climate Model (RCM). Temperature          probabilities, number of events per year, or
  and precipitation data from the RCM were bias      number of events per decade.
  corrected using the Linked empirical Modelled
                                                   • The CCII RA1 climate dataset is a landmark
  and Observed Distribution (LeMOD) correction
                                                     dataset that will be used by multiple
  method and all climate variables and indices
                                                     researchers and stakeholders for many years
  were further downscaled to the ~5km grid of
                                                     to come, to produce a consistent baseline of
  the Virtual Climate Station (VCS) data.
                                                     knowledge on climate change impacts and
• The Ensemble Projections Incorporating             implications for New Zealand.
  Climate (EPIC) model uncertainty method
  was developed to generate large ensemble
  projections of maximum and minimum
  temperatures at daily resolution for all of
  New Zealand, out to 2100. These data can be
  used to generate probability density functions
  (PDFs) of future maximum and minimum
  temperature.

                                                                                                       5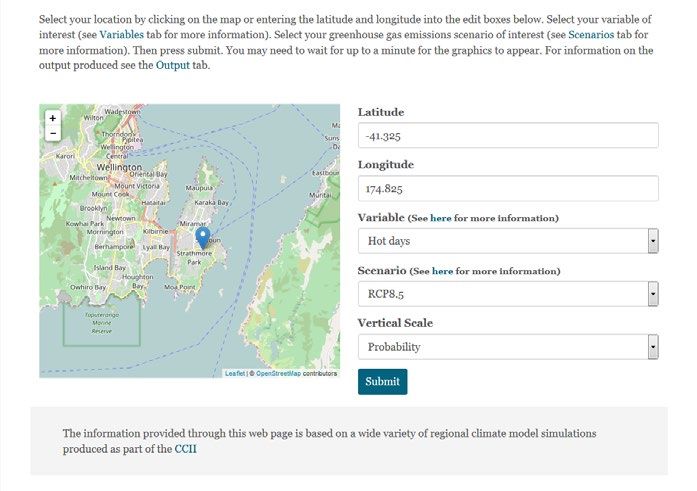
INTRODUCTION
    The CCII project
    The “Climate Changes, Impacts and Implications”
    (CCII) project is a four-year project (October 2012 –
    September 2016) designed to address the following
    question:
                                      What are the predicted climatic conditions and assessed/
                                      potential impacts and implications of climate variability
                                      and trends on New Zealand and its regional biophysical
                                        environment, the economy and society, at projected
                                                 critical temporal steps up to 2100?

    The CCII project brings together a strong research                  The need for updated climate data
    team with knowledge and modelling capabilities in                   Anthropogenic climate change poses critical
    climate, ecosystems, land and water use, economics,                 challenges for New Zealand. Therefore, it is critical
    and sociocultural research to address the environment               that robust, up-to-date climate projection data are
    sector investment plan priority of “stronger prediction             produced and made readily available and ‘user
    and modelling systems”.                                             friendly’, to improve our understanding of the potential
    The project is based around five inter-related                      impacts and implications of climate change on New
    Research Aims (RAs) that will ultimately provide new                Zealand’s environment, economy and society.
    climate change projections and advancements in                      For the CCII project (and for multiple related ongoing
    understanding their impacts and implications for New                and future projects), the RA1 team worked closely with
    Zealand’s environment, economy and society. The five                NIWA’s Regional Climate Modelling Programme1 to
    RAs are:                                                            produce updated, state-of-the-art downscaled New
    Research Aim 1: Improved Climate Projections                        Zealand climate projections and a large ensemble of
                                                                        temperature projections for New Zealand based on a
    Research Aim 2: Understanding Pressure Points, Critical
                                                                        pattern scaling approach. These datasets were made
    Steps and Potential Responses
                                                                        available to the researchers in RAs 2 and 3 (see the
    Research Aim 3: Identifying Feedbacks, Understanding                Synthesis Reports associated with these two RAs for
    Cumulative Impacts and Recognising Limits                           details on the modelling work that incorporated the
    Research Aim 4: Enhancing Capacity and Increasing                   climate data), and have also been shared with other
    Coordination to Support Decision-making                             researchers outside the CCII project.

    Research Aim 5: Exploring Options for New Zealand in
    Different Changing Global Climates

    The overall purpose of RA1 is to: Update and improve
    regional-scale projections of climate trends and
    variability across New Zealand out to 2100 based on
    the latest global projections. This synthesis report
    describes the process of updating and improving
    regional-scale climate projections for New Zealand
    and describes how users can access the new data.
    Work done on generating a large ensemble of
    temperature projections for New Zealand is also
    presented, as are web-based tools for exploring
    visualisations of the data.

    https://www.niwa.co.nz/climate/research-projects/regional-modelling-of-new-zealand-climate
    1

6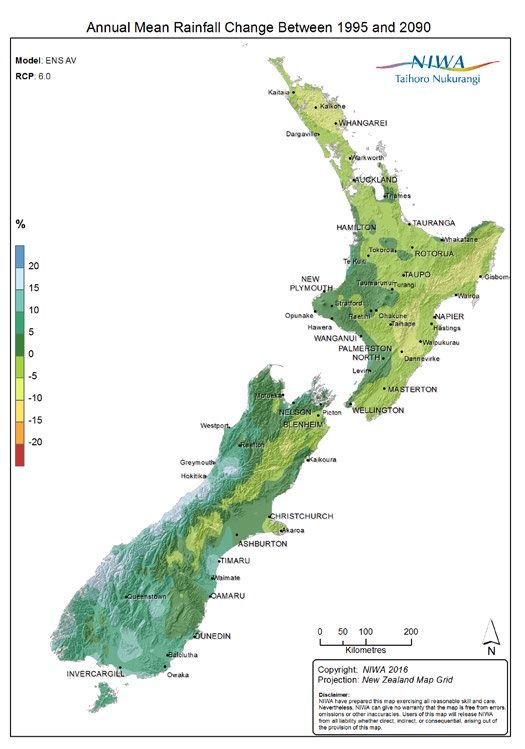
BACKGROUND
Previous climate change projections for New
Zealand
In 2008, NIWA completed a set of future projections The New Zealand downscaling work was based on
of mean temperature and rainfall for New Zealand a statistical model that generated relationships
based on statistically downscaling output from 12 between observed mean monthly temperature and
General Circulation Models (GCMs). These GCMs had rainfall for New Zealand (using Virtual Climate Station
been recently (at the time) updated for the purposes data; Tait et al., 2006; Tait, 2008) and indices derived
of the Climate Model Intercomparison Project, phase from gridded large-scale pressure, temperature and
3 (CMIP-3). Output from CMIP-3 was used extensively humidity fields over and around New Zealand (Mullan
by climate change researchers around the world with et al., 2001). The statistical relationships were then
maps and summaries of the projections being reported applied to the CMIP-3 model data from 12 of the
in the Intergovernmental Panel on Climate Change 4th available GCMs.
Assessment (AR4) Working Group 1 Report (Solomon
et al., 2007).
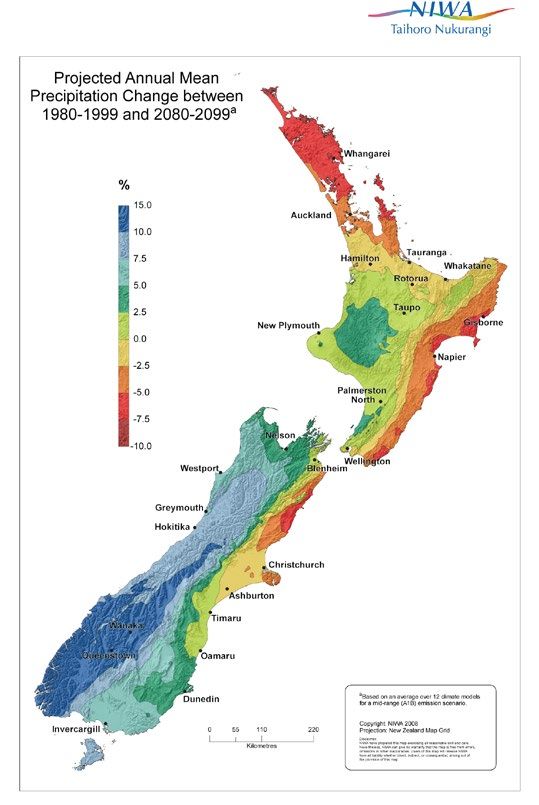
Figure 1: Maps made in 2008 of the projected change in mean annual temperature (left) and precipitation (right) between 1980-1999
and 2080-2099, based on a middle-of-the-road greenhouse gas emissions scenario (A1B) and the average of 12 GCMs (statistically
downscaled onto a 5km grid for New Zealand).
Virtual Climate Station (VCS) data are interpolated from daily observations of rainfall, temperature, wind speed, etc. to a regular 0.05° lat/long
(approx. 5km) grid covering all of New Zealand. More information can be found here:
https://www.niwa.co.nz/climate/our-services/virtual-climate-stations.
7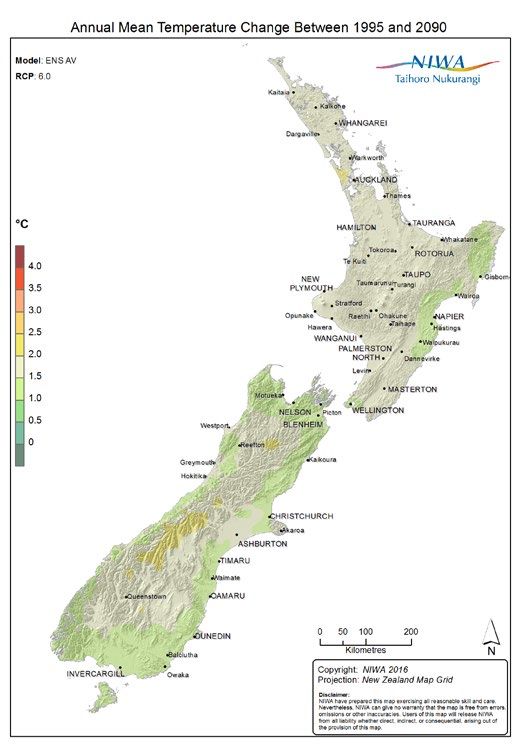
Maps of the projected change in the mean annual           to the significant amount of time needed to run the
    temperature and precipitation between 1980-1999           simulations on NIWA’s supercomputer) was coupled to
    and 2030-2049 (50 year change) and 2080-2099 (100         the output from six GCMs (Table 1). The selection of the
    year change), based on the A1B middle-of-the-road         six GCMs was based on an assessment of the best-
    greenhouse gas emissions scenario and the 12-model        performing models for simulating the past climate of
    average, were produced (e.g. Figure 1). Projections       New Zealand (Mullan et al., 2013a,b). This selection
    were also made for each GCM and other emission            approximately spans the climate sensitivity of the
    scenarios, with these data summarised in tables,          complete set of CMIP-5 models.
    figures and text and published as a report for the New
    Zealand Ministry for the Environment (MfE, 2008a).        Representative Concentration Pathways (RCPs)
    The NIWA report formed the basis for the MfE              The most significant change between CMIP-3
    publication “Preparing for Climate Change: A guide        and CMIP-5 was that the GCMs for CMIP-5 were
    for local government in New Zealand” (MfE, 2008b),        “forced” with updated data on future atmospheric
    which has subsequently been used extensively by local     greenhouse gas concentrations. Previously, these
    government and others (e.g. engineers, researchers,       concentrations were calculated based on a prescribed
    businesses) for the last eight years.                     set of greenhouse gas emission scenarios; the so-
                                                              called SRES scenarios (i.e. B1 = low emissions, A1B
    Also included in the NIWA and MfE publications
                                                              = mid-range emissions, A2 = mid-high emissions)
    was some very early output from the NIWA Regional
                                                              (Nakicenovic and Swart, 2000). For the IPCC AR5, the
    Climate Model (RCM; see Section 3 of this report for
                                                              SRES emission scenarios were replaced with a set of
    details). Over the last eight years NIWA has invested
                                                              Representative Concentration Pathways (RCPs) (Van
    an extensive effort to improve and validate the RCM,
                                                              Vuuren et al., 2011).
    and the CCII project has capitalised on this work. Also
    in this period since 2008, the IPCC published the 5th
    Assessment Report (AR5; IPCC, 2013) which reported
    on results from the most-recent CMIP phase (CMIP-5).

    Thus it was a perfect opportunity to update the climate
    change projections for New Zealand based on CMIP-
    5 GCM output (incorporating all the advances and
    improvements at a global climate modelling level) and
    using the latest version of NIWA’s RCM. This update
    was the core function of CCII RA1.

    The CMIP-5 dataset
    The IPCC AR5 Working Group Reports, Summary for
    Policy Makers and Synthesis Report were published
    in 2013 and 2014. The majority of the Working Group 1
    assessment was based on output from CMIP-5 GCMs
    (IPCC, 2013). The number of GCM runs submitted
    to CMIP-5 (around 40, with varying run lengths) was
    much larger than for CMIP-3 (the models used for
    the previous IPCC AR4). All the CMIP-5 output was
    downloaded by NIWA and Bodeker Scientific, for use in
    the CCII RA1 analyses.

    All told, the CMIP-5 dataset takes up over 35 TB of
    disk storage space. The large temperature ensemble
    analysis (see Section 3.3) using a pattern-scaling
    approach utilised all of these data, while the RCM (due

8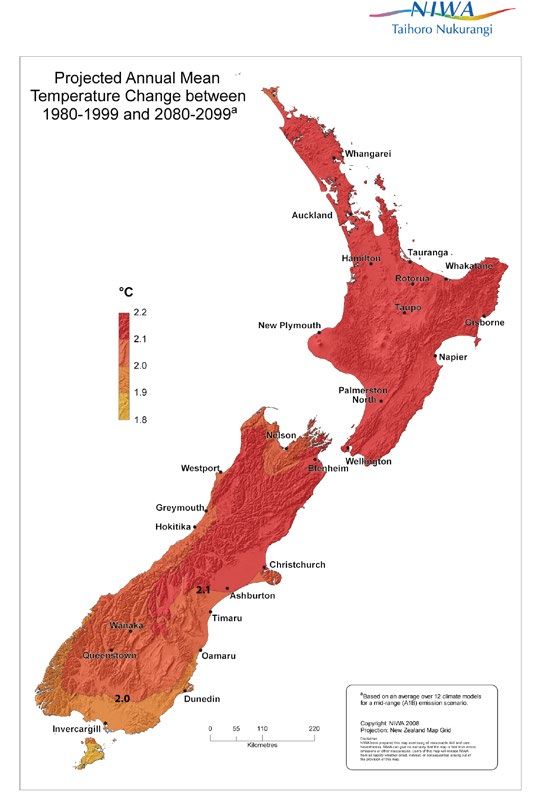
Table 1: Listing of the six CMIP-5 models dynamically downscaled via NIWA’s regional climate model (RCM),
and the scenarios and periods of the simulations.

CMIP5-Models                 Historic       RCP2.6          RCP4.5            RCP6.0           RCP8.5
HadGEM2-ES
                           1971-2005      2006-2120        2006-2120         2006-2099       2006-2120
MOHC (UK)
CESM1-CAM5
                           1971-2005      2006-2120        2006-2120         2006-2120       2006-2100
NSF-DOE-NCAR (USA)
NorESM1-M
                           1971-2005      2006-2100        2006-2100         2006-2100       2006-2100
NCC (Norway)
GFDL-CM3
                           1971-2005      2006-2100        2006-2120         2006-2100       2006-2100
NOAA-GFDL (USA)
GISS-E2-R
                           1971-2005      2006-2120        2006-2120         2006-2100       2006-2120
NASA-GISS (USA)
CC-CSM1.1
                           1971-2005      2006-2120        2006-2120         2006-2099       2006-2120
BCC (China)

The RCPs are identified by their approximate total
radiative forcing at 2100 relative to 1750: 2.6 W m-2 for
RCP2.6, 4.5 W m-2 for RCP4.5, 6.0 W m-2 for RCP6.0,
and 8.5 W m-2 for RCP8.5. These RCPs include one
mitigation scenario (RCP2.6. which requires removal
of some of the CO2 presently in the atmosphere),
two stabilization scenarios (RCP4.5 and RCP6.0),
and one scenario with very high greenhouse gas
concentrations.

Figure 2 compares the SRES and RCP atmospheric
carbon dioxide concentrations. Although the AR4 and
AR5 scenarios do not correspond directly to each
other, CO2 concentrations under RCP4.5 and RCP8.5
are very similar to those of the SRES scenarios B1 and
A1FI, respectively.

                          Figure 2: Atmospheric carbon dioxide concentrations for the IPCC 4th
                          Assessment (dotted lines, SRES scenarios) and for the IPCC 5th Assessment
                          (solid lines, RCP scenarios).

                                                                                                            9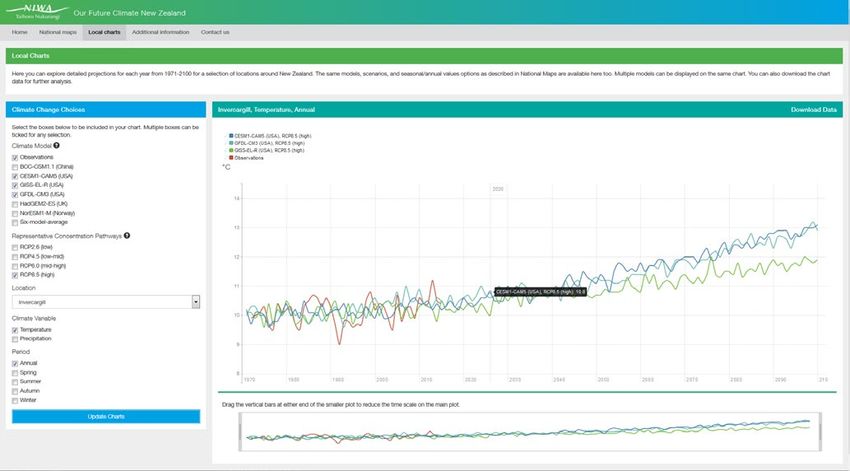
DERIVATION OF                                             variables only; minimum and maximum temperature
                                                               and precipitation. A newly devised “Linked empirical
     CLIMATE DATA                                              Modelled and Observed Distribution (LeMOD)”
                                                               correction method is applied to correct biases in the
     Dynamical downscaling using NIWA’s Regional               distributions of the daily data and thus to consistently
     Climate Model                                             remove the highest order systematic local model
                                                               errors (Sood, 2016). This method is designed to remain
     Dynamical downscaling, compared with statistical
                                                               valid even under nonstationary climatic conditions.
     downscaling, yields realistic simulations of a
                                                               Subsequently all climate data are downscaled to higher
     physically consistent set of temporally and spatially
                                                               spatial resolution (e.g. VCS resolution) by bilinear
     highly resolved fields. The interactions of the large-
                                                               interpolation and additionally using local wind direction
     scale circulation with higher resolution orography
                                                               and elevation data where appropriate.
     and other surface features (e.g. land-sea interface,
     vegetation cover, large lakes etc.) are well captured     The large-scale circulation biases inherent in the
     in Regional Climate Model (RCM) simulations               driving fields of the climate models remain unaffected.
     resolving a diverse range of climatic features and        This results in considerable spread in model results for
     thus suited for environmental and climate impact          the past control period (1971-2000). The climatological
     studies. Nevertheless, errors inherent in representing    mean of the primary climate variables for the control
     local surface conditions, atmospheric processes           period are adjusted to match the observed values
     and external forcing in RCMs lead to considerable         based of VCS data for all individual models. By
     systematic biases in simulating regional variables.       applying the same adjustment to the future projection
     Reducing biases in RCM data is necessary to increase      enables direct comparison and evaluation of impact
     confidence in regional climate impact studies. The        model output with observations for the control period
     iterative dynamical downscaling procedure developed       and as well determine the climate impacts in future
     at NIWA is designed to reduce systematic biases over a    projections.
     wide range of spatiotemporal scales.
                                                               The bias corrected data exhibits lower root-mean-
     The “NIWA” dynamical procedure involves forcing a         square-error and higher temporal correlations relative
     “free running” global atmospheric general circulation     to uncorrected or the most commonly-used quantile
     model (AGCM) by sea surface temperatures (SST) and        matching bias correction procedure. Since reducing
     sea ice fields extracted from CMIP5 data archive. The     model biases is expected to reduce the spread in model
     SST data exhibit considerable biases in the historic      results in the past climate, except where the spread is
     period both at global and regional scales. The monthly    related to internal variability, this feature is expected
     SST climatologies are bias corrected over the baseline    to persist in transient climate future projections and
     (1961-2005) period with respect to high resolution        contribute towards reducing uncertainties in model
     gridded SST observational dataset, HadISSTv1.1            projections.
     (Rayner et al., 2003) to reduce the general circulation
     biases. The biases in variables strongly influenced       Large ensemble temperature projections using
     by SST, such as precipitation and wind patterns, are      pattern scaling
     expected to be reduced (Nguyen, K.C. et al., 2012).       One of the principal challenges of adapting to
     In the next step, the improved lateral boundary           changes in climate is dealing with uncertainties in
     conditions are extracted from AGCM simulations            projections of climate change in a comprehensive
     described above to drive the regional climate model,      way. Even for a given greenhouse gas emissions
     HadRM3, a limited area version of HadAM3, to              scenario, the provision of a small number of RCM
     dynamically downscale projections over the New            projections from a limited set of regional climate
     Zealand domain. The regional SST for the RCM domain       models (see Table 1) does not adequately describe
     are again bias corrected on the finer spatial scale for   the full spectrum of possible futures describing the
     improving regional projections.                           impacts and implications of climate change on New
                                                               Zealand’s regional biophysical environment, economy
     Further bias corrections and downscaling                  and society. It is essential for decision-making that
     Further bias correction procedures are performed          the full spectrum of uncertainty is captured in climate
     separately on RCM data for the primary climate            change projections. These uncertainties arise from

10
(1) our incomplete understanding of the processes and implications of climate change in a probabilistic
affecting the sensitivity of the climate system to way. A tailored web-based system to deliver the
increases in greenhouse gas concentrations; and (2) summary statistics describing the probability of
the representation of these processes in the global and different futures to a wide range of potential users
regional models used to generate the projections. To was also developed (see Section 5.2).
this end, the EPIC (Ensemble Projections Incorporating
Climate model uncertainty) method was developed
in RA1 to generate large ensemble projections of
maximum and minimum temperatures (hereafter X), at
daily resolution, out to 2100.
Each EPIC ensemble member is constructed by
adding contributions from (1) a climatology derived
from VCS data (see Section 2.1) that represents the
time invariant part of the signal; (2) a contribution
from forced changes in X where those changes can be
statistically related to changes in global mean surface
temperature (Tglobal); and (3) a contribution from
unforced variability that is generated by a stochastic
weather generator. Because GCMs and RCMs are
less likely to correctly represent unforced variability
compared to observations, the stochastic weather
generator takes as input measures of variability
derived from observations but also allows that
variability to respond to changes in Tglobal.
The statistical relationships between changes in X (and
its patterns of variability) with Tglobal are obtained in a
‘training’ phase. Then, in an ‘implementation’ phase,
190 simulations of Tglobal are generated using a simple
climate model tuned to emulate 19 different CMIP-5
GCMs and 10 different carbon cycle models. Using the
190 Tglobal time series and the correlation between the
forced changes in X and Tglobal, the forced change in
the X field can be generated 190 times. Any change in
the variability of X that can be attributed to changes in
Tglobal can be calculated in a similar way.
This 190 member ensemble is further expanded by
applying the results of a Monte Carlo analyses on the
uncertainty in the correlations between X and Tglobal,
and by using the stochastic weather generator model
to generate a realistic representation of weather
(including spatial coherence) that also responds to
forced changes in climate in a way that is consistent
with the RCM projections. Such a large ensemble
of projections permits a description of a probability
density function (PDF) of future climate states rather
than individual story lines within that PDF which may
not be representative of the PDF as a whole; the EPIC
method corrects for such potential sampling bias. The
method is useful for providing projections of changes
in climate to users wishing to investigate the impacts
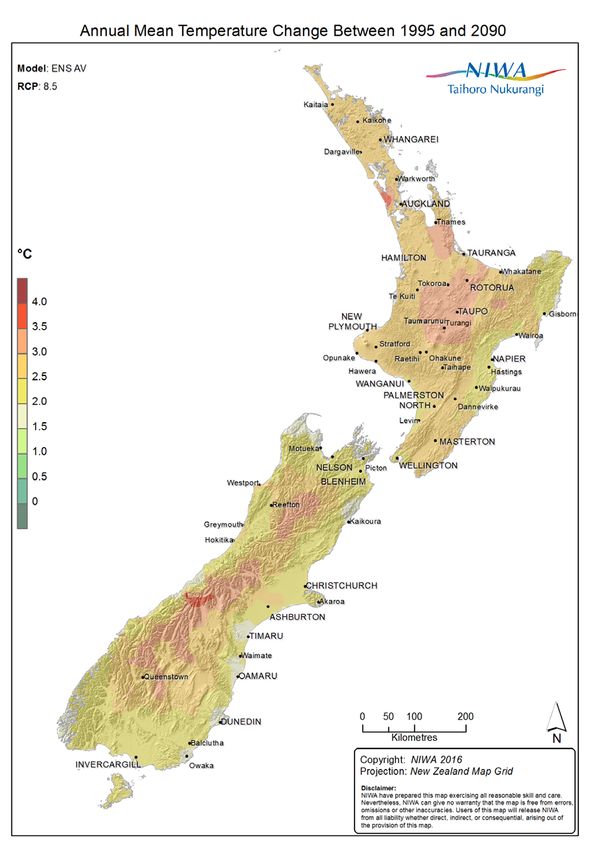
11IMPROVED CLIMATE based temperature and precipitation data. Figure 3
shows a small sample of these maps, for the projected
PROJECTIONS FOR NEW annual mean temperature and precipitation changes
ZEALAND for New Zealand for a mid-range greenhouse gas
concentration pathway (RCP6.0), between 1986-2005
and 2081-2100.
RCM-derived data
The maps in Figure 3 can be broadly compared with
The core set of downscaled (to the 5km grid) surface-
those shown in Figure 1 above, taking into account
level climate variables outputted from the RCM and
the differences in the number of GCMs used in the
made available to other CCII researchers is as follows
average (6 versus 12); the different GCM origins
(an asterisk denotes whether the variable has been
(i.e. the international modelling groups) and their
bias-corrected using the LeMOD technique):
version (CMIP-5 versus CMIP-3); the different base
• Maximum daily temperature (K)* climate period (1986-2005 versus 1980-1999); and the
• Minimum daily temperature (K)* method of downscaling (statistical versus dynamic).
What can be seen is that while there is definitely a
• Daily precipitation total (mm)*
broad similarity, the increase in spatial detail in the
• Daily average solar radiation (MJ/m2) new maps, especially in the mountainous regions, is
• Daily average wind speed at 10 m (m/s) apparent. Also, projected annual precipitation change
in the area of the Canterbury foothills and plains is
• Daily average mean sea level pressure (hPa) distinctly different between the old and new maps,
• Daily average relative humidity (%) likely related to changes in the strength of the westerly
winds and the changing fraction of precipitation falling
The following additional variables were also derived
as rain versus snow.
and made available for specific modelling work:
A complete analysis of the downscaled (using both
• Daily average vapour pressure (hPa)
statistical and dynamical methods) CMIP-5 data for
• Daily potential evapotranspiration total (mm) New Zealand has recently been performed by NIWA
• Daily dew point temperature (K) for the Ministry for the Environment (MfE, 2016). This
report is an update to the MfE (2008) local government
Lastly, the following summary data were also produced
guidance manual5.
when requested:
• Growing degree days (base 5°C and 10°C)
• Days with Tmax > 25°C
• Days with Tmin < 0°C
• Days with precipitation ≥ 1 mm
For the first two sets of variables above, daily,
monthly and annual values were produced. For the
final set, only annual data were produced. For every
climate variable, datasets were generated for the
historic period 1971-2005 and for the future period
corresponding to the particular GCM and RCP shown
in Table 1. All data were saved in NetCDF format. All
told, the CCII RA1 RCM-based dataset comes to over
2 TB of disk space. This is much too large to put on
a website, so users should contact NIWA to enquire
about accessing some or all of this dataset.
Section 5 describes a new web-based tool called “Our
Future Climate New Zealand”, which can be used to
view multiple maps and time series plots of the RCM-
12Figure 3: New maps of the projected change in mean annual temperature (left) and precipitation (right) between 1986-2005 and
2081-2100, based on a middle-of-the-road representative concentration pathway (RCP6.0) and the average of six GCMs (dynamically
downscaled onto a 5km grid for New Zealand).
Large ensemble temperature projections
Large ensembles of projections of daily maximum
and minimum temperatures using the EPIC method
are available by contacting BodekerScientific6.
Projections are available for each node of the VCS grid
(approximately 5km spatial resolution) for all of New
Zealand for all four RCP emissions scenarios. As an
example of the analyses that can be performed with
these large ensembles, probability density functions
of daily maximum temperatures for four population
centres around New Zealand are shown in Figure 4.
The ensemble temperature dataset has also been
used to produce maps showing the current and future
number of hot days (Tmax > 25°C) for New Zealand,
based on RCP8.5 (RSNZ, 2016).
http://www.unidata.ucar.edu/software/netcdf/
E-mail: climate-enquiries@niwa.co.nz
http://www.mfe.govt.nz/publications/climate-change/climate-change-projections-new-zealand
13Figure 4: Histograms of daily maximum temperature for RCP 2.6 (left column) and RCP 8.5 (right column)
scenarios for four population centres in New Zealand. Thresholds of 25°C and 30°C are shown with vertical dashed
lines.
14WEB-BASED VISUALISATION periods (2016-2035, 2046-2065, and 2081-2100) to
compare with the historic period 1986-2005. The maps
TOOLS can be enlarged and saved for use in presentations,
reports or publications. For the charts, users can
The goal of the CCII RA1 team was to produce updated
select from 15 main centre locations around New
and improved regional-scale projections of climate
Zealand.
trends and variability across New Zealand out to 2100
based on the latest global projections. These data were The seasonal and annual VCS and climate model
primarily for the purpose of the other CCII modelling data associated with all the charts are accessible
teams in RAs 2 and 3, as well as other researchers. by clicking on the “Download Data” link above the
Over the course of the project, it was agreed that charts display area. Data for other locations and data
resources should also be devoted to web-based at higher temporal resolution (e.g. monthly or daily)
visualisation tools, so that users can explore the new are available from NIWA upon request. GIS datasets
climate data. associated with the maps are also available upon
request.
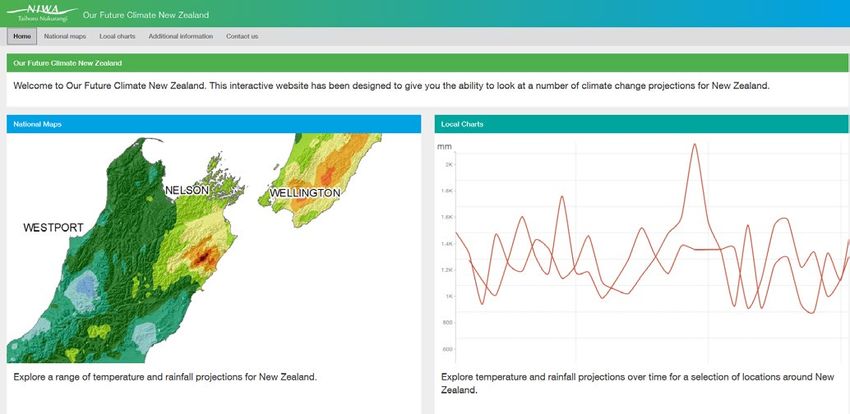
Our Future Climate New Zealand NIWA are considering adding more climate variables
The CCII project, in collaboration with the NIWA to this tool, and will continue to work on this, with
Climate Vulnerability, Impacts and Adaptation the webpage being maintained by NIWA even though
Programme, have developed the “Our Future Climate the CCII programme has ended. Potential variables
New Zealand” (OFCNZ) web tool8. Figure 5 shows include wind, solar radiation, and relative humidity.
the homepage with the two main components of the Also under consideration are derived variables like
tool: the exploration of maps and charts; and Figure potential evapotranspiration, growing degree days, and
6 shows the menu and display features of these two the number of hot (Tmax > 25°C) and frost (Tmin < 0°C)
components. days.
Ease-of-use and multi-functionality were the two
primary objectives when designing the OFCNZ tool.
Users can select from all the available GCMs (6 plus
the 6-model-average), all the RCPs (4), temperature
or precipitation, and annual or seasonal data. For the
maps, users can also select from three future 20-year
Figure 5: The Our Future Climate New Zealand “homepage”, showing options for exploring maps (right) and charts (left).
8
http://ofcnz.niwa.co.nz
15Figure 6: The Our Future Climate New Zealand map interface (top) and the chart interface (bottom).
The Future Extremes interactive web page
The CCII project also developed the Future Extremes
web page . The web page allows the user to select any
location in New Zealand, either through an interactive
map (see Figure 7) or by entering the latitude and
longitude of the location, as well as the variable of
interest (hot days, frosts, hot spells or cold spells), the
emissions scenario, and whether the results should be
shown as probabilities, number of events per year, or
number of events per decade.
http://futureextremes.ccii.org.nz/
9
16Figure 7: An example of the front page of the future extremes web page.
The EPIC method is then used to generate a large
ensemble of projections for the selected location,
variable, and scenario from which probability density
functions are calculated for the first and last decades
of the 21st century. An example of the results
generated by the future extremes web page is provided
in Figure 8.
CONCLUSIONS
The CCII RA1 climate dataset is a major resource for
climate change impact assessment in New Zealand.
Figure 8: The change in the frequency of hot days through the
The terabytes of climate data that have been produced 21st century for 41.325°S and 174.825°E (Wellington City) under
have been the primary input for the RA2 and RA3 the RCP8.5 greenhouse gas emissions scenario. The likelihood
of occurrence of different daily maximum temperatures is
modelling work, and will be the basis for virtually shown for the first decade (blue) and the last decade (red) of this
all climate change assessments in New Zealand for century. Over 2091-2100, on about 40 days of each year, the daily
several years to come. In particular, the potential maximum temperature is projected to exceed 25°C in contrast
to about 5 days in each year over 2001-2010.
for using the large ensemble temperature dataset
in probabilistic impact assessments is yet to be fully
However, it is also vital to produce landmark
realised.
datasets that can be used by multiple researchers
Of course, research will continue well beyond the and stakeholders to produce a consistent baseline
life of the CCII project to refine and improve these of knowledge on climate change impacts and
datasets, e.g. using a higher resolution version of implications. The CCII RA1 climate dataset is such
the RCM, performing bias corrections on additional a landmark dataset. It is very likely that impact
variables, producing a large ensemble precipitation modelling-based papers using these climate data
dataset, and analysing the output of the New Zealand (including many coming from the CCII RA2 and RA3
Earth Systems Model (currently being developed under modelling work) will significantly contribute to the
the auspices of the Deep South National Science New Zealand chapter of the IPCC Sixth Assessment,
Challenge10). It is the nature of climate modelling that slated for release around 2021/22, as well as to many
ongoing improvements such as these will be made and other important national and international reports and
revised climate projections will be produced. documents.
http://www.deepsouthchallenge.co.nz/
10
17REFERENCES
IPCC (2013) Summary for Policymakers. In: Climate Nguyen, K., J. Katzfey, and J. McGregor (2012) Global 60
Change 2013: The Physical Science Basis. Contribution km simulations with CCAM: evaluation over the tropics.
of Working Group I to the Fifth Assessment Report of the Climate Dynamics 39(3): 637–654.
Intergovernmental Panel on Climate Change [Stocker,
Rayner N., D. Parker, E. Horton, C. Folland, L.
T.F.; Qin, D.; Plattner, G.K.; Tignor, M.; Allen, S.K.;
Alexander, D. Rowell, E. Kent and A. Kaplan (2003)
Boschung, J.; Nauels, A.; Xia, Y.; Bex, V.; Midgley, P.M.
Global analyses of sea surface temperature, sea
(eds.)]. Cambridge University Press, Cambridge, United
ice, and night marine air temperature since the late
Kingdon and New York, NY, USA.
nineteenth century, Journal of Geophysical Research:
Ministry for the Environment (2008a) Climate Change Atmospheres 108(D14): 4407.
Effects and Impacts Assessment. A Guidance Manual
Royal Society of New Zealand (2016) Climate change
for Local Government in New Zealand. 2nd Edition.
implications for New Zealand. ISBN 978-1-877317-16-3,
Prepared by Mullan, B; Wratt, D; Dean, S; Hollis,
70pp.
M. (NIWA); Allan, S; Williams, T. (MWH NZ Ltd), and
Kenny, G. (Earthwise Consulting Ltd), in consultation Solomon, S., D. Qin, M. Manning, Z. Chen, M. Marquis,
with Ministry for the Environment. NIWA Client Report K.B. Averyt, M. Tignor and H.L. Miller (eds.) Climate
WLG2007/62, February 2008, 156p. Change 2007: The Physical Science Basis. Contribution of
Working Group I to the Fourth Assessment Report of the
Ministry for the Environment (2008b) Preparing for
Intergovernmental Panel on Climate Change. Cambridge
climate change: A guide for local government in New
University Press, Cambridge, United Kingdom and New
Zealand. Prepared for the Ministry for the Environment.
York, NY, USA, 996 pp.
Wellington. Publication 891. ISBN 978-0-478-33116-5.
Sood, A. (2016, under review). Improved bias corrected
Ministry for the Environment (2016) Climate Change
and downscaled regional climate model data for
Projections for New Zealand: Atmosphere Projections
climate impact studies: Validation and assessment for
Based on Simulations from the IPCC Fifth Assessment.
New Zealand.
Wellington: Ministry for the Environment. Publication
number: ME1247, 127pp. Tait, A., R. Henderson, R. Turner and X. Zheng (2006)
Thin-plate smoothing spline interpolation of daily
Mullan, A.B., D.S. Wratt and J.A. Renwick (2001)
rainfall for New Zealand using a climatological rainfall
Transient model scenarios of climate changes for New
surface. International Journal of Climatology, 26, 2097-
Zealand. Weather and Climate, 21, 3-33.
2115.
Mullan, B., S. Dean and S. Stuart (2013a) How good are
Tait, A.B (2008) Future projections of growing degree
the CMIP5 models? Abstract and presentation for New
days and frost in New Zealand and some implications
Zealand Climate Change Centre Conference, 4-5 June
for grape growing. Weather and Climate, 28, 17–36.
2013, Palmerston North. http://www.nzcccconference.
org/images/custom/mullan,_bret_-_how_good_are_ Van Vuuren, D.P., J. Edmonds, M. Kainuma, K. Riahi, A.
the_cmip5.pdf. Thomson, K. Hibbard, G.C. Hurtt, T, Kram, V. Krey, J-F.
Lamarque, T. Masui, M. Meinshausen, N. Nakicenovic,
Mullan, B., S. Dean and S. Stuart (2013b) Validation
S. Smith and S.K. Rose (2011) The representative
of 5th assessment global climate models in the
concentration pathways: an overview. Climatic Change,
New Zealand region. Abstract and presentation for
109, 5-31.
Joint Conference of the NZ Hydrological Society and
Meteorological Society of NZ, 19-22 November 2013,
Palmerston North. (Conference Handbook, p. 152-153).
Nakicenovic, N and R. Swart (Eds) (2000) Special Report
on Emissions Scenarios. A Special Report of Working
Group III of the Intergovernmental Panel on Climate
Change. Cambridge University Press, Cambridge,
United Kingdom and New York, NY, USA, 599 p.
18You can also read