Real-time Unimpeded Taxi Out Machine Learning Service
←
→
Page content transcription
If your browser does not render page correctly, please read the page content below
Real-time Unimpeded Taxi Out Machine Learning Service

 Alexandre Amblard
 USRA
 at NASA Ames Research Center, Moffett Field, CA, USA

 Sarah Youlton
 USRA
 at NASA Ames Research Center, Moffett Field, CA, USA

 William J. Coupe
 NASA
 Ames Research Center, Moffett Field, CA, USA

 This paper describes a study on the estimation of the unimpeded taxi out time using
 Machine Learning (ML) tools and proposes an implementation that can be used to make
 real-time predictions at any airport in the National Airspace System. Kedro, an open-source
 pipeline framework, is used to develop the model definition and training. Models are stored in
 scikit-learn containers on a MLFlow server where they can be retrieved and served to make
 predictions in the live system. These open source frameworks provide common structures
 between ML services, allow for easier maintenance and updates, and overall deliver an easier
 CI/CD (Continuous Integration/Continuous Deployment) process. The current models were
 trained on data acquired at KCLT and KDFW from June 1st to December 31st , 2019 and
 compute taxi time in the ramp, airport movement area (AMA) and total (from gates to runways).
 The current versions of the models achieve relatively low uncertainties of about 10 to 15% for
 the total and AMA taxi times and about 20% for the ramp taxi time at both KCLT and KDFW.
 Initial tests on offline data from 2020 and 2021 show a small degradation (10 to 15%) in
 accuracy performance indicating the model’s resilience to operational changes over time.

 I. Introduction
 Since 2015, the National Aeronautics and Space Administration (NASA) in collaboration with the Federal Aviation
Administration (FAA) and flight operators, has been deploying some of its technologies developed for Integrated Arrival
Departure Surface (IADS) [1–3] to a few chosen airports as part of the Airspace Technology Demonstration-2 (ATD-2)
project [4].
 For its phase 1 & 2, the ATD-2 project focused on operations at Charlotte Douglas International Airport (CLT),
Charlotte, North Carolina, due to its complex ground surface, its location in one of the busiest air traffic corridors on the
East Coast and its abundant air traffic (# 7 in movements worldwide for 2016, [5]). ATD-2 deployment resulted in an
improved operational efficiency that saved an estimated 4.3 million pounds of fuel between October 2017 and January
2020 [6]. This improved efficiency is due to a better data exchange, coordination of release time for overhead stream
insertion and application of surface metering.
 After this successful deployment, ATD-2 extended its operation for its phase 3 by deploying to a metroplex
environment, the Dallas-Ft. Worth (Texas) Terminal Radar Approach Control (TRACON) where multiple airports
operate within common TRACON boundaries. For this phase 3, ATD-2 provided coordination between multiple airports
and added the functionality to reroute flights expected to be delayed by restrictions (often due to weather conditions).
 For fiscal year 2021, the ATD-2 project was extended for an additional year during which its focus is to improve
the benefits analysis of its phase 3 and implement a version of its scheduler algorithm that could run for most airports
in National Airspace System (NAS). This NAS-ready scheduler is to be enabled by the implementation of Machine
Learning (ML) services that will substitute the complex physical model of ground movements and airport configurations
designed in the prior implementation of the ATD-2 project. These microservices will lend themselves to a quicker and
easier adaptation to new airports and easier maintenance. These microservices will need to be sufficiently accurate to
enable the scheduler to provide useful schedules to Air Traffic Control personnel.

 1
These microservices will use ML algorithms that will be trained on historical data available for most airports in the
NAS. To produce predictions, the trained algorithms will be fed FAA System Wide Information Management (SWIM)
data from the ATD-2 Fuser[7], a software that ingests data feeds from various sources, formats and deconflicts them. To
enable this new implementation of the ATD-2 scheduler, several microservices would be required such as a service that
estimates the unimpeded taxi-out time, one that estimates ON time for arrivals, one that predicts departure runways,
etc. This paper describes how the model for predicting unimpeded taxi-out was developed and its performance. In
section II, we will present an overview of previous works on taxi-out time predictions. In section III, we will describe
the frameworks and architecture used to build and deploy the taxi-out ML prediction service. In section IV, we will
present some results produced by the microservice and we will conclude in section V.

 II. Taxi-out Predictions
 Taxi times of aircraft on the airport surface have been a long standing subject of study. Historically, the community
started by developing sophisticated physical models of the airport surface and of aircraft movement [8–15]. Recently,
models based on historical data and machine learning algorithms have been put forward as more sustainable solutions.
The literature of taxi time predictions is fairly large, but the wide range of datasets renders a comparison quite difficult.
Prior studies focused on various airports, different measured durations, etc., to calculate their models’ performance.
 The largest portion of the literature concentrates on modeling impeded taxi times, which is the actual duration
of time it takes an aircraft to travel on the airport surface, including any time waiting for air traffic control (ATC)
instruction and surface traffic congestion along the way. Some models used first-come-first-served queueing theory [16]
and others used fast-time simulation calibrated on historical data [17]. In recent years, using historical data and machine
learning techniques, several studies have tried to estimate the impeded taxi time. Early papers studying the estimation of
impeded taxi time with ML techniques used either linear or log-linear regression algorithms [18–21]. Later papers often
compared linear regression with more complex algorithms such as Singular Vector Machine (SVM), Random Forest or
Fully Connected Neural Network [22–27]. [28] studied a reinforcement learning approach in which the actions are the
taxi out time estimate and the states are defined by parameters such as the number of aircraft taxiing, time, previous taxi
times, etc. [29] defined a 2-dimensional embedding to capture the airport state using a fully connected Siamese Deep
Neural Network, and used a kNN model to compute the taxi time from the 2D-embedding.
 In a large number of studies previously listed, the unimpeded taxi time is an input to the impeded taxi time calculation.
The unimpeded time represents the duration of time the taxiing aircraft would spend if it had no constraints acting to
slow it down. One of the most employed estimate of the unimpeded taxi time is to use the 10th percentile of the taxi time
for a given pair of stand and runway. Another technique developed by the EUROCONTROL PRU[30] uses taxi time as
a function of the airport congestion for a given stand-runway pair and assigns unimpeded taxi time as the median value
of taxi times that have a congestion below a saturation value. Recently [31] estimated the unimpeded taxi time using a
node-link model at the Incheon International Airport (RKSI, 1553 nodes and 2034 links) and Airport Surface Detection
Equipment (ASDE) data from April 1st to 20th , 2015. The unimpeded taxi time is estimated by the sum of the taxi
time of each link along a given path which must be provided (for instance by tools such as departure manager DMAN
[32]). The model takes into account the plane weight category, whether the flight is an arrival or a departure, as well as
whether aircraft are turning before and after each link. The properties of each link are calculated from historical data.
 In this paper, we will present a method to evaluate unimpeded taxi out time that uses historical data and a ML
algorithm instead of the physical models described previously. This method is similar to the techniques employed to
estimate impeded taxi time. We will then use the unique capability of ATD-2 to test its performance.

 III. Taxi-out Machine Learning Service

A. Frameworks and Libraries
 We decided to use the Python programming language and several common, open-source packages to develop these
ML services. The main packages used for this development are Kedro∗ , MLFlow† and scikit-learn‡ (see Fig. 1 to
visualize where each framework is used).
 We endeavored to institute best practices across the Python model development. We decided to implement the
 ∗ https://github.com/quantumblacklabs/kedro
 † https://mlflow.org
 ‡ https://scikit-learn.org/stable/

 2
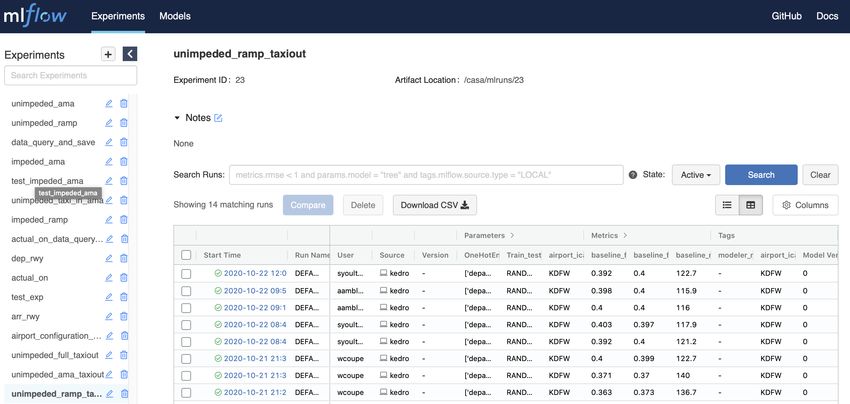
Kedro framework as the backbone of each training pipeline used for training and storing the models. The Kedro
framework enforces software engineering best practices for developing machine learning code. For instance, Kedro
eases collaboration among our team given that the structure of all the pipelines is very similar. It also allows abstract
data access (avoid hard-coded local directory path, database access, etc.) and organizes each node of the pipeline into
direct-acyclic graphs (DAGs), that enforce input/output readiness. These DAGs can be visualized with an additional
Python package called kedro-viz.
 The ML model, which encompasses feature engineering and the proper data science model, is contained in an
extended version of a scikit-learn pipeline and is registered and stored on a MLFlow server. MLFlow allows the
developer to store each run of a model (see Fig. 2 for an example) with a wealth of information such as the Git hash of
code used in the run, the environment in which the model ran, the parameters of the model, performance metrics, etc.
 The MLFlow-stored models are then deployed as representational state transfer (REST) application programming
interface (API) microservices using Flask§ framework. These REST APIs are used by the orchestrator to feed the
scheduler. Figure 1 shows a summary of the pipeline steps used to train models and the pieces of the training pipeline
that are transferred into the live prediction service through its storage on the MLFlow server.

Fig. 1 Diagram of the ML pipeline used to train the taxi-out time estimate (top) and diagram of the ML service
implementation (bottom). Kedro constitutes the backbone of the training pipeline, scikit-learn serves as a model
container, that will be deployed as a microservice.

B. Methodology
 The taxi-out pipelines are separated into three phases: data query, data engineering and data science model. The
data query is used in the training model phase to access historical data and primarily accesses data through SQL queries
and stores them locally into CSV files. This part of the pipelines is common to all our three pipelines, i.e. the pipeline
to estimate the ramp taxi time (from stand to spot), the AMA taxi time (from spot to runway) and the total taxi time
(from stand to runway).
 The data engineering does some basic transformations and filtering to feed the data modeling, such as fusing several
sources of information, removing data with incomplete information, and marking data for test or train groups. Some of
these processes like getting the proper runway will be re-implemented in the predictive ML service and some, like
separating train and test groups, won’t be necessary (see Fig. 1). One notable filtering applied to our training and testing
data is to limit the data to unimpeded taxis. To characterize a taxi as unimpeded, we used Airport Surface Detection
Equipment, Model X (ASDE-X) speed data in the AMA and selected flights whose taxiing speed did not drop below 4
knots for 90% of the taxi time. This filter is applied for our AMA and total taxi estimate. For the ramp taxi, we require
the number of arriving and departing aircraft in the ramp to be in the lowest percentile (60% and 30%) as well as the
number of departing aircraft in the AMA to be low (40th percentile). These constraints seem to filter a good amount of
impeded taxis while keeping about 15% of the flights in our training set.
 § https://flask.palletsprojects.com/en/2.0.x/

 3
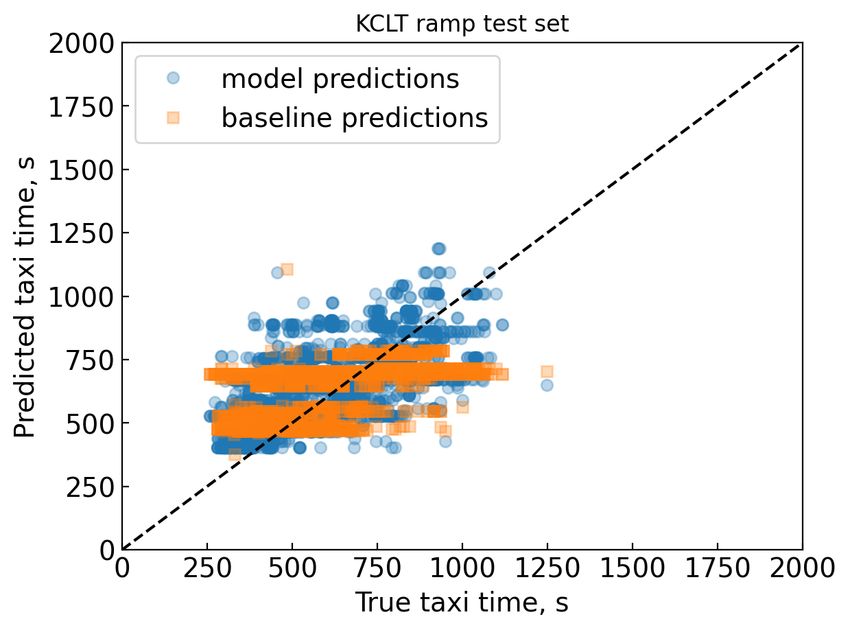
Fig. 2 Example of the MLFlow User Interface (UI) on a web-browser, that allows easy access to previous
runs/models and to compare several models. A user can access further information about each model run (e.g.,
model pickle, plots) using the UI hyperlinks.

Fig. 3 Left: KDFW hierarchical clustering on AMA taxi time to three runways. This approach can easily be
extended to any airport in the NAS without a complex adaptation. Terminal names are written in black, runways
are written in blue. Right: Same color-coded clusters distributed in the 3D AMA taxi time space (spatial 2D
and mark size 1D). The blue cluster seems to have the shortest AMA taxi to 17R, green cluster to 18L and the
red cluster to 36R.

 The data science part of the pipeline processes the data into their final form for modeling (feature engineering), fits
the data with a model, and computes some performance metrics. The boundary between feature engineering and data
engineering is not always well defined but our main criteria for implementation in feature engineering are complexity
and specificity. Transformations applied within the data science part will be saved into our pipeline container that will
be served through the REST API.

 4
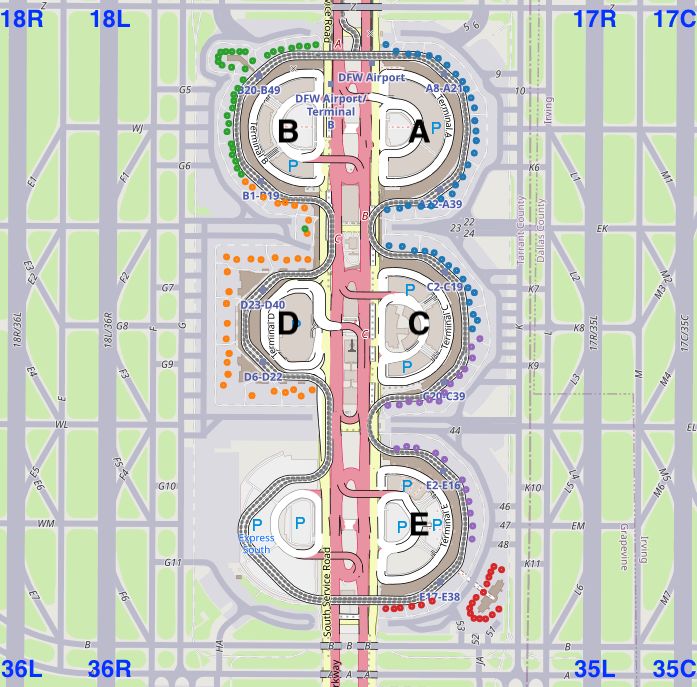
A driving goal in this project was to have a process that can easily be adapted to any airport in the NAS. The
feature selection, feature engineering, and model algorithms were all carefully developed with this goal in mind. As
such, the data science pipeline of the unimpeded taxi-out time takes in a limited number of accessible information:
carrier name, departure runway, and departure gate (the aircraft type has also been used but did not seem to improve the
models). These features are then encoded with a standard one-hot-encoder for the carrier and departure runways and
some dedicated encoder for the departure gates. We looked at different options for encoding the gate information, two
looked the most promising: clustering by terminal name, and clustering by similar historical taxi time.
 The first of these gate encoders uses the departure gate name to identify the terminal and creates one feature column
per terminal. It populates the appropriate column with the gate number. The rationale is that gates at the same terminal
have a somewhat similar unimpeded taxi time and that gates with similar numbers within a terminal have an even closer
taxi time. The latter assumption is unfortunately dependent on how the gate numbers are distributed in the terminal.
 The second of the gate encoders uses the data to create a number of clusters to group the gates. This encoder uses
the taxi time to three runways for each gate to group them in similar buckets. Gates without a sufficient number of taxis
to at least 3 runways are added to the clusters using the available runways. Figure 3 shows an example of the resulting
clusters for the unimpeded AMA taxi time at KDFW. The left image shows a top-down map of the KDFW airport, each
dot represents a gate location along the 5 main terminals and its color indicates the cluster it belongs to. The right
image shows the position of each gate (solid blue circle) in a 3 dimensional taxi-time space, each solid blue circle is
highlighted by a larger colored circle indicating its cluster.
 We found similar accuracy between the two methods, most likely because most of the information resides in the
terminal. We opted to use the latter one (clustering by historical taxi time) since it provides us with some good insight
into the gate behavior.
 Once the data has been processed by the feature engineering, the model for the unimpeded taxi-out time is defined
and fitted on the calculated features with a gradient boosted decision tree from the XGBoost library¶ . The loss function
is defined as the squared error with respect to the actual taxi time. The model hyperparameters and the number of
clusters defined in the gate encoding are tuned to improve the squared error.
 A baseline model can be executed at the same time as the predictive model. For instance, our current baseline
model groups flights by pair of runway and terminal and returns the average taxi time. This baseline model tests the
proper behavior and improvement in accuracy of the predictive model. All resulting metrics and plots are stored on the
MLFlow server along with information about the run (see Fig. 2).
 The MLFlow UI allows for quick comparison between models and selection of the best predictive model for each
airport for each taxi out pipeline (ramp, AMA, total). These models can be retrieved from the MLFlow server and
deployed as a microservice that then can be used by an orchestrator to compute schedules for a specific TRACON or
airport.

 IV. Results and Performance
 The unimpeded taxi out models were trained on data from June 1st 2019 to December 31st , 2019 at the KDFW and
KCLT airports. The total number of departing flights for each airports in this date range was about 220k and 170k
respectively. When filtering out incomplete data and impeded taxis, the remaining dataset contains about 47k and 20k
flights for the AMA and total taxi at KDFW and KCLT respectively and about 20k flights for the ramp taxi at both
airports. We split our data further, using 80% to train our models and 20% to test them.
 To assert the accuracy of our predictions, we calculated the median absolute deviation (multiplied by 1.4826 to
match a Gaussian 1 sigma spread, referred to simply as MAD throughout the rest of this paper) and the median value of
the residuals (predicted taxi time minus truth value). The median of the residuals informs us about the amount of bias
the model introduces, whereas the MAD indicates the precision of our estimate. The following results show accuracy
measurements on the test dataset. Calculating accuracy for unimpeded taxi time presents another challenge compared
to impeded taxi time: the true value of the taxi time is not clearly defined, since we do not know if a taxi is really
unimpeded. Whereas the model loss function minimizes the residuals with respect to the actual taxi time, we decided to
use the STBO (Surface Trajectory Based Operations) system estimates as truth values since they are available at KDFW
and KCLT and we believe that STBO unimpeded taxi time estimates are closer to the true unimpeded taxi time than the
actual taxi time.
 Table 1 summarizes the accuracy of our models, and demonstrates that the largest source of uncertainty seems to
come from the ramp area. The complexity of the ramp operation explains the difficulty in calculating a good estimate of
 ¶ https://xgboost.readthedocs.io

 5
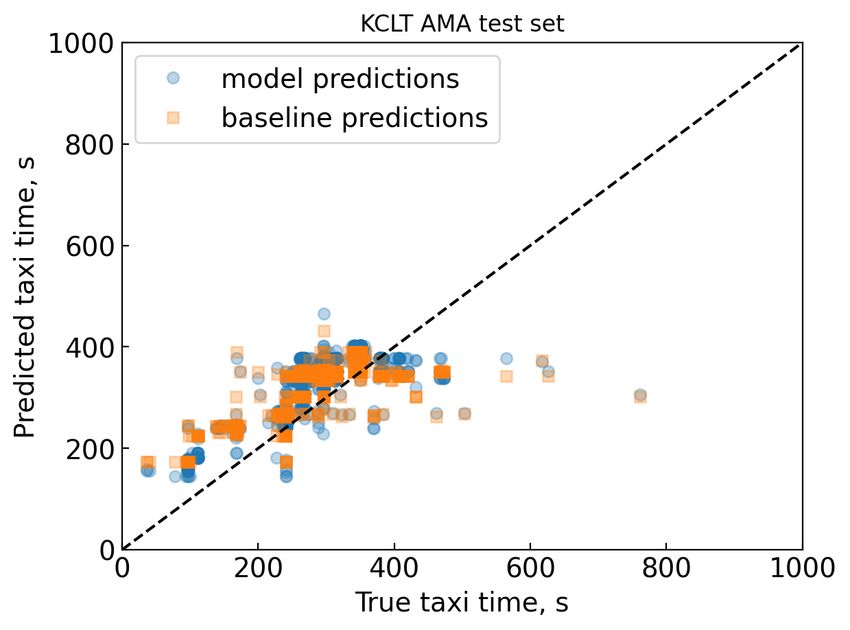
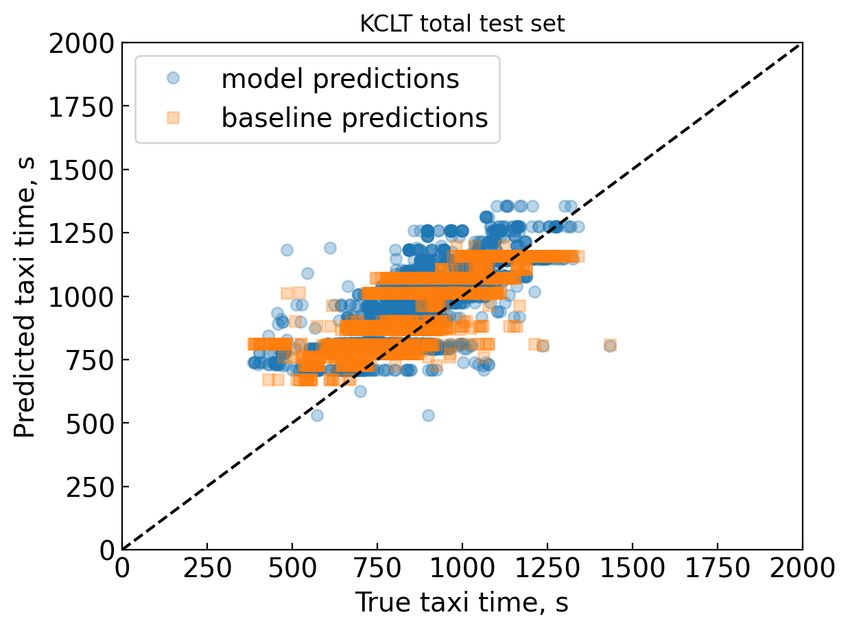
Table 1 Metrics of accuracy, median and MAD of residuals as compared to STBO predictions, as well as the
median taxi time from STBO for KDFW and KCLT airports. Negative median of the residuals indicate that the
estimates are smaller than the STBO predictions.

 KDFW KCLT
 Median Median
 Median [sec] MAD [sec] Median [sec] MAD [sec]
 Taxi [sec] Taxi [sec]
 ramp -6±2 80±2 401 62±3 98±5 522
 AMA 61±1 52±1 358 43±2 27±2 296
 total 95±3 113±4 786 93±4 91±4 808

Fig. 4 Histograms (in blue) of the residuals (in seconds, for ramp, AMA, total taxi from left to right) as defined
as the STBO estimated unimpeded taxi time (our truth values) minus the predictions from our ML model.
As a comparison, the residuals of the baseline model estimate is overplotted as the orange histograms. These
distributions include only the KDFW test dataset residuals.

Fig. 5 ML model predicted taxi times (in seconds for ramp, AMA, total taxi from left to right) vs truth values
(from STBO) for our KCLT test dataset (blue circles) and baseline model taxi times vs truth values (orange
squares).

the unimpeded ramp taxi time and could also imply some larger intrinsic spread of its true value. Another issue is that
we do not have reliable ASDE-X data in the ramp, preventing us from filtering our flights with the aircraft speed. The
training data for the ramp area might not be as free of unimpeded taxi as the training data used for the AMA taxi time
model. Overall the total taxi time has an relative uncertainty of 11 to 14%, the AMA taxi time has an relative uncertainty
of 9 to 14 % and the ramp taxi time has an relative uncertainty of about 20%. The models also have an overestimating
bias of about 1 to 1.5 minutes compared to the STBO estimates. This difference could be due to some impeded taxis
making it into our training data or it could be that the STBO system is underestimating unimpeded taxi time.
 Figure 4 & 5 show some additional insights into the model accuracy. Figure 4 presents the distribution of the ML

 6
model residuals (blue area), defined as the model prediction minus the values coming from the STBO, for the ramp,
AMA and total taxi at KDFW. In addition to the ML model predictions, the baseline model residuals (orange area) is
shown for comparison. On average, ML models perform about 20% better than baseline models. Figure 5 shows that this
improvement might be due to a lower discretization of the taxi time estimate, which can be seen as the orange horizontal
lines formed by the baseline orange dots. Another improvement is the ability of the ML model to predict more extreme
taxi time (especially longer taxi time). Both these effects reflect the inability of the baseline model to distinguish the
different taxi time of gates at the same terminal and the fact that the baseline model does not use the carrier information.
 While Fig. 4 shows that the residual distributions are fairly tight, AMA taxi time residuals at KDFW have some
large wings. After digging through our data, we discovered that most of the largest residuals in this distribution might be
due to a few unreliable STBO estimates, that for some reason are either very large or very small. For instance, Fig. 5
shows that some STBO unimpeded AMA taxi time at KCLT are less than 100 seconds. More work needs to be done to
improve the truth set and understand why the predictions differ from the true taxi time.
 In order to test if our model could be served to predict the current unimpeded taxi time estimate, we gathered data
from August 1st , 2020 to September 1st , 2020 as well as from February 5th , 2021 to April 21 , 2021. These data
come from our PostgreSQL database and not from the ML prediction live system, but they allow us to characterize the
performance degradation due to systemic change at the airport. One example of these changes is the median number of
departures, which for DFW goes from about 1050 in 2019 to about 750 in 2020 back to about 860 in 2021 for the date
range listed previously. Figure 6 shows how much the performance of the models degrades. Most taxi time uncertainties
increase by at most 10 to 15%, some biases could get as much as 30% larger (e.g. KCLT total taxi time).

Fig. 6 Evolution with time (datasets from 3 different years) of the median of the residuals with ±1 MAD error
bar for KDFW and KCLT using predictions from the 2019 trained model.

 To reduce the model degradation, models could be trained again on more recent data, however the fast changing
traffic volume might make the new models degrade again. Furthermore, a real true test of the model accuracy will come
when the unimpeded taxi out model predictions are computed in the live system.

 V. Conclusion
 In this paper, we showcased a machine learning service to calculate the unimpeded taxi out time using some
open-source frameworks that enable a simplified CI/CD (Continuous Integration/Continuous Deployment) process.
Though we developed the process with KCLT and KDFW airports, we limited the features to those which will be readily
available across the NAS through SWIM. The trained models have a 1 sigma uncertainty as measured with the median
absolute deviation mostly between 1 and 1.5 minutes and an overestimating bias also between 1 and 1.5 minutes. In
relative terms, the AMA and total taxi time have an uncertainty of about 10 to 15% whereas the ramp taxi time has
an uncertainty of about 20%. These models are currently deployed in a shadow live system for the Dallas - Ft Worth

 7
TRACON airports and feed a flight scheduler. The scheduler predictions as well as the service predictions that feed
it will be compared to the STBO system. This comparison will allow characterization of the accuracy of each ML
service in real-time predictions, as well as to check whether theses service predictions are accurate enough to produce
useful schedules for operational planning. A future parallel effort is to train these models for other airports in the NAS,
especially for airports in the North East Corridor, where deploying an accurate flight scheduler could provide substantial
value.

 References
 [1] Engelland, S. A., Capps, A., Day, K., Kistler, M. S., Gaither, F., and Juro, G., “Precision Departure Release Capability (PDRC)
 Final Report,” 2013.

 [2] Jung, Y., Hoang, T., Hayashi, M., Malik, W., Tobias, L., and Gupta, G., “Performance Evaluation of SARDA: An Individual
 Aircraft-Based Advisory Concept for Surface Management,” Air traffic control quarterly, Vol. 22, 2014, pp. 195–221.

 [3] Hayashi, M., Hoang, T., Jung, Y., Malik, W., Lee, H., and Dulchinos, V., “Evaluation of Pushback Decision-Support Tool
 Concept for Charlotte Douglas International Airport Ramp Operations,” 2015.

 [4] Jung, Y. C., Engelland, S. A., Capps, R. A., Coppenbarger, R., Hooey, B., Sharma, S., Stevens, L., Verma, S., Lohr, G. W.,
 Chevalley, E., Dulchinos, V., Malik, W., and Ruszkowski, L. M., “Airspace Technology Demonstration 2 (ATD-2) Phase 1
 Concept of Use (ConUse),” 2018.

 [5] “ACI releases preliminary 2016 world airport traffic rankings – Robust gains in passenger traffic at
 hub airports serving trans-Pacific and East Asian routes,” Tech. rep., Airports Council International,
 2017. Http://www.aci.aero/News/Releases/MostRecent/2017/04/19/ACI-releases-preliminary-2016-world-airport-traffic-
 rankingsRobustgains-in-passenger-traffic-at-hub-airports-serving-transPacific-and-East-Asian-routes.

 [6] Jung, Y., Coupe, W. J., Capps, A., Engelland, S. A., and Sharma, S., “Field Evaluation of the Baseline Integrated Arrival,
 Departure, Surface Capabilities at Charlotte Douglas International Airport,” 2019. 13th USA/Europe ATM R&D Seminar
 (ATM2019), Vienna, Austria, 17-21 June 2019.

 [7] Gorman, S. M., Burke, J. M., Robeson, I. J., and Phipps, B. S., “Fuser Deeper Dive (Mediation & Use Cases),” 2019.

 [8] Shumsky, R. A., “Dynamic statistical models for the prediction of aircraft take-off times,” Ph.D. thesis, Massachusetts Institute
 of Technology, 1995.

 [9] Hebert, J. E., and Dietz, D. C., “Modeling and analysis of an airport departure process,” Journal of Aircraft, Vol. 34, No. 1,
 1997, pp. 43–47.

[10] Cheng, V., and Foyle, D., “Automation tools for enhancing ground-operation situation awareness and flow efficiency,” AIAA
 Guidance, Navigation, and Control Conference and Exhibit, 2002, p. 4856.

[11] Smeltink, J., Soomer, M., de Waal, P., and van der Mei, R., “Optimisation of airport taxi planning,” 2003.

[12] Visser, H., and Roling, P., “Optimal airport surface traffic planning using mixed integer linear programming,” AIAA’s 3rd
 Annual Aviation Technology, Integration, and Operations (ATIO) Forum, 2003, p. 6797.

[13] Cheng, V., “Airport surface operation collaborative automation concept,” AIAA Guidance, Navigation, and Control Conference
 and Exhibit, 2003, p. 5773.

[14] Soomera, J., de Waalc, P., and van der Meib, R., “An optimisation model for airport taxi scheduling,” Oper. Res, Vol. 1, 2004.

[15] Jung, Y., and Monroe, G., “Development of Surface Management System integrated with CTAS arrival tool. In proceedings
 of the 5th AIAA Aviation Technology, Integration, and Operations Conference, Arlington, VA, September 2005,” Tech. rep.,
 Report AIAA-2005-7334, ????

[16] Simaiakis, I., and Balakrishnan, H., “Queuing models of airport departure processes for emissions reduction,” AIAA Guidance,
 Navigation, and Control Conference, 2009, p. 5650.

[17] Lee, H., Malik, W., Zhang, B., Nagarajan, B., and Jung, Y. C., “Taxi time prediction at Charlotte Airport using fast-time
 simulation and machine learning techniques,” 15th AIAA Aviation Technology, Integration, and Operations Conference, 2015, p.
 2272.

 8
[18] Ravizza, S., Atkin, J. A., Maathuis, M. H., and Burke, E. K., “A combined statistical approach and ground movement model for
 improving taxi time estimations at airports,” Journal of the Operational Research Society, Vol. 64, No. 9, 2013, pp. 1347–1360.

[19] Jordan, R., Ishutkina, M. A., and Reynolds, T. G., “A statistical learning approach to the modeling of aircraft taxi time,” 29th
 Digital Avionics Systems Conference, IEEE, 2010, pp. 1–B.

[20] Srivastava, A., “Improving departure taxi time predictions using ASDE-X surveillance data,” 2011 IEEE/AIAA 30th Digital
 Avionics Systems Conference, IEEE, 2011, pp. 2B5–1.

[21] Kistler, M., and Gupta, G., “Relationship between airport efficiency and surface traffic,” 9th AIAA Aviation Technology,
 Integration, and Operations Conference (ATIO) and Aircraft Noise and Emissions Reduction Symposium (ANERS), 2009, p.
 7078.

[22] Lee, H., Malik, W., and Jung, Y. C., “Taxi-out time prediction for departures at Charlotte airport using machine learning
 techniques,” 16th AIAA Aviation Technology, Integration, and Operations Conference, 2016, p. 3910.

[23] Herrema, F., Curran, R., Visser, H., Huet, D., and Lacote, R., “Taxi-out time prediction model at Charles de Gaulle Airport,”
 Journal of Aerospace Information Systems, Vol. 15, No. 3, 2018, pp. 120–130.

[24] Ravizza, S., Chen, J., Atkin, J. A., Stewart, P., and Burke, E. K., “Aircraft taxi time prediction: comparisons and insights,”
 Applied Soft Computing, Vol. 14, 2014, pp. 397–406.

[25] Chatterji, G., and Zheng, Y., “Wheels-off time prediction using surface traffic metrics,” 12th AIAA Aviation Technology,
 Integration, and Operations (ATIO) Conference and 14th AIAA/ISSMO Multidisciplinary Analysis and Optimization Conference,
 2012, p. 5699.

[26] Yin, J., Hu, Y., Ma, Y., Xu, Y., Han, K., and Chen, D., “Machine learning techniques for taxi-out time prediction with a
 macroscopic network topology,” 2018 IEEE/AIAA 37th Digital Avionics Systems Conference (DASC), IEEE, 2018, pp. 1–8.

[27] Lee, H., Coupe, J., and Jung, Y. C., “Prediction of Pushback Times and Ramp Taxi Times for Departures at Charlotte Airport,”
 AIAA Aviation 2019 Forum, 2019, p. 2933.

[28] Balakrishna, P., Ganesan, R., and Sherry, L., “Accuracy of reinforcement learning algorithms for predicting aircraft taxi-out
 times: A case-study of Tampa Bay departures,” Transportation Research Part C: Emerging Technologies, Vol. 18, No. 6, 2010,
 pp. 950–962.

[29] Du, J., Hu, M., and Zhang, W., “Decision Support for Aircraft Taxi Time based on Deep Metric Learning,” 2020 IEEE 23rd
 International Conference on Intelligent Transportation Systems (ITSC), IEEE, 2020, pp. 1–7.

[30] Capelleras, L., “Additional Taxi-Out Time Performance Indicator Document,” Tech. rep., EUROCONTROL/PRU, 2015.
 Https://ansperformance.eu/library/pru-tx-out-pi.pdf.

[31] Jeong, M., Eun, Y., Jeon, D., and Bang, H., “Unimpeded Taxi-Time Prediction Based on the Node–Link Model,” Journal of
 Aerospace Information Systems, Vol. 17, No. 10, 2020, pp. 591–602.

[32] “The EUROCONTROL DMAN Prototype–Description of DMAN in the A-CDM Context,” Tech. rep., European Org. for the
 Safety of Air Navigation, Dec. 2010. 0.4 ed.

 9
You can also read