COVID-19: Development of A Robust Mathematical Model and Simulation Package with Consideration for Ageing Population and Time Delay for Control Action
←
→
Page content transcription
If your browser does not render page correctly, please read the page content below
COVID-19: Development of A Robust Mathematical
                                             Model and Simulation Package with Consideration for
                                             Ageing Population and Time Delay for Control Action
                                                             and Resusceptibility
arXiv:2004.01974v3 [q-bio.PE] 20 Apr 2020

                                                                       Kok Yew Nga,∗, Meei Mei Guib
                                              a
                                                  Nanotechnology and Integrated BioEngineering Centre (NIBEC), Ulster University,
                                                         Jordanstown Campus, Shore Road, Newtownabbey BT37 0QB, UK.
                                                   b
                                                     School of Chemistry and Chemical Engineering, David Keir Building, Queen’s
                                                             University Belfast, Stranmillis Road, Belfast BT9 5AG, UK.

                                            Abstract
                                            The current global health emergency triggered by the COVID-19 pandemic
                                            is one of the greatest challenges mankind face in this generation. Computa-
                                            tional simulations have played an important role to predict the development
                                            of the current pandemic. Such simulations enable early indications on the
                                            future projections of the pandemic and is useful to estimate the efficiency of
                                            control action in the battle against the SARS-CoV-2 virus. The SEIR model
                                            is a well-known method used in computational simulations of infectious viral
                                            diseases and it has been widely used to model other epidemics such as Ebola,
                                            SARS, MERS, and influenza A. This paper presents a modified SEIRS model
                                            with additional exit conditions in the form of death rates and resusceptibiliy,
                                            where we can tune the exit conditions in the model to extend prediction on
                                            the current projections of the pandemic into three possible outcomes; death,
                                            recovery, and recovery with a possibility of resusceptibility. The model also
                                            considers specific information such as ageing factor of the population, time
                                            delay on the development of the pandemic due to control action measures,
                                            as well as resusceptiblity with temporary immune response. Owing to huge
                                            variations in clinical symptoms exhibited by COVID-19, the proposed model

                                               ∗
                                               Corresponding author.
                                               Email addresses: mark.ng@ulster.ac.uk (Kok Yew Ng), m.gui@qub.ac.uk (Meei
                                            Mei Gui)

                                            Preprint submitted to Elsevier                                           April 22, 2020
aims to reflect better on the current scenario and case data reported, such
that the spread of the disease and the efficiency of the control action taken
can be better understood. The model is verified using two case studies for
verification and prediction studies, based on the real-world data in South
Korea and Northern Ireland, respectively.
Keywords: COVID-19, Coronavirus, Respiratory disease, SEIR, SEIRS,
Resusceptibility, Time delay, Modelling, Simulation
1. Introduction
The coronavirus disease COVID-19 is a respiratory infection disease caused
by the novel coronavirus, SARS-CoV-2. The first COVID-19 outbreak was
reported in Wuhan of Hubei Province, China at the end of December 2019.
Within just two months, the disease has rapidly spread across the world and
it has been declared a global pandemic in early March 2020. As of 7th April
2020, the virus has affected close to 15 million people with more than 82,000
confirmed deaths across at least 184 countries [1].
The symptoms caused by the SARS-CoV-2 virus have large variations
with most people only experiencing mild to moderate respiratory illnesses
and only a smaller group of people would develop complications of respira-
tory failure or acute respiratory distress syndrome. Based on clinical data
reported from Wuhan where the outbreak began, elderly patients have been
identified to have higher odds to experience severe symptoms with higher
mortality rate compared to people of younger age [2]. Study also shows
that up to approximately 80% of the people infected with SARS-CoV-2 are
asymptomatic carriers, i.e. they experience no or mild symptoms but are
still able to transport the virus to others [3]. This has caused the detection
and containment of the SARS-CoV-2 virus to be much more challenging. As
a result, social distancing has been widely implemented in many countries
worldwide to slow down the transportation of the virus through minimised
human-to-human contact. Individuals who have recovered from COVID-19
after experiencing mild or moderate symptoms are more likely to develop
temporary resistant towards the virus and are unlikely to experience severe
respiratory illnesses [4]. However, in rare occasions, there have been clini-
cal findings showing that patients who have recovered from the disease have
been reinfected. For instance, in February 2020, a patient in Osaka, Japan,
has been tested positive towards the SARS-CoV-2 a few days after being
2discharged from the hospital for treatment with the disease [5]. Due to very
limited knowledge on the immune response of humans to this novel virus,
the possibility of reinfection cannot be ruled out at the moment.
The SEIR (Susceptible-Exposed-Infected-Removed/Recovered) model has
been widely reported during the past decades in quantitative modelling stud-
ies of infectious epidermic/pandemic, such as the severe acute respiratory
syndrome (SARS) in 2002 [6], the influenza A (pH1N1) pandemic in 2009
[7], the Middle East respiratory syndrome (MERS) pandemic in 2013 [8], as
well as the latest Ebola outbreak in 2018 [9]. The SEIR model represents a
typical infectious epidemic disease using four distinctive phases; susceptible
(S) represents the population that has yet to be infected by the virus; ex-
posed (E) represents the number of individuals exposed to the virus; infected
(I) models the number of people infected, have demonstrated symptoms, and
are able to spread the virus to the people in the S compartment; and lastly,
recovered/removed (R) models the number of people who have recovered and
are assumed to have immune response towards the virus [10, 11, 12]. Thus,
based on the model, the S compartment will slowly deplete as the outbreak
prolongs further, and the virus will eventually die out due to insufficient pop-
ulation within the S compartment. This compartmental modelling method
allows transport of population from one compartment to another, where the
disease transmission rates with respect to time can be simulated.
In this work, we propose a modified SEIRS model based on the SIR model
by Kermack-McKendrick [13] with consideration for resusceptibility to the
virus after recovery. In this model, the probability of a recovered patient
to be reinfected with SARS-CoV-2 is taken into consideration to predict the
future projection of COVID-19 cases. Resusceptibility is one of the crucial
keys that could possibility lead to a prolonged COVID-19 pandemic. The
consideration of resusceptibility is an important highlight in this paper as it
has rarely been considered in the SEIR models reported thus far [14, 12, 15].
Other than that, we also included information such as demographic details
for the ageing population, who seem to experience a higher rate of fatality
due to COVID-19 [16]. Time delay in the control action representing the
time taken for the authorities to act on the virus and also the duration of
short-term immunity after recovery, which may lead to resusceptibility, are
also considered in the model. The time delay factor is applied to enhance the
robustness and accuracy of the model and simulation, hence to better reflect
on the timely situation with specific measures to control the transmission of
the disease.
3This paper is organised as follows: Section 2 presents the development
of the mathematical model; Section 3 presents the design of the simulation
package using the Matlab/Simulink environment; Section 4 provides the re-
sults and discussions on the model using case studies with real-world data;
and Section 5 concludes the paper.
2. Mathematical Modelling of The COVID-19 Using Modified SEIRS
First, let’s consider the modified SEIRS model system below,
dS(t) βI(t)S(t) βI(t − τσ )S(t − τσ )
= Λ − µS(t) − +σ + Rs (t, τξ ), (1)
dt N N
dE(t) βI(t)S(t) βI(t − τσ )S(t − τσ )
= −σ − (µ + α)E(t), (2)
dt N N
dI(t)
= (µ + α)E(t) − (γ + µ)I(t)
dt (3)
− δ [(1 − κold )Nold + (1 − κ)(1 − Nold )] I(t),
dR(t)
= (γ + µ)I(t) − µR(t) − Rs (t, τξ ), (4)
dt
dD(t)
= δ [(1 − κold )Nold + (1 − κ)(1 − Nold )] I(t), (5)
dt
where N, S(t), E(t), I(t), R(t), and D(t) represent the stock population, sus-
ceptible, exposed, infected, recovered/removed, and deaths compartments,
respectively. It is established that S(t) + E(t) + I(t) + R(t) + D(t) = N .
The constant Λ is the birth rate in the overall population and µ is the death
rate due to conditions other than COVID-19. The parameter β is the rate
of transmission per S-I contact, α is the rate of which an exposed person
becomes infected, and γ is the recovery rate. Therefore, the incubation and
recovery times are τinc = α1 and τrec = γ1 , respectively. The basic reproduction
number can be expressed using
α β
R0 = . (6)
µ+αµ+γ
The constant σ is the efficiency of the control action. It has a direct effect
on the reproduction number, such that the new reproduction number with
the control action is Rt = (1 − σ)R0 . The time delay τσ = τpre−σ + τpost−σ
indicates the time taken for the control action to take effect in flattening the
4infection curve, where τpre−σ ≥ 0 represents the time to initiate the control
action after the first confirmed case at t = 0, and τpost−σ ≥ 0 represents
the time after the control action has been initiated but before the effects are
evidenced in the outputs of the system. In practical scenarios, τpost−σ can
be used to model the delay for the population to effectively respond to the
rules introduced by the control action, such as social distancing, isolation,
and lockdown.
In the worst case scenario where the patient does not recover from the
virus, we model the fatality rate with influence of the fraction of elderly
population (above 65 years of age) within the community Nold , where the
percentages of non-elderly and elderly who recovered are κ and κold , respec-
tively. The time spent hospitalised or infected in fatal cases is τhosp = 1δ . In
this paper, we establish that τhosp = τrec , assuming that patients spend the
same amount of time hospitalised or infected, whether they recover from the
virus or not.
The function Rs (t, τξ ) represents the resusceptible stock, which can be
computed from the recovered population using
Rs (t, τξ ) = ξR(t − τξ ), (7)
where ξ is the percentage of the recovered population who are resusceptible
and the time delay τξ ≥ 0 represents the duration of temporary immune
response of the recovered population. The number of recovered cases can be
expressed using
Rc (t) = R(t) − Rs (t, τξ ). (8)
In an ideal situation where population who recovered develop permanent
immunity against the virus, ξ = 0 and τξ → ∞. As a result, (7) becomes
Rs (t, ∞) = 0 and subsequently, (8) can be rewritten as Rc (t) = R(t).
For the model used in the simulation package presented in this paper,
we assume a closed population with negligible birth and death rates, i.e.
5Figure 1: The block diagram of the proposed SEIRS system used in the simulation package.
Λ = 0, µ = 0. As a result, the system (1)(5) becomes
dS(t) βI(t)S(t) βI(t − τσ )S(t − τσ )
=− +σ + Rs (t, τξ ), (9)
dt N N
dE(t) βI(t)S(t) βI(t − τσ )S(t − τσ )
= −σ − αE(t), (10)
dt N N
dI(t)
= αE(t) − γI(t) − δ [(1 − κold )Nold + (1 − κ)(1 − Nold )] I(t), (11)
dt
dR(t)
= γI(t) − Rs (t, τξ ), (12)
dt
dD(t)
= δ [(1 − κold )Nold + (1 − κ)(1 − Nold )] I(t), (13)
dt
β
and the basic reproduction number in (6) becomes R0 = γ
. The block
diagram of the proposed SEIRS model is shown in Figure 1.
3. Description of The Simulation Package
Figure 2 shows the graphical user interface (GUI) of the simulation pack-
age developed using the Matlab/Simulink environment. Users can use this
interface to set preferred settings for the simulation and also to view simula-
tion results. The simulation kit can be downloaded from https://github.
com/nkymark/COVIDSim.
3.1. Establishing Simulation Settings
At the top section of the GUI are some interactive interfaces available for
the user to set key simulation settings, which include the following:
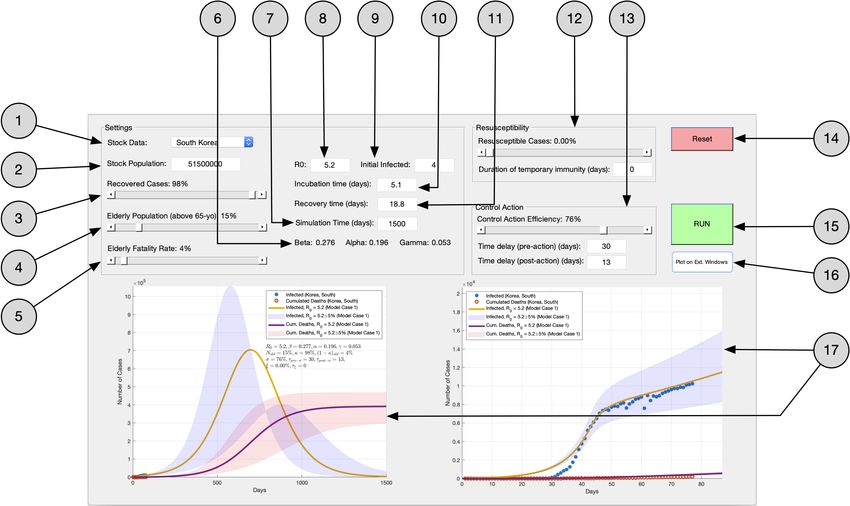
6Figure 2: The main graphical user interface of the simulation package in Matlab. 1 Load
real-world data for the selected country. 2 Set the stock population N for simulation.
3 Set the percentage of recovered cases κ. 4 Set the fraction of elderly population Nold .
5 Set the fatality rate for the elderly population (1 − κold ). 6 Computed values for
1 1
β = R0 γ, α = τinc , and γ = τrec using values entered for R0 , τinc , and τrec . 7 Set the
simulation time in days. 8 Set the value for the basic reproduction number R0 . 9 Set the
initial number of infected cases I(0). 10 Set the incubation time τinc . 11 Set the recovery
time τrec . 12 Settings for recusceptibility, including the percentage of resusceptible cases
ξ and duration of temporary immunity τξ . 13 Settings for control action, including the
effeciency rate σ as well as the time delay during pre- and post-control action, τpre−σ
and τpost−σ , respectively. 14 Reset the GUI and clear all plots. 15 Run the simulation.
16 Recreate the graphs on external Matlab figure windows. 17 Graphical plots from the
simulation (left figure for overall simulation while right figure compare initial projections
of the model with real-world data).
• General Settings:
– Stock Data: Use this to load real-world data of select countries.
The data are obtained from [1].
– Stock Population: The stock population N is entered here.
– Recovered Cases: Use this to set the percentage of recovered cases
κ.
7– Elderly Population: Use this to set the fraction of elderly popula-
tion (above 65 years of age) Nold .
– Elderly Fatality Rate: Use this to set the fatality rate (1 − κold )
for the elderly population.
– SEIR Parameters: Use this to set the values for R0 , τinc , τrec , the
initial infected cases I(0), and the simulation time.
• Resusceptibility Settings:
– Resusceptible Cases: Use this to set the percentage of recovered
cases who are resusceptible.
– Duration of temporary immunity: Use this to set the time of short-
term immune response τξ , assuming there is no permanent immu-
nity after recovery.
• Control Action Settings:
– Control Action Efficiency: Use this to set the percentage of control
action efficiency σ.
– Pre-action Time Delay: Use this to set the time delay τpre−σ for
the control action to be introduced after the first confirmed case.
– Post-action Time Delay: Use this to set the time delay τpost−σ
to mimic the time it takes for the population to respond to the
control action.
3.2. Simulation Results
The simulation results are displayed at the bottom section of the GUI.
The plot on the right shows the initial fit of the model using the settings
established in Section 3.1 onto the real-world data of the select country,
while the plot on the left shows the simulation results until the simulation
stop time.
4. Case Studies
4.1. Case Study 1: Verification using Data in South Korea
South Korea is used as a case study due to the amount of data available
given that it is one of the first few countries to be directly affected by the
8virus outside of China. Its first confirmed case was reported on 20th January
2020 [17]. The other reason is that South Korea is also one of the very few
countries that managed to effectively flatten the COVID-19 infection curve
and it has set itself apart from others in leading the fight against COVID-19,
at least for the moment. For example, the country started vigorous testing
among its population with contact tracing, especially those of confirmed and
suspected cases during the early stage of the epidemic. The government
accomplished this by maintaining a public database keeping track of mobile
phones, credit cards, and other data of patients who tested positive [18].
Also, on 16th March 2020, the authorities in the country began screening
every person, both domestic and international, who arrived at its airports.
As of 7th April 2020, there have been 10,331 confirmed cases and 192
fatalities in South Korea [1]. As a result, we used the following parameters for
our simulation. First, we assumed that the population of South Korea to be
approximately N = 515×106 with an elderly population of about 15% (Nold =
015) [19]. We then set the percentage of recovery to be 98% (κ = 098) for the
general public [1] and a fatality rate of 8% ((1 − κold ) = 008) for the elderly
[20]. We then assumed the incubation time and recovery time to be τinc = 51,
and τrec = 188, respectively in accordance with [21]. The basic reproduction
number was set to R0 = 52 (95% CI: 504–536) based on the early growth-
rate of the epidemic in South Korea. The initial infected and exposed cases
were assumed to be I(0) = 4 and E(0) = 20I(0), respectively. See Table
1. Figure 3a shows the results of the initial fitting of the model based on
the data in South Korea while Figure 3b shows the projections of the model
when no control action is taken. There are some minor discrepancies between
the modelled values and the real-world data during the initial stage of the
simulation as seen in Figure 3a. This is absolutely reasonable and acceptable
while modelling an actual epidemic as most countries are still coming to terms
with the virus during the first month and the data do not usually represent
the actual number of cases due to lack of testing for confirmed cases.
Once we have the initial fitting of the model, we introduced control action
in line with the mitigation and preventive measures taken by the government.
Due to the aforementioned vigorous testing, contact tracing, and isolation
efforts taken, we assumed that the control action has an efficiency of 76% (σ =
076). As a result, the reproduction number could be reduced to Rt ≈ 125. We
also assumed that there was a time delay of 30 days since the first confirmed
case before the control action was introduced (τpre−σ = 30) and a further
delay of approximately 13 days before the control action could be properly
9Table 1: Initial parameters used to fit the model to the data in South Korea.
Parameter Value
Stock population, N 515×106
Fraction of elderly population, Nold 015
Percentage of recovery, κ 098
Fatality rate for elderly, 1 − κold 008
Incubation time, τinc 51 days
Recovery time, τrec 188 days
Basic reproduction number, R0 52 (95% CI: 504–536)
Initial infected cases, I(0) 4
Initial exposed cases, E(0) 80
(a) (b)
Figure 3: The left subfigure shows the initial fitting of the model onto the data in South
Korea and the right subfigure shows the projections of the model when no control action
is taken.
executed in the community (τpost−σ = 13). Figure 4 shows the simulation
results. Figure 4a shows that the trajectory of the modelled infected and
death cases match the real-world data after the control action was introduced.
Figure 4b shows the simulation results until the model stabilises assuming
no subsequent control action being taken to further reduce the reproduction
number. Comparing Figure 4b with Figure 3b, the peak of the number of
infected cases could be reduced from about 19 million cases to about 700,000
cases.
10(a) (b)
Figure 4: The left subfigure shows the initial fitting of the model onto the data in South
Korea and the right subfigure shows the projections of the model when control action with
an efficiency of 76% is taken.
4.1.1. Simulation with Resusceptibility
One of the many uncertainties about the COVID-19 is whether patients
who have recovered from the virus will be reinfected in the future. There
have been reports in the news that patients who recovered from the virus were
tested positive for a second time after being cleared of the virus [5, 22, 23]. On
the other hand, most health authorities believe that patients who recovered
may develop an immunity towards the virus. However, it is not sure if the
said immunity is short-term or long-term and further research is required to
provide clinical proofs to this hypothesis.
As such, we repeated the simulation for the Case Study on South Korea
without control action, but with the inclusion of a possibility of resuscepti-
bility. Here, we assumed that 1% of the patients who recovered are resuscep-
tible towards the virus (ξ = 001), where the patients develop a temporary
immunity of τξ = 0, 30, 90, 360 days, respectively after recovering from the
initial infection of the virus. Figure 5 shows the simulation results, where
the first infection spikes shown in all subfigures are synonymous to the re-
sult presented in Figure 3b. The subsequent infection spikes are the result
of resusceptibility, depending on the days of temporary immune response.
The results show new surges in infection cases after the specific τξ in each
case, which diminish over time as more people develop immunity towards
the virus. Interestingly, for the result shown in Figure 5d where τξ = 360
11(a) (b)
(c) (d)
Figure 5: Trajectories for the infected and fatalities in South Korea due to resusceptibility
where it is assumed that 1% of the recovered cases are reinfected after a time span of
temporary immunity of (a) 0 day, (b) 30 days, (c) 90 days, and (d) 360 days, respectively.
However, these results only apply assuming that if there is no control action being taken
to flatten the curve.
days, it could also be used to reflect on the situation where the virus may
exhibit similar characteristics as the seasonal flu or the pandemic influenza
A (pH1N1) that it is most likely active during certain seasons of the year,
e.g. autumn/winter for the seasonal flu and spring/summer for the pH1N1,
in which case an annual vaccine administration is necessary [24, 25].
4.2. Case Study 2: Prediction using Data in Northern Ireland
Given the location of which this research is based, data in Northern Ire-
land is used for prediction study of the model. Laboratory reports on daily
confirmed tests and deaths are obtained from the Regional Virus Labora-
tory, the Northern Health and Social Care Trust (NHSCT), and the South-
12Table 2: Initial parameters used to fit the model to the data in Northern Ireland.
Parameter Value
Stock population, N 188×106
Fraction of elderly population, Nold 018
Percentage of recovery, κ 094
Fatality rate for elderly, 1 − κold 012
Incubation time, τinc 51 days
Recovery time, τrec 188 days
Basic reproduction number, R0 5 (95% CI: 485–515)
Initial infected cases, I(0) 3
Initial exposed cases, E(0) 60
ern Health and Social Care Trust (SHSCT). The reports are then published
daily since 24th March 2020 by the Northern Ireland Public Health Agency
(PHA) via their Daily COVID-19 Surveillance Reports [26]. The first con-
firmed case was recorded on 27th February 2020, and as of 7th April 2020,
the total number of confirmed cases stood at 1,255 with 73 fatalities.
We used the parameters in Table 2 for the initial fitting of the model
based on the data from PHA on the initial growth-rate of the epidemic in
Northern Ireland. Figure 6a shows the results of the initial fitting, with
Figure 6b depicting the projections of the infected and deaths if no control
action is taken. We then simulated the model based on the control action
carried out; most schools in Northern Ireland were closed beginning 18th
March 2020 followed by a national lockdown initiated by the United Kingdom
government on the 23rd March 2020. As such, we set τpre−σ = 20 (20 days)
to correspond to said dates since the first confirmed case, and assuming that
it took a further approximately 12 days for the public to respond to these
control action, i.e. τpost−σ = 12, we obtained the simulation results as shown
in Figure 7. The results show that in order for the model to follow the
projected trajectories of the data from PHA in Figure 7a, the control action
have to achieve an efficiency of about 45% (σ = 045), which indicates that
the reproduction number could be reduced to Rt ≈ 275. Comparing Figure
6b with Figure 7b, the peak of the number of infected cases could be reduced
from 650,000 cases to 350,000 cases.
13(a) (b)
Figure 6: The left subfigure shows the initial fitting of the model onto the data in Northern
Ireland and the right subfigure shows the projections of the model when no control action
is taken.
(a) (b)
Figure 7: The left subfigure shows the initial fitting of the model onto the data in Northern
Ireland and the right subfigure shows the projections of the model when control action
with an efficiency of 45% is taken.
4.2.1. Further Control Action To Meet Critical Care Capacity
However, based on the results shown in Figure 7, it is essential to further
flatten this curve due to the limit of about 330 critical care beds available
in Northern Ireland (100 initial setup + 230 introduced by the newly built
Nightingale hospital) [27]. According to the Intensive Care National Audit
& Research Centre (ICNARC) with its “Report on 2249 patients critically ill
14with COVID-19” dated 4th April 2020, about 6% of those tested positive for
the SARS-CoV-2 required critical care [28]. Meanwhile in Italy, as of 29th
March 2020, up to 12% of all positive cases were admitted to the intensive
care unit (ICU) [29]. As such, should we assume that approximately 10%
of those tested positive in Northern Ireland would require ICU admission,
then the peak of the infection curve should not exceed 3,300 cases, i.e. more
control action have to be taken to reduce the peak of 350,000 cases as seen
in Figure 7b.
Therefore, on day 38, which is about one week after the infection curve
started to flatten due to the first control action, a second control action
was introduced into the model. This second control action also reflects on
the announcement made by the United Kingdom government in early April
2020 to allow police officers to enforce social distancing measures. Assuming
that this second control action results in a further efficiency of 65%, the
reproduction number could then be reduced to Rt ≈ 096. Assuming that
it would take another 7 days for the public to fully respond to the control
action, we could observe the results as shown in Figure 8. With the initiation
of the second control action, it can be seen in Figure 8a that the peak in
the infection curve is now reduced to 2,500 cases. As such, the critical care
capacity should be able to meet the demand for treatment based on the same
assumption made earlier in this section, where it is estimated about 10% of
the infected cases are admitted to the ICU. Another observation worth noting
is that the number of deaths in the worst case scenario has also been reduced
to about 2,750 cases. See Figure 8b. This value echos the projection made
by the government in Northern Ireland that the COVID-19 would lead to
3,000 deaths during the first wave [30].
5. Conclusion
This paper has presented a robust model for the COVID-19 based on a
modified SEIRS method to include considerations for the ageing population,
and time delay for control action as well as resusceptibility of the recovered
population due to temporary immunity. A simulation package was developed
using the Matlab/Simulink environment to ease understanding on the spread
of the virus as well as the efficiency that needs to be achieved by the control
action in order to successfully flatten the infection curve to not overload the
healthcare capacity. Two case studies using real-world data were presented
in this research; the first case for verification of the model based on the data
15(a) (b)
Figure 8: The left subfigure shows the initial projections of the infected and cumulated
deaths curves in Northern Ireland after the second control action with an efficiency of
65% was introduced on day 38 of the model. The right subfigure shows the remaining
projections of the model.
in South Korea including a study on the possibility of resusceptibility of
recovered population; and the second case for prediction study of the model
using data and up-to-date control action and related events in Northern
Ireland.
References
[1] E. Dong, H. Du, L. Gardner, An interactive web-based dashboard to
track COVID-19 in real time, The Lancet Infectious Diseases (2020).
doi:10.1016/S1473-3099(20)30120-1.
[2] F. Zhou, T. Yu, R. Du, G. Fan, Y. Liu, Z. Liu, J. Xiang, Y. Wang,
B. Song, X. Gu, L. Guan, Y. Wei, H. Li, X. Wu, J. Xu, S. Tu, Y. Zhang,
H. Chen, B. Cao, Clinical course and risk factors for mortality of adult
inpatients with COVID-19 in Wuhan, China: a retrospective cohort
study, The Lancet 395 (10229) (2020) 1054–1062. doi:https://doi.
org/10.1016/S0140-6736(20)30566-3.
[3] E. Prompetchara, C. Ketloy, T. Palaga, Immune responses in COVID-
19 and potential vaccines: Lessons learned from SARS and MERS epi-
demic, Asian Pacific Journal of Allergy and Immunology 38 (2020) 1–9.
doi:10.12932/AP-200220-0772.
16[4] I. Thevarajan, T. H. O. Nguyen, M. Koutsakos, J. Druce, L. Caly, C. E.
van de Sandt, X. Jia, S. Nicholson, M. Catton, B. Cowie, S. Y. C. Tong,
S. R. Lewin, K. Kedzierska, Breadth of concomitant immune responses
prior to patient recovery: a case report of non-severe COVID-19, Nature
Medicine (2020). doi:10.1038/s41591-020-0819-2.
[5] Questions raised over COVID-19 reinfection after Japanese woman de-
velops illness again, The Japan Times (2020-02-28).
URL https://www.japantimes.co.jp/news/2020/02/28/national/
coronavirus-reinfection/
[6] C. Dye, N. Gay, Modeling the SARS Epidemic, Science 300 (5627) (2003)
1884–1885. doi:10.1126/science.1086925.
[7] M. M. Saito, S. Imoto, R. Yamaguchi, H. Sato, H. Nakada, M. Kami,
S. Miyano, T. Higuchi, Extension and verification of the SEIR model on
the 2009 influenza A (H1N1) pandemic in Japan., Math Biosci 246 (1)
(2013) 47–54. doi:10.1016/j.mbs.2013.08.009.
[8] G. Chowell, S. Blumberg, L. Simonsen, M. A. Miller, C. Viboud, Syn-
thesizing data and models for the spread of MERS-CoV, 2013: key role
of index cases and hospital transmission., Epidemics 9 (2014) 40–51.
doi:10.1016/j.epidem.2014.09.011.
[9] P. Diaz, P. Constantine, K. Kalmbach, E. Jones, S. Pankavich, A mod-
ified SEIR model for the spread of Ebola in Western Africa and met-
rics for resource allocation, Applied Mathematics and Computation 324
(2018) 141–155. doi:10.1016/j.amc.2017.11.039.
[10] Q. Lin, S. Zhao, D. Gao, Y. Lou, S. Yang, S. S. Musa, M. H. Wang,
Y. Cai, W. Wang, L. Yang, D. He, A conceptual model for the coron-
avirus disease 2019 (COVID-19) outbreak in Wuhan, China with individ-
ual reaction and governmental action, International Journal of Infectious
Diseases 93 (2020) 211–216. doi:10.1016/j.ijid.2020.02.058.
[11] L. R. Lopez, X. Rodo, A modified SEIR model to predict the COVID-
19 outbreak in Spain: simulating control scenarios and multi-scale epi-
demics, medRxiv (2020). doi:10.1101/2020.03.27.20045005.
[12] A. J. Kucharski, T. W. Russell, C. Diamond, Y. Liu, J. Edmunds,
S. Funk, R. M. Eggo, F. Sun, M. Jit, J. D. Munday, N. Davies,
17A. Gimma, K. van Zandvoort, H. Gibbs, J. Hellewell, C. I. Jarvis,
S. Clifford, B. J. Quilty, N. I. Bosse, S. Abbott, P. Klepac, S. Flasche,
Early dynamics of transmission and control of COVID-19: a mathe-
matical modelling study, The Lancet Infectious Diseases (2020). doi:
10.1016/S1473-3099(20)30144-4.
[13] W. O. Kermack, A. G. McKendrick, A contribution to the mathematical
theory of epidemics, Proceedings of The Royal Society of London. Series
A, Containing papers of a mathematical and physical character 115 (772)
(1927) 700–721.
[14] K. Prem, Y. Liu, T. W. Russell, A. J. Kucharski, R. M. Eggo, N. Davies,
S. Flasche, S. Clifford, C. A. B. Pearson, J. D. Munday, S. Abbott,
H. Gibbs, A. Rosello, B. J. Quilty, T. Jombart, F. Sun, C. Diamond,
A. Gimma, K. van Zandvoort, S. Funk, C. I. Jarvis, W. J. Edmunds, N. I.
Bosse, J. Hellewell, M. Jit, P. Klepac, The effect of control strategies to
reduce social mixing on outcomes of the COVID-19 epidemic in Wuhan,
China: a modelling study, The Lancet Public Health (2020). doi:
10.1016/S2468-2667(20)30073-6.
[15] Y. Fang, Y. Nie, M. Penny, Transmission dynamics of the COVID-19
outbreak and effectiveness of government interventions: A data-driven
analysis, Journal of Medical Virology n/a (n/a). doi:10.1002/jmv.
25750.
[16] C. COVID, Severe Outcomes Among Patients with Coronavirus Disease
2019 (COVID-19) United States, February 12March 16, 2020, MMWR
Morb Mortal Wkly Rep 2020 69 (2020) 343–346. doi:10.15585/mmwr.
mm6912e2.
[17] E. Shim, A. Tariq, W. Choi, Y. Lee, G. Chowell, Transmission poten-
tial and severity of COVID-19 in South Korea, International Journal of
Infectious Diseases (2020). doi:10.1016/j.ijid.2020.03.031.
[18] D. Normile, Coronavirus cases have dropped sharply in South Korea.
Whats the secret to its success?, Science (2020). doi:10.1126/science.
abb7566.
[19] OECD, Elderly population (indicator) (2018). doi:10.1787/
8d805ea1-en.
18[20] The updates on COVID-19 in Korea as of 1 April, Division of Risk
assessment and International cooperation, Korea Centers for Disease
Control and Prevention (2020).
URL https://www.cdc.go.kr/menu.es?mid=a30402000000
[21] S. Flaxman, S. Mishra, A. Gandy, et al., Report 13: Estimating the
number of infections and the impact of non-pharmaceutical interventions
on COVID-19 in 11 European countries (2020). doi:10.25561/77731.
[22] S. Korean woman reinfected with coronavirus after recovery, Yonhap
News (2020-02-29).
URL http://yna.kr/AEN20200228009700320
[23] E. Dahl, Coronavirus (Covid-19) outbreak on the cruise ship Diamond
Princess, International Maritime Health 71 (1) (2020) 5–8. doi:10.
5603/MH.2020.0003.
[24] H. Kelly, K. Grant, Interim analysis of pandemic influenza (H1N1) 2009
in Australia: surveillance trends, age of infection and effectiveness of
seasonal vaccination, Eurosurveillance 14 (31) (2009). doi:https://
doi.org/10.2807/ese.14.31.19288-en.
[25] S. Cook, C. Conrad, A. L. Fowlkes, M. H. Mohebbi, Assessing Google
flu trends performance in the United States during the 2009 influenza
virus A (H1N1) pandemic, PloS one 6 (8) (2011) e23610–e23610. doi:
10.1371/journal.pone.0023610.
[26] Daily COVID-19 Surveillance Reports, Northern Ireland Public Health
Agency (PHA) (2020).
URL https://www.publichealth.hscni.net/publications/
covid-19-surveillance-reports
[27] Coronavirus: City Hospital to host NI’s first Nightingale, BBC News
(2020-04-02).
URL https://www.bbc.co.uk/news/uk-northern-ireland-52129644
[28] ICNARC report on COVID-19 in critical care, Intensive Care National
Audit & Research Centre (ICNARC) (2020-04-04).
URL https://www.icnarc.org/About/Latest-News/2020/04/04/
Report-On-2249-Patients-Critically-Ill-With-Covid-19
19[29] J. Phua, L. Weng, L. Ling, M. Egi, C.-M. Lim, J. V. Divatia, B. R.
Shrestha, Y. M. Arabi, J. Ng, C. D. Gomersall, M. Nishimura, Y. Koh,
B. Du, Intensive care management of coronavirus disease 2019 (COVID-
19): challenges and recommendations, The Lancet Respiratory Medicine
(2020). doi:10.1016/S2213-2600(20)30161-2.
[30] Coronavirus: NI could see 3,000 deaths in ’first wave’, BBC News
(2020-04-01).
URL https://www.bbc.co.uk/news/uk-northern-ireland-52121143
20You can also read