A Comparative Study of Stand-Alone and Hybrid CNN Models for COVID-19 Detection
←
→
Page content transcription
If your browser does not render page correctly, please read the page content below
(IJACSA) International Journal of Advanced Computer Science and Applications,
                                                                                                         Vol. 12, No. 6, 2021

    A Comparative Study of Stand-Alone and Hybrid
        CNN Models for COVID-19 Detection

                             Wedad Alawad1 , Banan Alburaidi2 , Asma Alzahrani3 , Fai Alflaj4
                                  Department of Information Technology, College of Computer,
                                     Qassim University, Buraydah, 51452, Saudi Arabia1
                                  Department of Information Technology, College of Computer,
                                    Qassim University, Buraydah, 51452, Saudi Arabia2,3,4

    Abstract—The COVID-19 pandemic continues to impact both         well as individuals’ lives. The number of infections and deaths
the international economy and individual lives. A fast and          increases day by day. As of April 18, 2021, the total number
accurate diagnosis of COVID-19 is required to limit the spread      of infected persons around the world has reached 141 million
of this disease and reduce the number of infections and deaths.     with a mortality rate of 3 million.
However, a time consuming biological test, Real-Time Reverse
Transcription–Polymerase Chain Reaction (RT-PCR), is used to             Therefore, there is a need to cooperate across disciplines
diagnose COVID-19. Furthermore, sometimes the test produces         and integrate resources to defend against COVID-19 and
ambiguous results, especially when samples are taken in the early   prevent it from further spread. Because this virus has the ability
stages of the disease. As a potential solution, machine learning    to spread fast between people, the first and most important
algorithms could help enhance the process of detecting COVID-
19 cases. In this paper, we have provided a study that compares
                                                                    step in COVID-19 defense is early detection. The most com-
the stand-alone CNN model and hybrid machine learning models        mon method used to detect COVID-19 is the Transcription-
in their ability to detect COVID-19 from chest X-Ray images.        Polymerase Chain Reaction (RT-PCR) test. The RT-PCR test
We presented four models to classify such kinds of images           usually takes up to 6 hours to produce results [1]. This
into COVID-19 and normal. Visual Geometry Group (VGG-               waiting time is long when we consider the urgent need to test
16) is the architecture used to develop the stand-alone CNN         millions of samples and receive the results as fast as possible
model. This hybrid model consists of two parts: the VGG-16          to prevent those who are infected from spreading the disease
as a features extractor, and a conventional machine learning        to others. Additionally, sometimes patients who have already
algorithm, such as support-vector-machines (SVM), Random-           been exposed to the virus and show severe symptoms could
Forests (RF), and Extreme-Gradient-Boosting (XGBoost), as a         still get false negative results in the (RT-PCR) test [1].
classifier. Even though several studies have investigated this
topic, the dataset used in this study is considered one of the          Thus, the development of a fast and efficient alternative is
largest because we have combined five existing datasets. The        necessary to improve the process of diagnosing COVID-19.
results illustrate that there is no noticeable improvement in the   One possibility is to exploit the fact that the disease can be
performance when hybrid models are used as an alternative to
the stand-alone CNN model. VGG-16 and (VGG16+SVM) models
                                                                    diagnosed using chest X-Ray images. In contrast to other types
provide the best performance with a 99.82% model accuracy and       of medical imaging, X-Ray images are available at most hos-
100% model sensitivity. In general, all the four presented models   pitals, and have been routinely used in COVID-19 diagnoses
are reliable, and the lowest accuracy obtained among them is        thus far. Moreover, they are cost-efficient and quickly produce
98.73%.                                                             results [2]. Machine learning and deep learning algorithms
                                                                    are promising in this case. Potential automated COVID-19
  Keywords—COVID-19; convolutional neural network; hybrid
                                                                    detection models can be provided by training such algorithms
models; chest X-Ray; deep learning
                                                                    on chest X-Ray image datasets. These models may aid in
                                                                    producing test results within a few seconds as well as reduce
                     I.   I NTRODUCTION                             inaccurate results.
   The continuous outbreak of the novel coronavirus was first           This paper addresses the following research question: How
reported in Wuhan, Hubei Province, China. In a preliminary          would replacing the fully connected layer with a machine
report, it was revealed that the virus shares an 88% serial         learning classifier affect the classification model performance?
identity with two coronaviruses derived from bats, similar to       To answer this question, we examined the efficiency of two
SARS. The new coronavirus was preliminarily named nCov-             types of machine learning models used to detect COVID-19.
2019. In February 2020, a study group from the International        Using one of the largest available chest X-Ray image datasets,
Committee on Taxonomy of Viruses classified the virus as            we have built four different models to study and compare
SARS-CoV. Shortly thereafter, the World Health Organization         between the stand-alone CNN model and hybrid machine
(WHO) formally named the disease caused by the novel                learning models with regard to their general effectiveness, giv-
coronavirus “COVID-19” [1].                                         ing particular attention to their COVID-19 classifying abilities.
   The most common symptoms of this disease are coughing,               The rest of this paper is structured as follows: Section II
headaches, fatigue, shortness of breath, loss of smell, pain in     provides background and analysis of pre-existing relevant stud-
the throat, and a high temperature. COVID-19 continues to           ies. Section III discusses the details of datasets and method-
have a destructive impact on global health and commerce, as         ologies used in this study. Section IV presents and discusses
                                                        www.ijacsa.thesai.org                                         877 | P a g e
(IJACSA) International Journal of Advanced Computer Science and Applications,
Vol. 12, No. 6, 2021
the results of our experiments. Section V concludes the paper More specifically, SVM, Bagging Classifier, and AdaBoost
by mentioning the most prominent points of this study. Finally, were used as classifiers in the models they developed. The
section VI provides ideas that may be implemented in the accuracy of the combination of Inception V3 and Bagging was
future. 99.36
Table I shows a summary of previous studies that used
II. R ELATED W ORK CNN architectures to build COVID-19 detection models.
Several studies have investigated the use of machine Along with the performance of detection models, the table
learning techniques to detect COVID-19. Among machine illustrates the size of datasets and the CNN technique used.
learning algorithms, most researchers used CNN techniques,
e.g., Inception (GoogleNet), ResNet (Residual Networks), and III. S TAND - ALONE CNN M ODEL VS . H YBRID M ODELS
DenseNet (Dense Networks), to build the detection models.
From the dataset perspective, chest X-Ray images were used In this study we have conducted several experiments to
more frequently than Computed Tomography (CT) images to investigate the abilities of stand-alone CNN and hybrid models
develop those models. to efficiently and accurately detect COVID-19 in patients. This
section presents the datasets and methodologies used in our
Most of the related studies have faced challenges due to a comparative study.
lack of available datasets. Researchers have applied methods
such as augmentation and K-fold cross validation to overcome A. Dataset Collections
this setback. In [3], the dataset size reached 1,592 images
after augmentation, and the authors used the ImageNet dataset As aforementioned, one of the challenges that researchers
and four CNN techniques to build detection models. The have faced in previous studies is the limited repository of
accuracy of VGG16 and VGG19 based models were the COVID-19 datasets. Moreover, the datasets that do exist are
highest, having achieved a 99.38% accuracy. In contrast, K- relatively small. Thus, we used images from four datasets to
fold cross validation was the method used to train the detection train and develop our models on COVID-19 cases. For normal
models on more data in [4]. In that study, VGG 16 and cases, we used one dataset. Fig. 1 shows samples of COVID-
ResNet50 techniques were used to develop models that dis- 19 and normal chest X-ray images and Table II illustrates a
tinguish between COVID-19 and pneumonia. The dataset was summary of these datasets.
comprised of 204 images, and their results showed that 89.2%
and 80.39% of COVID-19 cases were identified correctly by TABLE I. S UMMARY OF CNN - BASED M ODELS FOR COVID-19
these techniques, respectively. D ETECTION
In addition to the rarity of available datasets, the quality CNN
Ref. Dataset size Accuracy Sensitivity Specificity
of obtainable images needs to be enhanced to improve the A Deep Learning
Technique
performance of detection models. To achieve this, the Contrast Approach to
COVID-19 : 295
Detect COVID-19 Sequential CNN 98.3% - -
Limited Adaptive Histogram Equalization (CLAHE) algorithm Patients from
Normal : 659
Chest X-ray Images [7]
was applied in [5]. The authors conducted a comparison A Deep-Learning-Based
Framework for Automated
study to investigate the effect of using CLAHE to enhance Diagnosis of COVID-19
COVID-19 : 790
VGG19 99.38% 100% 98.77%
Normal : 802
covid diagnosis. They compared the detection accuracy of the Using X-ray
Images [3]
model when the CLAHE was applied and when the original Using X-ray images and
deep learning for
Pneumonia : 4,273
Incption-
COVID-19 : 231 92.18% 92.11% 96.06%
datasets were used to build the model without applying any automated detection
Normal : 1583
Resnet-V2
of coronavirus disease [9]
image quality enhancement techniques. The accuracy of the COVID-19 Detection in
Chest X-ray Pneumonia : 647
developed model increased from 83.00% to 92.00% after the Images using a COVID-19 : 204 VGG16 92% 94.92% 92%
Deep Learning Normal : 649
implementation of CLAHE. Approach [5]
Deep learning COVID-19
detection bias- accuracy COVID-19 : 181
Despite COVID-19 dataset challenges, many detection through Normal : 364
VGG19 96.3% 97.1% -
models with acceptable performance have been presented. The artificial intelligence [6]
COVID-19: automatic
transfer learning concept was used to build detection models detection from X-ray
images utilizing
Pneumonia : 700
COVID-19 : 224 VGG19 98.75% 92.85% 98.75%
in previous studies. In [6], the researchers developed a model transfer learning with
Normal : 504
convolutional neural
that detected COVID-19 from chest X-ray images. They used networks [10]
Finding COVID-19
a modified version of VGG-19 by adding a MLP (multilayer from Chest X-Rays COVID-19 : 102
ResNet50 89.2% - -
using Deep Learning Pneumonia : 102
perceptron) on top of the VGG-19 model. The accuracy of the on a Small Dataset [4]
model was 96.3%. Additionally, the authors in [7] used seven Deep-COVID:
Predicting COVID-19
Framework
of(ResNet18,
COVID-19 : 520
pre-trained models to develop a deep learning framework that from chest X-ray
images using deep
Normal : 5000
ResNet50,
SqueezeNet,
- 98% 90%
identified COVID-19 cases. Their results showed that VGG19 transfer learning [11]
COVIDX-Net:
DenseNet-121)
and DenseNet201 achieved better performance when compared A Framework of
Deep Learning COVID-19 : 25 VGG19,
with other models. The accuracy was 90% and the sensitivity ClassiFiers to Diagnose Normal : 25 DenesNet121
90% 100% -
COVID-19 in
was 100% for COVID-19 and 80% for normal images. X-Ray Images [12]
Deep Learning Based
Hybrid Models Pneumonia : 4273
Some papers have used hybrid models, meaning they for Prediction of COVID-19 : 1182 VGG-16 90.19% 94.16% -
combined multiple models to solve one problem. The authors COVID-19
using Chest X-Ray [8]
Normal : 1583
in [8] used four different types of ensemble learning, feature VGG-16 & SVM
VGG-16 & Bagging
91.19%
90.19%
93.15%
92.16%
-
-
ensembles, majority voting, feature classification, and class VGG-16 & Ada Boot 90.19% 90.10% -
modification, to classify COVID-19 and pneumonia cases.
www.ijacsa.thesai.org 878 | P a g e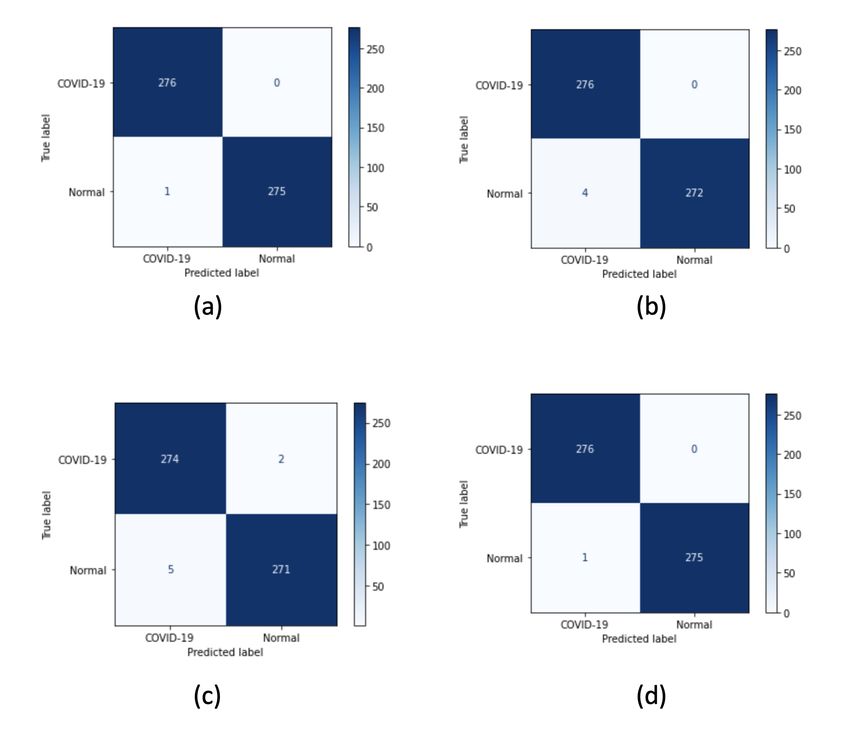
(IJACSA) International Journal of Advanced Computer Science and Applications,
                                                                                                           Vol. 12, No. 6, 2021

                                                                                               TABLE II. D ETAILS OF DATASETS USED

                                                                                                                                                   Count of
                                                                                                          Medical
                                                                                   Dataset                              Classes        View       COVID-19    Dataset Size
                                                                                                        Images Type
                                                                                                                                                    Images
                                                                                                                       COVID-19,
                                                                                                                                     AP, PA, AP
                                                                                                                          viral,
                                                                         COVID-chestxray-dataset [13]   X-ray , CT                    Supine,        504          930
                                                                                                                        bacterial,
                                                                                                                                       Lateral
                                                                                                                       pneumonias
                                                                           Actualmed-COVID-chest                      COVID-19 ,
                                                                                                           X-ray                      PA, AP         58           238
                                                                              xray-dataset [14]                         no finding
                                                                                                                       COVID-19,
                                                                                Figure1-COVID
                                                                                                           X-ray      pneumonias ,       -           35           55
                                                                            -chestxray-dataset [15]
                                                                                                                        no finding
          Fig. 1. Normal and COVID-19 Chest X-Ray Images.                     COVID-19-image-
                                                                                                           X-ray       COVID-19       AP ,PA         243          243
                                                                               repository [16]
                                                                                 Chest X-Ray                          Pneumonia,
                                                                                                           X-ray                        AP            0          5863
                                                                           Images (Pneumonia) [17]                      Normal

    1) COVID-19 chest X-ray images datasets: The details of
the four COVID-19 chest X-ray image datasets are as follows:
                                                                        test sets. We found that using 60% of data for training the
    COVID-19 dataset-1: We retrieved this dataset from the              model and 40% for testing it achieved the best performance.
Github repository, and it is more popular than any other cur-
rently available datasets. It was created and collected by Joseph       B. Experimental Environment
Paul Cohen, a postdoctoral fellow at Montreal University [13].
The dataset contains 930 images of chest X-ray and CT images                We used Keras to implement our COVID-19 detection
of patients with diverse diseases, including both bacterial and         models, which is an open-source library for deep learning
viral illnesses, as well as COVID-19 and pneumonia. COVID-              applications written in Python [18]. The code was implemented
19 images alone account for 584 of the dataset’s images, with           by the Colab environment, a service hosted by Jupyter. The Co-
the remainder classified as other. The chest X-ray images are           lab environment provides free access to computing resources,
classified into four views, Posterior Anterior (PA), Anterior           including GPU, which is the most widely used computing
Posterior (AP), AP Supine, and Lateral.                                 technology in artificial intelligence [19]. Additionally, we used
                                                                        TensorFlow as the backend for the machine learning platform
    COVID-19 dataset-2: We obtained the second dataset                  [20].
from the Github repository. It was created by Linda Wang and
colleagues from the University of Waterloo in Canada [14].              C. Stand-alone CNN Model
The dataset contains 238 chest X-ray images, 58 of which are
images of patients infected with COVID-19. The COVID-19                     As part of our study, we developed a stand-alone CNN
images are classified with two views: 32 images are PA and              model to distinguish between COVID-19 and normal cases.
26 images are AP.                                                       Convolutional neural networks, also known as (CNN), are
                                                                        a specialized kind of neural network used in the computer
   COVID-19 dataset-3: The previous team, Linda Wang                    vision field that contributes to automatic feature extraction and
and colleagues, created the third dataset as well. This dataset         data processing with a known grid-like topology. The CNN
contains 55 chest X-ray images, 35 of which are COVID-19                architecture has three main layers: convolutional layer, pooling
images and the rest are either Pneumonia or not classified [15].        layer, and fully connected layer [21]. The main components of
                                                                        CNN architecture are illustrated in Fig. 2.
    COVID-19 dataset-4: Dataset 4 is also from the Github
repository. It was created by the Institute for Diagnostic and              Convolutional layer : This layer applies several filters to
Interventional Radiology at the Hannover Medical School in              the input to generate feature maps [21].
Hannover, Germany [16]. It contains 243 images of COVID-                    Pooling layer : This layer reduces the size of feature maps
19 chest X-ray images. Those images include two views: 49               in terms of reducing the internal dimensions. Max pooling and
are PA images and 194 images are AP.                                    average pooling are the two operations available in this layer
   2) Normal Chest X-ray Images Datasets: The details of the            [21].
normal chest X-ray image datasets are as follows:                           Fully connected layer : This layer is also called the dense
    Normal-dataset: We obtained this dataset from the Kaggle            layer. In the fully connected layer, the inputs are connected
website. It was created by Paul Mooney, Developer Advocate              to the output with a learnable weight and are assigned to the
at Kaggle [17]. The dataset contains 5,863 chest X-Ray images           final outputs [21].
with two classes, pneumonia and normal. The number of                       Activation function : This is a function used to facili-
normal images is 1,583 and the number of pneumonia images               tate knowledge of difficult and complex patterns. It includes
is 4,273. All images in this dataset were in AP view. To balance        sigmoid, tanh, and Rectified Linear Unit (ReLU). The most
our data, we took only 690 normal images from this dataset.             common is the corrected linear unit (ReLU) [21].
    3) Data Preprocessing: We converted all images to JPEG                  From 1989 to present, improvements have been made in
format to provide ease by handling only one format type, and            the CNN architecture in terms of number of layers, parameters,
to reduce the dataset size to accelerate the training process.          and functions. These architectures vary from lightweight to
Furthermore, we applied normalization to improve image                  heavyweight structures [23]. From among those architectures,
clarity and overall quality. Furthermore, we resized them to            we chose the Visual Geometry Group (VGG-16) architecture
224*224. We tried several rations to split data into train and          to implement our detection models based on information we
                                                            www.ijacsa.thesai.org                                                                  879 | P a g e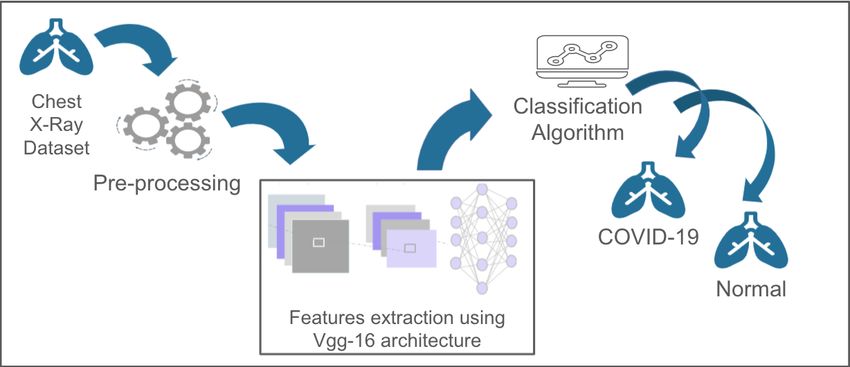
(IJACSA) International Journal of Advanced Computer Science and Applications,
                                                                                                            Vol. 12, No. 6, 2021

                                                                             TABLE III. PARAMETERS OF OUR S TAND - ALONE CNN M ODEL .

                                                                                          Number of training epochs              50
                                                                                                   Batch size                    26
                                                                                                 Optimization                  Adam
                                                                                                 Learning rate                 0.001
                                                                                                  input shape               (224,224,3)
                                                                                      Number of Fully connected layers            2
                                                                                        Number of convolution layers             13
                                                                                           Number of pooling layers               5
          Fig. 2. Key Components of CNN Architecture [22].                            Activation function in output layer     Sigmoid

garnered from the literature review. VGG architecture was
proposed by Simonyan and Zisserman in 2014. It includes
VGG-11, VGG-11-LRN, VGG-13, VGG-16, and VGG-19.
The depth of the layers vary [24].
    To develop our detection model, we exploited the principle
of transfer learning. We used weights of a pre-trained VGG-16
that were trained on a large dataset called ImageNet. It learned
a good representation of low level features like spatial, edges,
rotation, lighting, shapes. These features can be integrated to
enable the knowledge transfer and act as a feature extractor
for new images in different computer vision problems [25].                     Fig. 3. Implementation Steps of the Stand-alone CNN Model.

    In our model, we removed the top layer of the pre-trained
model to train the model on a new chest X-ray images dataset.
For optimization, we used Adam’s algorithm, an effective                      We followed several steps to develop our hybrid models,
stochastic optimization method for training deep learning                which you can find illustrated in Fig. 5. First, we trained the
models with a 0.001 learning rate. The number of training                VGG16 on our dataset. Then, we selected the last max pooling
epochs was 50 and the batch size for each epoch was 26. The              layer, which is the layer that comes after all convolution layers,
activation function in the hidden layer was ReLU, and sigmoid            to extract features. We added a flatten layer after the max
was used in the last layer because our classification problem            pooling layer to handle the dimensionality issues, see Fig.
is binary. The parameters of our stand-alone CNN model are               6. Because we use CNN 16 for the feature extraction part
illustrated in Table III and the model implementation steps are          and not for classification, we discarded the fully connected
shown in Fig. 3.                                                         and softmax layers, which are the dense layers after the
                                                                         flatten layer. After that, we used the extracted features to
                                                                         train the classification algorithms and develop models that can
D. Hybrid Models                                                         distinguish between COVID-19 and normal cases accurately.
    In addition to the stand-alone CNN model, we have de-                The number of extracted features is 25,088 features for every
veloped three hybrid models. Each model consists of a CNN                single image in the training dataset.
architecture (VGG-16) for feature extraction and one of the
following classification algorithms for classification: Support                         IV.     R ESULTS AND D ISCUSSION
Vector Machine (SVM), Random Forests (RF), and Extreme
Gradient Boosting (XGBoost). Fig. 4 shows an illustrative                    This section outlines the performance metrics we use to
diagram of the proposed hybrid models.                                   evaluate the developed models. Furthermore, it summarizes
                                                                         and discusses the main results of our experiments and presents
    A brief description of the selected classification algorithms        a discussion related to previous studies.
follows:
    Support Vector Machines (SVM): Essentially, SVM is a                 A. Performance Metrics
classification algorithm which tries to find the plane that
separates the classes with the widest margin in the sample                  We used various evaluation metrics to evaluate the pro-
space in the most convenient way [26].                                   posed models. These metrics are as follows:
    Random Forest (RF): RF is a collective classification and                Confusion matrix: This is a technique that summarizes
regression algorithm that uses decision trees as a classifier.           the performance of the classifier used. It presents true positive
Each decision tree is trained using a random data set derived            (TP) and true negative (TN) values, which means the number
from the original data set. The majority voting is used for the          of correctly rated positive and negative instances. It also shows
final classification [26].                                               false positive (FP) and false negative (FN) values, which means
                                                                         the number of misclassified negative and positive instances
    Extreme Gradient Boosting (XGBoost): This is a boosting              [28].
algorithm for classification and regression tree models, which
is derived from the gradient lifting decision tree [27].                     Accuracy: Accuracy is the percentage of the test set
                                                             www.ijacsa.thesai.org                                                  880 | P a g e
(IJACSA) International Journal of Advanced Computer Science and Applications,
Vol. 12, No. 6, 2021
Fig. 6. The Added Flatten Layer to the VGG-16 Architecture.
Fig. 4. An illustrative Diagram of the Proposed Hybrid Models.
the least effective. The values of its accuracy, sensitivity,
specificity, precision, and F1-score were 0.9873%, 0.9928%,
0.9874%, 0.9821%, 0.9819%, respectively.
Furthermore, the sensitivity of three models (CNN,
CNN+RF, and CNN+SVM) was100%; however, the CNN+RF
model achieved less specificity c ompared t o t he t wo other
models. The specificity o f t he C NN a nd C NN+SVM models
was 0.9964% and it was 0.9855% for the CNN+RF model.
Just like the specificity, t he a ccuracy, p recision, a nd F1-score
of the CNN and CNN+SVM models were better than those of
Fig. 5. Implementation Steps of the Hybrid CNN Models.
the two other models. The accuracy, precision, and F1-score
of the CNN and CNN+SVM models were 0.9982%, 0.9964%,
and 0.9982%, respectively. Also, the accuracy, precision, and
F1-score of the CNN+RF model were 0.9928%, 0.9857%, and
instances that are correctly classified by the classifier. 0.9929%, respectively. Fig. 7 shows the confusion matrices
T P +T N
of the presented models, and Table IV-A summarizes
Accuracy = (1) their performances.
T P +F N +T N +F P
Overall, there is not a substantial difference in the per-
Sensitivity (Recall): Recall is also referred to as the true formance of our models; all of them are excellent in terms
positive rate, which means the proportion of positive cases that of their ability to detect COVID-19. Besides the stand-alone
are correctly identified. CNN model, two of the hybrid models, the CNN+SVM
TP and CNN+RF, classified 100% of COVID-19 cases correctly.
Sensitivity = (2) Nonetheless, there are two main limitations to the generaliza-
T P +F N
tion of our findings. The first one is the lack of available Covid-
Specificity: This is the true negative rate. It refers to the 19 datasets. The second limitation is that this study focused
proportion of negative instances that are correctly identified. only on one of the CNN techniques and three machine learning
classifiers because of the following constraints: Authors used
TN
Specif icity = (3) the Google Colab platform to perform experiments due to
T N +F P the unavailability of powerful computing resources. However,
the restrictions in the provided resources that the platform
Precision: Precision is defined as the proportion of the true applies prevented them from conducting further investigations.
positives against all the positive results (both true positives and Additionally, this research was not financially supported, and
false positives). thus researchers only had limited Internet data, and they
TP used personal computers with bounded processing power and
P recision = (4) memory capacity.
T P +F P
F1 score: It represents the harmonic mean between recall TABLE IV. P ERFORMANCE M ETRICS FOR THE P RESENTED M ODELS
and precision values.
2∗P recision∗Recall
CNN CNN-RF CNN-XGBoost CNN-SVM
F 1score = (5) Accuracy 0.9982 0.9928 0.9873 0.9982
P recision+Recall Sensitivity(Recall) 1.0000 1.0000 0.9928 1.0000
Specificity 0.9964 0.9855 0.9874 0.9964
B. Tests Results Precision 0.9964 0.9857 0.9821 0.9964
F1-score 0.9982 0.9929 0.9819 0.9982
In general, the results showed that all of our developed
detection models are sufficient, especially the CNN and hybrid
(CNN+SVM) models. This finding indicates that both stand- C. Discussion Related to Previous Studies
alone and hybrid models could achieve high performances
when used to detect COVID-19 cases. Even though all our This subsection compares our models with pre-existing
models are adequate, the CNN+XGBoost model is considered models presented in previous studies. These prior models
www.ijacsa.thesai.org 881 | P a g e(IJACSA) International Journal of Advanced Computer Science and Applications,
Vol. 12, No. 6, 2021
the count of chest X-Ray images that we used to develop our
models is considered one of the biggest.
TABLE V. C OMPARISON WITH S TATE - OF - THE - ART M ODELS
Ref. Model Accuracy Sensitivity Specificity Precision F1-Score
[5] VGG-16 92% 94.92% 92% - -
[3] VGG-16 99.33% 99.28% 99.38% - 99.28%
[8] VGG-16 90.19% 94.16% - 94.12% 94.14%
VGG-16 & SVM 91.19% 93.15% - 94.12% 93.63%
VGG-16 & Baggimg 90.19% 92.16% - 92.22% 92.19%
VGG-16 & Ada Boot 90.19% 90.10% - 89.16% 89.63%
Our study VGG-16 99.82% 100% 99.64% 99.64% 99.82%
VGG-16 & RF 99.28% 100% 98.55% 98.57% 99.29%
VGG-16 & XGBoost 98.73% 99.28% 98.74% 98.21% 98.19%
VGG-16 & SVM 99.82% 100% 99.64% 99.64% 99.82%
Fig. 7. Generated Confusion Matrices for a) Stand-alone CNN Model, b)
CNN-RF model c) CNN-XGBoost Model, d) CNN-SVM Model Our findings illustrate that all of the four proposed models
are effective in detecting COVID-19. The lowest detection
accuracy obtained was 98.73% which is the accuracy of the
VGG16+XGBoost model. The highest accuracy was 99.82%
were developed using chest X-ray images and the VGG-16 which is the accuracy of both VGG-16 and(VGG16+SVM)
model as a feature extractor or a classifier. Table V shows the models. Furthermore, one of the most promising findings
performance for our models as compared to previous models. is that the sensitivity of the VGG-16, (VGG16+SVM), and
In [8], the authors presented a modified CNN based model (VGG16+RF) models is 100%, meaning they have a zero false
to detect COVID-19. The model accuracy and sensitivity be- negative case rate. That means that from all the examined
fore modification were 90.19% and 94.16%, respectively. After cases, 100% of the COVID-19 positive images were detected.
modifying the last layer of the original model, its performance This finding plays an important role in reducing the possibility
improved. Its accuracy and sensitivity became 99.52% and of spreading the virus to more people.
97.93%, respectively. Still, the accuracy and sensitivity of our
models are higher. In [5], even though the researchers have VI. F UTURE W ORK
used the CLAHE method to enhance their detection model,
its performance is still low. Its accuracy was 83%, and then Several experiments can be conducted to study the effect
became 92%. of different CNN architectures and optimizers on the model’s
performance. Furthermore, one of the areas that warrants
Compared to previous models, a better model has been additional study are COVID-19 mutations. It is necessary to
presented in [3]. Its accuracy was 99.3% and its sensitivity was develop machine learning and deep learning-based models ca-
99.28%. Our stand-alone model outperformed it. Some factors pable of detecting new versions of COVID-19, such as B.1.1.7,
that lead to that improvement in ours is that the number of B.1.1.207, P.1 and B.1.525 automatically. Additionally, it is
COVID-19 images that we used to develop our model is larger important to build robust models that have the ability to
compared to these studies, and we have used a balanced dataset distinguish between SARS, MERS, and COVID-19 accurately.
as well.
Just like the stand-alone CNN model, our hybrid models R EFERENCES
outperform those that have been proposed in [8]. Two out [1] Z. Y. Zu, M. D. Jiang, P. P. Xu, W. Chen, Q. Q. Ni, G. M. Lu, and
of the three classification algorithms that have been used in L. J. Zhang, “Coronavirus disease 2019 (COVID-19): A perspective
that paper are different from ours. Authors have selected the from china,” Radiology, vol. 296, no. 2, pp. E15–E25, 2020.
following algorithms: SVM, Bagging, and AdaBoost, while [2] L. Duran-Lopez, J. P. Dominguez-Morales, J. Corral-Jaime, S. Vicente-
we have selected these classification algorithms: SVM, random Diaz, and A. Linares-Barranco, “Covid-xnet: a custom deep learning
system to diagnose and locate covid-19 in chest x-ray images,” Applied
forest, and XGBoost. As shown in Table V, the SVM is the Sciences, vol. 10, no. 16, p. 5683, 2020.
classifier that leads to developing models with high accuracy [3] I. U. Khan and N. Aslam, “A deep-learning-based framework for
in both studies. Our two other algorithms, however, surpassed automated diagnosis of covid-19 using x-ray images,” Information,
Bagging and AdaBoost. vol. 11, no. 9, p. 419, 2020.
[4] L. O. Hall, R. Paul, D. B. Goldgof, and G. M. Goldgof, “Finding covid-
V. C ONCLUSION 19 from chest x-rays using deep learning on a small dataset,” arXiv
preprint arXiv:2004.02060, 2020.
This study addressed some of the challenges of the tradi- [5] F. A. Saiz and I. Barandiaran, “Covid-19 detection in chest x-ray images
tional COVID-19 test method. It exploited the power of ma- using a deep learning approach,” International Journal of Interactive
chine learning to accelerate the process of detecting COVID-19 Multimedia and Artificial Intelligence, InPress (InPress), vol. 1, 2020.
and to enhance its efficiency. We investigated the effectiveness [6] S. Vaid, R. Kalantar, and M. Bhandari, “Deep learning covid-19
detection bias: accuracy through artificial intelligence,” International
of stand-alone CNN models and hybrid machine learning Orthopaedics, vol. 44, pp. 1539–1542, 2020.
models in detecting the disease. We combined five chest X-Ray
[7] K. F. Haque and A. Abdelgawad, “A deep learning approach to detect
images datasets to develop four COVID-19 detection models: covid-19 patients from chest x-ray images,” AI, vol. 1, no. 3, pp. 418–
a stand-alone CNN model and three hybrid machine learning 435, 2020.
models. As a comparison to some of the previous studies that [8] R. K. Dubey et al., “Deep learning based hybrid models for prediction
have been published in the early few months of the pandemic, of covid-19 using chest x-ray,” TechRxiv, 2020.
www.ijacsa.thesai.org 882 | P a g e(IJACSA) International Journal of Advanced Computer Science and Applications,
Vol. 12, No. 6, 2021
[9] K. Elasnaoui and Y. Chawki, “Using x-ray images and deep learning for [19] “Google colaboratory,” accessed on: February. 20, 2021. [Online].
automated detection of coronavirus disease,” Journal of Biomolecular Available: https://colab.research.google.com/notebooks/intro.ipynb.
Structure and Dynamics, no. just-accepted, pp. 1–22, 2020. [20] “Tensorflow,” accessed on: February. 20, 2021. [Online]. Available:
[10] I. D. Apostolopoulos and T. A. Mpesiana, “Covid-19: automatic de- https://github.com/tensorflow/tensorflow.
tection from x-ray images utilizing transfer learning with convolutional [21] R. Yamashita, M. Nishio, R. K. G. Do, and K. Togashi, “Convolutional
neural networks,” Physical and Engineering Sciences in Medicine, p. 1, neural networks: an overview and application in radiology,” Insights
2020. into imaging, vol. 9, no. 4, pp. 611–629, 2018.
[11] S. Minaee, R. Kafieh, M. Sonka, S. Yazdani, and G. J. Soufi, “Deep- [22] V, Phung and E, Rhee , “A high-accuracy model average ensemble of
covid: Predicting covid-19 from chest x-ray images using deep transfer convolutional neural networks for classification of cloud image patches
learning,” arXiv preprint arXiv:2004.09363, 2020. on small datasets,” Appl. Sci. (Basel), vol. 9, no. 21, p. 4500, 2019.
[12] E. E.-D. Hemdan, M. A. Shouman, and M. E. Karar, “Covidx-net: A [23] A. Khan, A. Sohail, U. Zahoora, and A. S. Qureshi, “A survey of the
framework of deep learning classifiers to diagnose covid-19 in x-ray recent architectures of deep convolutional neural networks,” Artificial
images,” arXiv preprint arXiv:2003.11055, 2020. Intelligence Review, vol. 53, no. 8, pp. 5455–5516, 2020.
[13] J. P. Cohen, P. Morrison, and L. Dao, “COVID-19 Image Data Collec- [24] Z. Li, W. Yang, S. Peng, and F. Liu, “A survey of convolutional
tion,” arXiv e-prints, p. arXiv:2003.11597, Mar. 2020. neural networks: analysis, applications, and prospects,” arXiv preprint
[14] “Actualmed covid-19 chest x-ray dataset,” 2020. Accessed on: Feb. arXiv:2004.02806, 2020.
13, 2021. [Online]. Available: https://github.com/agchung/Actualmed- [25] S. Tammina, “Transfer learning using vgg-16 with deep convolutional
COVID-chestxray-dataset. neural network for classifying images,” International Journal of Scien-
[15] “Figure1-covid-chestxray-dataset,” 2020. Accessed on: Feb. 13, tific and Research Publications, vol. 9, no. 10, pp. 143–150, 2019.
2021. [Online]. Available: https://github.com/agchung/Figure1-COVID- [26] P. Mooney, “Classification algorithm - an overview — sciencedirect
chestxray-dataset. topics,” 2021. Accessed on: April. 28, 2021. [Online]. Available:
[16] “Covid-19-image-repository,” 2020. Accessed on: Feb. 13, 2021. http://www.sciencedirect.com/topics/engineering/classification-
[Online]. Available: https://github.com/ml-workgroup/covid-19-image- algorithm.
repository. [27] O. D. Gülgün and E. Hamza, “Medical image classification with
[17] P. Mooney, “Chest x-ray images (pneumonia),” 2020. hybrid convolutional neural network models,” Bilgisayar Bilimleri ve
Accessed on: Feb. 13, 2021. [Online]. Available: Teknolojileri Dergisi, vol. 1, no. 1, pp. 28–41.
https://www.kaggle.com/paultimothymooney/chest-xray-pneumonia. [28] M. Hossin and M. Sulaiman, “A review on evaluation metrics for data
[18] “Keras documentation,” accessed on: February. 20, 2021. [Online]. classification evaluations,” International Journal of Data Mining &
Available: https://keras.io/about/. Knowledge Management Process, vol. 5, no. 2, p. 1, 2015.
www.ijacsa.thesai.org 883 | P a g eYou can also read