X-RAY DIFFRACTION OF INTACT MURINE SKELETAL MUSCLE AS A TOOL FOR STUDYING THE STRUCTURAL BASIS OF MUSCLE DISEASE - JOVE
←
→
Page content transcription
If your browser does not render page correctly, please read the page content below
Journal of Visualized Experiments                                                                                                www.jove.com

Video Article
X-ray Diffraction of Intact Murine Skeletal Muscle as a Tool for Studying the
Structural Basis of Muscle Disease
              1                     1
Weikang Ma , Thomas C. Irving
1
BioCAT, Dept. of Biological Sciences, Illinois Institute of Technology

Correspondence to: Weikang Ma at wma6@iit.edu, Thomas C. Irving at irving@iit.edu

URL: https://www.jove.com/video/59559
DOI: doi:10.3791/59559
Keywords: Developmental Biology, Issue 149, skeletal muscle, X-ray diffraction, acto-myosin interaction, sarcomere structure, skeletal muscle
myopathy, skeletal muscle physiology
Date Published: 7/18/2019
Citation: Ma, W., Irving, T.C. X-ray Diffraction of Intact Murine Skeletal Muscle as a Tool for Studying the Structural Basis of Muscle Disease. J. Vis.
Exp. (149), e59559, doi:10.3791/59559 (2019).

Abstract
    Transgenic mouse models have been important tools for studying the relationship of genotype to phenotype for human diseases including those
    of skeletal muscle. Mouse skeletal muscle has been shown to produce high quality X-ray diffraction patterns on third generation synchrotron
    beamlines providing an opportunity to link changes at the level of the genotype to functional phenotypes in health and disease by determining
    the structural consequences of genetic changes. We present detailed protocols for preparation of specimens, collecting the X-ray patterns and
    extracting relevant structural parameters from the X-ray patterns that may help guide experimenters wishing to perform such experiments for
    themselves.

Video Link
    The video component of this article can be found at https://www.jove.com/video/59559/

Introduction
    Synchrotron small-angle X-ray diffraction is the method of choice for studying the nm-scale structure of actively contracting muscle preparations
    under physiological conditions. Importantly, structural information from living or skinned muscle preparations can be obtained in synchrony
    with physiological data, such as muscle force and length changes. There has been increasing interest in applying this technique to study the
    structural basis of inherited muscle diseases that have their basis in point mutations in sarcomeric proteins. The muscle biophysics community
    has been very active in generating transgenic mouse models for these human disease conditions that could provide ideal test beds for structural
                                                 1,2,3           4,5
    studies. Recent publications from our group        and others have indicated that the X-ray patterns from the mouse extensor digitorum longus
    (EDL) and soleus muscles can provide all the diffraction information available from more traditional model organisms such as frog and rabbit
    psoas skeletal muscle. An advantage of the mouse skeletal muscle preparation is the ease of dissection and performing basic membrane-intact,
    whole muscle physiological experiments. The dimensions of the dissected muscle have sufficient mass to yield highly detailed muscle patterns in
    very short X-ray exposure times (~millisecond per frame) on third generation X-ray beamlines.

    Muscle X-ray diffraction patterns consist of the equatorial reflections, the meridional reflections as well as the layer line reflections. The equatorial
    intensity ratio (ratio of the intensity of the 1,1 and 1,0 equatorial reflections, I11/I10), is closely correlated to the number of attached cross-bridges,
                                                                                   2
    which is proportional to the force generated in mouse skeletal muscle . The meridional reflections that report periodicities within the thick and thin
                                                                1,3,6,7
    filaments can be used to estimate filament extensibility           . Diffraction features not on the meridian and the equator are called layer lines, which
    arise from the approximately helically ordered myosin heads on the surface of thick filament backbone as well as the approximately helically
                                                                                                                                                             2,8
    ordered thin filaments. The intensity of myosin layer lines is closely related to the degree of ordering of myosin heads under various conditions .
    All of this information can be used study the behaviors of sarcomeric proteins in situ in health and disease.

    Synchrotron X-ray diffraction of muscle has been historically done by teams of highly specialized experts but advances in technology and the
    availability of new data reduction tools indicate that this need not always be the case. The BioCAT Beamline 18ID at the Advanced Photon
    Source, Argonne National Laboratory has dedicated staff and support facilities for performing muscle X-ray diffraction experiments that can help
    newcomers to the field get started in using these techniques. Many users choose to formally collaborate with BioCAT staff, but an increasing
    number of users find they can do the experiments and analysis themselves reducing the burden on beamline staff. The primary goal of this paper
    is to provide training that provides potential experimenters with the information they need to plan and execute experiments on the mouse skeletal
    muscle system either at the BioCAT beamline or at other high flux beamlines around the world where these experiments would be possible.

Protocol
    All animal experiments protocols were approved by the Illinois Institute of Technology Institutional Animal Care and Use Committee (Protocol
                                                                                                                            9
    2015-001, Approval date: 3 November 2015) and followed the NIH "Guide for the Care and Use of Laboratory Animals" .

Copyright © 2019 Creative Commons Attribution-NonCommercial-NoDerivs 3.0 Unported                                    July 2019 | 149 | e59559 | Page 1 of 6
License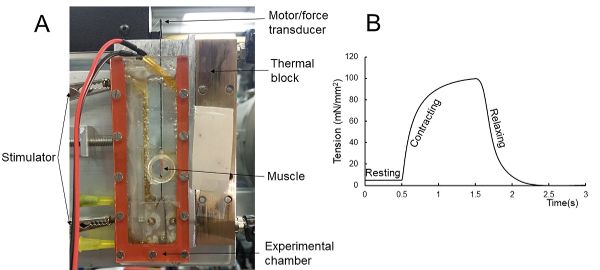
Journal of Visualized Experiments                                                                                          www.jove.com

1. Pre-experiment Preparation
  1. Prepare 500 mL of Ringer’s solution (contains: 145 mM NaCl, 2.5 mM KCl, 1.0 mM MgSO4, 1.0 mM CaCl2, 10.0 mM HEPES, 11 mM
     glucose, pH 7.4) freshly for each day of the experiment.
  2. Fill 200 mL of Ringer's solution in a spray bottle and store at 4 °C fridge. Fill a Petri dish (10 cm in diameter) with Ringer's solution and
     perfuse with 100% oxygen by connecting the tube from an oxygen cylinder to an aquarium air stone. The Petri dishes ("dissecting dishes")
     were previously coated with an elastomer compound to allow inserting pins during the dissection.
  3. Prepare metal mounting hooks. Cut two pieces of stainless-steel wire, 0.5 mm in diameter, to the appropriate length and bend the wire at both
     ends to form hooks. Arrange all the dissecting tools, scissors, suture tying forceps, micro-scissors handy for use.
     NOTE: The hook part should be about 3 mm long. The longer wire (ending in a hook) should be about 5 cm long, and the shorter wire (also
     ending in a hook) should be about 1 cm long in order to fit the custom chambers used at BioCAT and allow for a sufficient range of motion for
     the transducer arm.
  4. Connect and turn on all the equipment. This includes a combined motor/force transducer, motor/force transducer controller a high-
     power bi-phasic current stimulator, and a computer controlled data acquisition/control system.
                                                                                                      10
        1. Turn on the data acquisition system and calibrate it before beginning the experiment . Briefly, calibrating the force by adding a set
            of known weights, covering up to 50% of the maximum force measured by the force transducer in a linear progression, on the force
            transducer and recording the output voltage changes. Calibrate the length by applying a set of known output voltage to the lever arm
            and measure the length change of the arm.
        2. Connect the hoses from the thermal block on the sample holder to a refrigerated circulating bath and set the temperature to maintain
            the desired temperature in the chamber to between 10 °C and 40 °C. Determine this empirically ahead of time by setting the circulating
            bath to a range of temperatures and measuring the temperature in the chamber with a thermocouple.

2. Muscle Preparation
  1. Euthanizing the mouse
       1. Euthanize the mouse by carbon dioxide inhalation followed by cervical dislocation.
       2. Spray the skin on the hind limb with cold Ringer’s solution to prevent hair from blowing into the preparation. Remove the skin by cutting
          it away around the thigh using fine dissection scissors and quickly pull the skin down using #5 forceps to expose the muscles.
       3. Amputate the hind limb and transfer it to a dissecting dish that has been filled with oxygenized Ringer’s solution, and then place under
          a binocular dissecting microscope.

  2. Preparing a soleus muscle
       1. Pin the hind limb down in the dissecting dish with the gastrocnemius muscle facing upwards. Cut the distal tendon of the
          gastrocnemius/soleus muscle group and lift the muscles gently and slowly by cutting away the fascia on either side of the
          gastrocnemius muscle using fine scissors. Isolate the gastrocnemius/soleus muscle group from the limb after freeing the proximal
          tendon of the soleus muscle.
       2. Pin the muscle group containing the gastrocnemius muscle and the distal tendon down in the dissecting dish. Lift the soleus muscle
          gently via the proximal tendon and separate it from the gastrocnemius muscle leaving as much of the soleus distal tendon intact as
          possible.

  3. Preparing an extensor digitorium longus (EDL) muscle
       1. Pin the hind limb down in the dissecting dish with the tibialis anterior muscle facing upwards. Cut the fascia along the tibialis anterior
          (TA) muscle and pull it clear using forceps. Identify and cut the distal tendon of the TA muscle. Lift the TA muscle and cut it out carefully
          without pulling on the EDL muscle.
       2. Cut open the lateral side of the knee and expose the two tendons. Cut the proximal tendon, leaving as much of the tendon as possible
          still attached to the muscle, and lift the EDL muscle (medial muscle) by gently pulling the tendon. Cut the distal tendon once it is
          exposed.

  4. Mounting the muscle
      1. Pin down the muscle via the tendons, and trim all the extra fat, fascia and tendon away as much as possible. Insert one tendon into a
         pre-tied knot and tie the suture tightly with suture tying forceps. Tie the second knot on around the metal hook.
      2. Repeat the same procedure with the long hook on the other end of the tendon. Make sure that none of the body of the muscle is
         contacted by the sutures. This will damage the preparation.
      3. Attach the short hook to the bottom of the experimental chamber and the long hook to the dual mode force transducer/motor. Bubble
         the solution in the experimental chamber with 100% oxygen.

  5. Optimizing stimulation protocols and muscle length
      1. Stretch the muscle by adjusting the micromanipulators attached to the transducer/motor to generate a baseline tension between 15
          to 20 mN before finding the best stimulus parameters. Set the stimulation voltage to 40 V. The stimulation current is systematically
          increased until there is no additional increase in twitch force. The highest current found is increased by about 50% to ensure supra-
          maximal activation.
      2. Find the optimal length, L0, defined as the muscle length that give maximum twitch force, by increasing the muscle length and
          activating the muscle with a single twitch until the active force (peak force minus baseline force) stops increasing.
      3. Perform a short tetanic contraction (1 s activation) to test the mounting and stretch the muscle back to optimal baseline force if
          necessary. Record the muscle length in mm with a digital caliper.

Copyright © 2019 Creative Commons Attribution-NonCommercial-NoDerivs 3.0 Unported                             July 2019 | 149 | e59559 | Page 2 of 6
License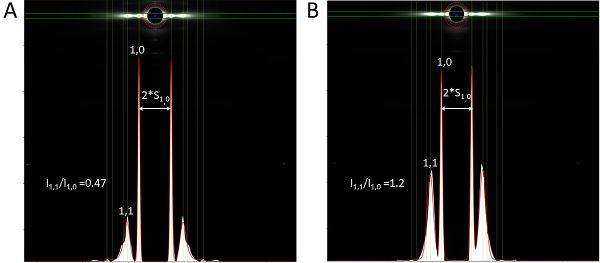
Journal of Visualized Experiments www.jove.com
3. X-ray Diffraction
NOTE: The following description is for X-ray diffraction experiments done using the small angle X-ray diffraction instrument on the BioCAT
beamline 18ID at the Advanced Photon Source, Argonne National Laboratory but similar methods could be employed on other beamlines such
as ID 02 at the ESRF (France) and BL40XU at SPring8 (Japan). Beamline 18ID is operated at a fixed X-ray beam energy of 12 keV (0.1033 nm
13
wavelength) with an incident flux of ~10 photons per second in the full beam.
1. Choose a specimen to detector distance (camera length). Use a 1.8 m camera length for experiments examining the 2.7 nm actin and high
order myosin reflections such as 2.8 nm meridional reflections. Use a 4-6 m camera for other experiments, where one is primarily interested
in fine detail on the meridian and layer lines
2. Optimizing the position of the sample in beam
1. Determine the beam position by using a piece of X-ray sensitive paper that produces a dark spot in response to X-rays ("a burn"). Then
use a video cross-hair generator to create a cross-hair aligned with the burn mark on the paper or simply make a mark on the video
screen with a marker pen.
2. Use the BioCAT supplied graphical user interface to the sample positioner to move the muscle to be centered on the beam position.
Oscillate the sample chamber at ~10-20 mm/s by moving the sample stage in order to spread the X-ray dose over the muscle during
the exposure. Observe the sample as it moves to avoid large regions of fascia (contains collagen which will pollute the diffraction
patterns) and to ensure that it stays illuminated during the entire path of its travel.
NOTE: The exact steps required in sections 3.3 and 3.4 to make the required settings and actions using the beamline-supplied
graphical user interface will be beamline and detector specific. Ask beamline staff as to how to perform these operations.
3. Setting up the CCD (charge coupled device) detector for high resolution patterns from muscle in defined static states (resting, or
during isometric contraction)
1. Set up the exposure time and exposure period in the graphical user interface to the control software. Take a dark background image
before taking the exposure and repeat this procedure every 2 hours or after changing of exposure time to correct any drift in the
detector readout electronics.
2. Attenuate the X-ray beam to desired value for the exposure. Then take an image. It is not possible to take sequences of images with
this detector. The CCD detector also needs several seconds to read out an individual image.
4. Setting up the pixel array detector for a time resolved experiment
1. Set up the number of images, exposure time, exposure period in the graphical user interface. The pixel array detector used here needs
at least 1 ms to readout. The maximum frame frequency for photon counting detector is 500 Hz. Use the photon counting detector
output signal to control the X-ray shutter.
2. Attenuate the beam to the desired intensity. Arm the detector and wait for the trigger from the data acquisition system. Synchronize the
mechanical and X-ray data by triggering them at the same time. The X-ray patterns are collected continuously throughout the protocol
a with a 1 ms exposure time and a 2 ms exposure period.
NOTE: The exact exposure time and exposure period should be determined on a case by case basis for the information desired and
the observed lifetime of the sample in the beam. Attenuate the beam in order to use no more X-ray beam than is needed to provide
analyzable data in the chosen exposure period.
4. Post-experiment Muscle Treatment
1. Recover and weigh the muscle after each mechanical and X-ray experiment. Calculate the cross-sectional area of the muscle using the
11 12
measured muscle length and the muscle mass assuming a muscle density of 1.06 g/mL .
2. Stretch the muscle to the experimental length and fix the muscle in 10% formalin for 10 min. Separate the fixed muscle into a series of fiber
3
bundles selected from locations throughout the entire muscle cross section .
3. Measure the sarcomere length using a video sarcomere length measuring system.
Representative Results
Isometric tetanic contraction. Any kind of classic muscle mechanical experiment, such as isometric or isotonic contractions, can be performed
with simultaneous acquisition of X-ray patterns. Figure 1A shows the experimental setup for mechanical and X-ray experiments. An example
force trace for an isometric tetanic contraction is shown in Figure 1B. The muscle was held at resting for 0.5 s before activated for 1 s. The
mechanical recording stops 1 s after the stimulus. The X-ray patterns were collected continuously throughout the protocol at 1 ms exposure time
at 500 Hz.
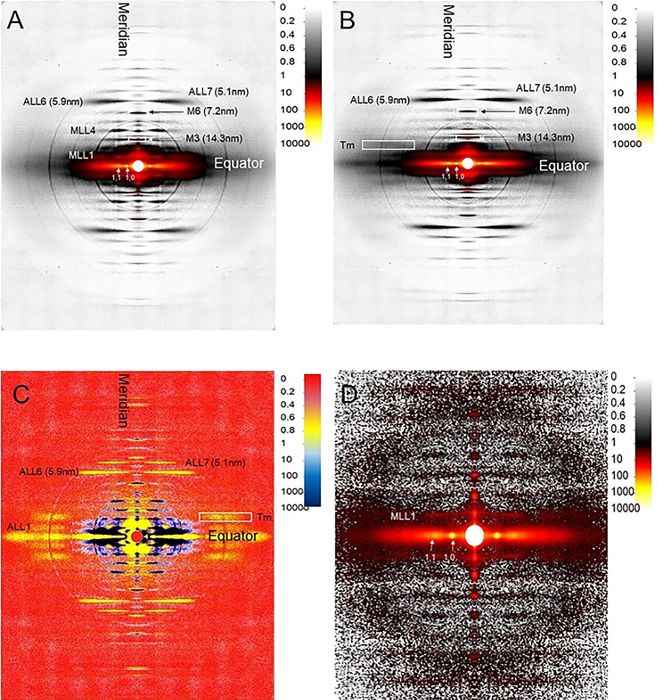
X-ray diffraction patterns. The muscle X-ray diffraction pattern can give nanometer resolution structural information from structures inside the
sarcomere. Muscle X-ray diffraction patterns are composed of four equivalent quadrants divided by the equator and the meridian. The equatorial
pattern arises from the myofilament packing within the sarcomere perpendicular to the fiber axis, while the meridional patterns report structural
information from the myofilaments along the muscle axis. The remaining reflections not on the equator or the meridian are called layer lines.
Layer lines (e.g., features labeled MLL4 and ALL6 in Figure 2A) arise from the approximately-helical arrangement of molecular subunits within
the myosin containing thick filaments and the actin containing thin filaments. The myosin-based layer lines are strong and sharp in patterns
from resting muscle (Figure 2A), while actin-based layer lines are more prominent in patterns from contracting muscle (Figure 2B). Difference
patterns obtained by subtracting the resting pattern from the contracting pattern (Figure 2C) can shed light on structural changes during force
development in healthy and diseased muscle. By following these structural changes at the millisecond time scale of the molecular events during
muscle contraction, the X-ray diffraction patterns can reveal substantial structural information (Figure 2D).
Copyright © 2019 Creative Commons Attribution-NonCommercial-NoDerivs 3.0 Unported July 2019 | 149 | e59559 | Page 3 of 6
LicenseJournal of Visualized Experiments www.jove.com
Data Analysis using MuscleX. Here is an example of equatorial reflections analysis using the “equator” routine in the MuscleX package (Figure
13
3). MuscleX is an open-source analysis software package developed at BioCAT . The equatorial intensity ratio (I1,1/I1,0) is an indicator of the
proximity of myosin to actin in resting muscle (Figure 3A), while it is closely correlated to the number of attached cross-bridges in contracting
2
(Figure 3B) murine skeletal muscle . The intensity ratio, I1,1/I1,0, is about 0.47 in resting muscle and about 1.2 in contracting muscle. The
distance between the two 1,0 reflection (2*S1,0) is inversely related to the inter-filament spacing. Detailed documentations and manuals for
13
MuscleX are available online .
Figure 1: Mechanical and X-ray experiment setup and protocol. (A) The muscle is mounted on one end to a hook inside the experimental
chamber and the other end to a dual mode motor/force transducer. It is held between two Kapton film windows to allow the X-rays to pass
through. The chamber is filled with Ringer’s solution perfused with 100% oxygen throughout the experiment. (B) The mechanical protocol for X-
ray experiments on a muscle during tetanic contraction. Please click here to view a larger version of this figure.
Figure 2: EDL X-ray diffraction patterns. EDL muscle X-ray diffraction pattern from resting (A) and contracting (B) muscle. (C) The difference
pattern between resting and contracting pattern. The blue region indicates high intensity in resting pattern, while the yellow region represents
high intensity in contracting pattern. (D) X-ray diffraction pattern from a 1 ms exposure with EDL muscle. MLL1 = First order myosin layer line;
MLL4 = Fourth order myosin layer line; ALL1 = First order actin layer line ALL6 = Sixth order actin layer line; ALL7 = Seventh order actin layer
line; Tm = tropomyosin reflection (indicated by a white box); M3 = third order meridional reflection; M6 = sixth order meridional reflection. Please
click here to view a larger version of this figure.
Copyright © 2019 Creative Commons Attribution-NonCommercial-NoDerivs 3.0 Unported July 2019 | 149 | e59559 | Page 4 of 6
LicenseJournal of Visualized Experiments www.jove.com
Figure 3: Data analysis of equatorial patterns using MuscleX. The background subtracted equatorial intensity ratio profile (while area) and
first five orders (green lines) were fit to calculate the intensity of each peak. Please click here to view a larger version of this figure.
Discussion
Recent publications from our group showed that X-ray patterns from the mouse skeletal muscle can be used to shed light on sarcomeric
1,2,3
structural information from muscle in health and disease especially with the increased availability of genetic modified mouse models for
various myopathies. High resolution mechanical studies on single fibers or small bundles combined with X-ray diffraction is best done by experts.
If, however, more modest mechanical information will suffice for your purposes, the whole muscle preparation allows collection of detailed X-ray
patterns from a simple preparation.
A clean dissection is key to a successful combined mechanical and X-ray experiment. It is very important not to pull on the target muscle as well
as other muscles associated with the soleus or EDL muscles during dissection since this could tear parts of the muscle and lead to reduced
force. It can also lead to damaged internal structure that will degrade the X-ray patterns. Since everything will scatter in the X-ray beam, it is
important to cleaning away any extra fat, the collagen in fascia as well as any hairs or loose bits of tissue while doing the following protocol. To
reduce additional compliance in the muscle preparation, it is also important to securely tie the tendons to the hooks, as close as possible to the
muscle body without damaging it.
Different X-ray exposure times can provide different kinds of information from the same muscle. Using the full beam on 18ID, an analyzable
equatorial pattern can be obtained in a 1 ms exposure (See Figure 2D). For an analyzable first myosin layer line reflection, a 10 ms total
exposure time is typically required. To collect higher order meridional reflections such as the M15 (2.8 nm myosin meridional reflection) and
the 2.7 nm actin meridional reflection, typically at least 1 s total exposure is required but more than 2 s total exposure is recommended for high
accuracy measurements.
The choice of the optimal X-ray detector for the experiment is important. For the most detailed X-ray patterns a customized CCD detector, such
as the one at BioCAT with ca. 40 µm pixels and ~65 µm point spread functions in the phosphor, can provide patterns with high dynamic range
and good spatial resolution but can only take one frame at a time. For time resolved experiments, the photon counting pixel array detector at
BioCAT can collect X-ray patterns at 500 Hz. The 172 µm pixel size with this detector, however, does not provide sufficient spatial resolution for
detailed studies of the inner part of the meridian but is adequate for most other purposes. BioCAT acquired a high-resolution photon counting
detector providing 75 µm real resolution at maximum frame rate of 9,000 Hz. Similar detectors of this type are expected to supplant current
detectors for muscle studies over the next few years.
With the very high fluxes of X-rays at third generation synchrotrons, radiation damage is a serious concern. It is always a good choice to
attenuate the beam to deliver no more beam than is needed to observe the desired diffraction features. The same total X-ray exposure can be
achieved by prolonging the exposure time from an attenuated beam. An advantage of photon counting pixel array detectors is that individual
frames can be summed together with no noise penalty. Even then, radiation damage is possible. Signs of radiation damage includes drop of
maximum force of contraction, smearing of layer line reflections, even change of muscle color.
One of the limitations of the intact mouse skeletal muscle preparation is the difficulty in obtaining sarcomere length from the intact muscle
during the experiments. The muscles are too thick for video microscopy and laser diffraction. While with future developments it may be possible
14
to estimate sarcomere length directly from the diffraction patterns , in the near term the only option is to measure it after the experiment as
described here.
Disclosures
The authors declare that they have no competing financial interests.
Acknowledgments
This research used resources of the Advanced Photon Source, a U.S. Department of Energy (DOE) Office of Science User Facility operated
for the DOE Office of Science by Argonne National Laboratory under Contract No. DE-AC02-06CH11357. This project was supported by grant
P41 GM103622 from the National Institute of General Medical Sciences of the National Institutes of Health. Use of the Pilatus 3 1M detector was
provided by grant 1S10OD018090-01 from NIGMS. The content is solely the responsibility of the authors and does not necessarily reflect the
official views of the National Institute of General Medical Sciences or the National Institutes of Health.
Copyright © 2019 Creative Commons Attribution-NonCommercial-NoDerivs 3.0 Unported July 2019 | 149 | e59559 | Page 5 of 6
LicenseJournal of Visualized Experiments www.jove.com
References
1. Ma, W. et al. Thick-Filament Extensibility in Intact Skeletal Muscle. Biophysical Journal. 115 (8), 1580-1588 (2018).
2. Ma, W., Gong, H., Irving, T. Myosin Head Configurations in Resting and Contracting Murine Skeletal Muscle. International Journal of
Molecular Sciences. 19 (9) (2018).
3. Kiss, B. et al. Nebulin stiffens the thin filament and augments cross-bridge interaction in skeletal muscle. Proceedings of the National
Academy of Sciences of the United States of America. 115 (41), 10369-10374 (2018).
4. Ochala, J., Gokhin, D. S., Iwamoto, H., Fowler, V. M. Pointed-end capping by tropomodulin modulates actomyosin crossbridge formation in
skeletal muscle fibers. Federation of American Societies for Experimental Biology Journal. 28 (1), 408-415 (2014).
5. Lindqvist, J., Iwamoto, H., Blanco, G., Ochala, J. The fraction of strongly bound cross-bridges is increased in mice that carry the myopathy-
linked myosin heavy chain mutation MYH4(L342Q). Disease Models & Mechanisms. 6 (3), 834-840 (2013).
6. Huxley, H. E., Stewart, A., Sosa, H., Irving, T. X-ray diffraction measurements of the extensibility of actin and myosin filaments in contracting
muscle. Biophysical Journal. 67 (6), 2411-2421 (1994).
7. Wakabayashi, K. et al. X-ray diffraction evidence for the extensibility of actin and myosin filaments during muscle contraction. Biophysical
Journal. 67 (6), 2422-2435 (1994).
8. Anderson, R. et al. Mavacamten stabilizes a folded-back sequestered super-relaxed state of β-cardiac myosin. Proceedings of the National
Academy of Sciences of the United States of America. (2018).
9. National Research Council (U.S.). Committee for the Update of the Guide for the Care and Use of Laboratory Animals., Institute for
Laboratory Animal Research (U.S.) & National Academies Press (U.S.). Guide for the care and use of laboratory animals. 8th edn. National
Academies Press, (2011).
10. Rand, C. How to Calibrate Your Dual-Mode Lever System Using DMC. (2017).
11. Alexander, R. M. V. A. The dimensions of knee and ankle muscles and the forces they exert. Journal of Human Movement Studies. 1,
115-123 (1975).
12. Burkholder, T. J., Fingado, B., Baron, S., Lieber, R. L. Relationship between Muscle-Fiber Types and Sizes and Muscle Architectural
Properties in the Mouse Hindlimb. Journal of Morphology. 221 (2), 177-190 (1994).
13. Jiratrakanvong, J. et al. MuscleX: software suite for diffraction X-ray imaging V1.13.1. (2018).
14. Reconditi, M. et al. Myosin filament activation in the heart is tuned to the mechanical task. Proceedings of the National Academy of Sciences
of the United States of America. 114 (12), 3240-3245 (2017).
Copyright © 2019 Creative Commons Attribution-NonCommercial-NoDerivs 3.0 Unported July 2019 | 149 | e59559 | Page 6 of 6
LicenseYou can also read