TAKEN NO ACTION Special Report
←
→
Page content transcription
If your browser does not render page correctly, please read the page content below
Special Report

      NO ACTION
       TAKEN
           Lack of CBP Accountability in
         Responding to Complaints of Abuse
By Daniel E. Martínez, Ph.D., Guillermo Cantor, Ph.D., and Walter A. Ewing, Ph.D.

                              May 2014
NO ACTION TAKEN
LACK OF CBP ACCOUNTABILITY IN
RESPONDING TO COMPLAINTS OF ABUSE
MAY 2014
BY DANIEL E. MARTÍNEZ, PH.D., GUILLERMO CANTOR PH.D., AND WALTER A. EWING, PH.D.
ABOUT THE AMERICAN IMMIGRATION COUNCIL’S IMMIGRATION POLICY CENTER
The Immigration Policy Center, established in 2003, is the policy arm of the American Immigration Council. IPC's
mission is to shape a rational conversation on immigration and immigrant integration. Through its research and
analysis, IPC provides policymakers, the media, and the general public with accurate information about the role of
immigrants and immigration policy in U.S. society. IPC reports and materials are widely disseminated and relied
upon by press and policymakers. IPC staff regularly serves as experts to leaders on Capitol Hill, opinion-makers,
and the media. IPC is a non-partisan organization that neither supports nor opposes any political party or
candidate for office. Visit our website at www.immigrationpolicy.org and our blog at
www.immigrationimpact.com.
ABOUT THE AUTHORS
Daniel E. Martínez, Ph.D. is an Assistant Professor of Sociology at The George Washington University, and a co-
principal investigator of the Migrant Border Crossing Study. Martinez’s research interests include criminology,
unauthorized migration, and the sociology of race and ethnicity. He received a Ph.D. in Sociology from the
University of Arizona.
Guillermo Cantor, Ph.D., is the Senior Policy Analyst at the American Immigration Council, where he also leads the
Council’s research efforts. He has authored numerous publications on immigration policy and immigrant
integration and regularly appears in English- and Spanish-language media. He also currently teaches sociology of
immigration at Georgetown University. Mr. Cantor holds a Ph.D. in Sociology from the University of Maryland,
College Park.
Walter A. Ewing, Ph.D., is the Senior Researcher at the American Immigration Council. He has authored or co-
authored numerous publications on the role of immigrants in the U.S. economy, the relationship between
immigration and crime, the unforeseen consequences of U.S. border-enforcement policies, and the possible
contours of immigration reform. He has a Ph.D. in Anthropology from the City University of New York Graduate
School.
For their valuable comments and suggestions on various drafts of this report, we wish to thank Jennifer Podkul,
Senior Program Officer for the Migrant Rights and Justice Program at the Women’s Refugee Commission; Melissa
Crow, Director of the Legal Action Center at the American Immigration Council; and Mary A. Kenney, Senior Staff
Attorney in the Council’s Legal Action Center. We also wish to thank Sandra Loyola of George Washington
University, who conducted the data entry for this report.SUMMARY
D ata obtained by the American Immigration Council shine a light on the lack of
accountability and transparency which afflicts the U.S. Border Patrol and its parent
agency, U.S. Customs and Border Protection (CBP). The data, which the Immigration
Council acquired through a Freedom of Information Act (FOIA) request, covers 809 complaints
of alleged abuse lodged against Border Patrol agents between January 2009 and January 2012.
These cases run the gamut of physical, sexual, and verbal abuse. Although it is not possible to
determine which cases had merit and which did not, it is astonishing that, among those cases in
which a formal decision was issued, 97 percent resulted in “No Action Taken.” On average, CBP
took 122 days to arrive at a decision when one was made. Moreover, among all complaints, 40
percent were still “pending investigation” when the complaint data were provided to the
Immigration Council.
The data indicate that “physical abuse” was the most prevalent reason for a complaint,
occurring in 40 percent of all cases, followed by “excessive use of force” (38 percent). Not
surprisingly, more complaints were filed in sectors
with higher levels of unauthorized immigration.
During the time period studied, more than one in The data indicate that “physical
three complaints filed against Border Patrol agents abuse” was the most prevalent reason
were directed at agents in the Tucson Sector. After for a complaint, occurring in 40
accounting for the different numbers of Border Patrol percent of all cases, followed by
agents in each sector, the complaint rate remained “excessive use of force” (38 percent).
the highest in the Tucson Sector, with the Rio Grande Not surprisingly, more complaints
Valley Sector a close second. Complaint rates as were filed in sectors with higher levels
measured in terms of numbers of apprehensions were of unauthorized immigration.
highest in Del Rio, Rio Grande Valley, and San Diego.
Taken as a whole, the data indicate the need for a
stronger system of incentives (both positive and
negative) for Border Patrol agents to abide by the law, respect legal rights, and refrain from
abusive conduct. In order to do that, complaints should be processed more quickly and should
be carefully reviewed. Furthermore, the seriousness of the complaints demands an external
review.
A LONGSTANDING PATTERN OF ABUSE AND INACTION
F or years it has been reported that U.S. Border Patrol agents routinely ignore the
constitutional and other legal rights of both immigrants and U.S. citizens. More precisely,
agents of the Border Patrol are known for regularly overstepping the boundaries of their
authority by using excessive force, engaging in unlawful searches and seizures, making racially
motivated arrests, detaining people under inhumane conditions, and removing people from the
United States through the use of coercion and misinformation. 1 A 2013 report, for instance,
shows that physical and verbal mistreatment of migrants while in U.S. custody is not a random
1occurrence, but rather a systemic problem.2 And while this issue currently may be getting more
public attention, the use of force by Border Patrol agents against the immigrants they
apprehend is hardly a new phenomenon.3
The abuse of migrants while in U.S. custody arises from a lack of transparency and
accountability not only within the Border Patrol itself, but within its parent agency: U.S.
Customs and Border Protection (CBP). 4 While officials in any institution may engage in unlawful
conduct, such behavior can be minimized or kept in check if there are clear rules, norms, and
sanctions that hold those officials accountable. In other words, individuals respond to
incentives, and the existence of widespread abuse of authority within the Border Patrol reveals
a weakness in the structure of incentives that should guide the behavior of Border Patrol
agents.
In addition to the structure of incentives, some of the abuses registered may also be related to
the way in which CBP has been hiring and training new staff. Since the adoption of the
“prevention through deterrence” strategy in the early 1990s, which resulted in a surge of
resources and personnel along the southwest border, the number of Border Patrol agents has
been increasing steadily.5 Although a report from the
Department of Homeland Security (DHS) Office of
Inspector General (OIG) states unequivocally that the The ramping up of hires, possibly
staffing surge impacted neither the amount nor the coupled with reduced or inadequate
6
type of training that CBP personnel receive, many training and experience, may have
non-governmental organizations (NGOs) suggest resulted in the presence of agents who
otherwise. Moreover, a report from the Congressional do not have the skills to deal
Research Service says that the rapid expansion in the appropriately with people in stressful
number of agents has led to a decline in the level of situations.
experience of agents in the field. The report also casts
doubt on whether the growth in manpower in recent
years has been matched with appropriate training and other procedures to make sure that new
agents are adequately integrated into the force. 7 All in all, the ramping up of hires, possibly
coupled with reduced or inadequate training and experience, may have resulted in the
presence of agents who do not have the skills to deal appropriately with people in stressful
situations.
Based on data provided to the American Immigration Council in response to a Freedom of
Information Act (FOIA) request, this report sheds light on one of the few avenues available to
people to directly report mistreatment by Border Patrol agents—namely, the filing of
complaints. Individuals who have been subject to alleged misconduct by Border Patrol agents or
other CBP officials may submit complaints to DHS through various channels. 8 Complaints
regarding criminal and non-criminal misconduct by CBP employees or contractors can be
submitted directly to DHS OIG, to the Joint Intake Center (JIC), to CBP’s Office of Internal Affairs
(OIA), and/or to DHS’s Office for Civil Rights and Civil Liberties (CRCL). OIG screens the
complaints of CBP misconduct it receives directly as well as those submitted through other
channels. If OIG declines to investigate a complaint, it will either be returned to the originating
2office or, with respect to complaints submitted directly to OIG, sent to CRCL and/or to the JIC
for referral to OIA.9 It is from the subset of complaints passed along to CBP’s Office of Internal
Affairs by DHS OIG that the data in this report is derived. In addition, complaints may also be
filed with local CBP offices. In other words, there is no unified system through which the agency
receives all complaints from individuals who allege that they have been improperly treated by
CBP.
In principle, the receipt and investigation of complaints sounds like an invaluable opportunity
for the agency to learn from any systematic problems that may affect the behavior of its
personnel, and—where necessary—improve their performance through enhanced training
and/or policy directives. However, the findings of this report show that the complaint system is
a rather ornamental component of CBP that carries no real weight in how the agency functions.
The data underlying this analysis consists of a set of complaints filed against CBP during the
period January 2009 through January 2012. CBP
produced this data set in response to FOIA litigation
by the Immigration Council which sought records First and foremost, this analysis
relating to complaints filed by an individual (or by an reveals that CBP officials rarely take
organization on behalf of an individual) which alleged action against the alleged perpetrators
either general misconduct of any type by a Border of abuse. Among cases in which a
Patrol agent or, more particularly, that an agent used formal decision was issued, 97 percent
coercive tactics—such as threats of violence, sexual resulted in “No Action Taken.”
assault, or retaliation—to persuade an individual to
accept voluntary return to his or her country of origin.
The Council’s request for records was limited to incidents occurring within 100 miles of the
U.S.-Mexico border.
In response, CBP’s Office of Internal Affairs produced a document listing 809 complaints against
Border Patrol personnel. Even though this is valuable information for analytical purposes, it is
safe to assume that only a very small fraction of individuals who are victims of abuse would
actually file a complaint. It is unlikely that those who have been deported or those with a
precarious immigration status would actually file a complaint, even after being subjected to
extreme mistreatment by Border Patrol agents. In addition, many victims of abuse do not have
the resources and/or linguistic ability to navigate CBP’s website and actually file a complaint.
These assertions are supported by several reports and academic studies which find that
approximately one-in-ten migrants report physical abuse while in U.S. custody. 10 However,
even with these limitations, the data offer interesting insights into how CBP operates when it
comes to agents’ actions which may precipitate complaints, as well as the handling and
resolution of complaints themselves.
First and foremost, this analysis reveals that CBP officials rarely take action against the alleged
perpetrators of abuse. Among cases in which a formal decision was issued, 97 percent resulted
in “No Action Taken.” This is not to suggest that all of these cases had merit and should have
resulted in formal action being taken against particular Border Patrol agents. However, given
3that several other studies have found strong evidence of systemic abuse at the hands of Border
Patrol agents, it is very likely that at least some of these cases did indeed have merit. On
average, CBP took 122 days to arrive at a decision when one was made. Moreover, of the 809
complaints, 324 (40 percent) were still “pending investigation” when the complaint data were
provided to the Immigration Council. This amounts to powerful evidence of a serious lack of
accountability and transparency within CBP.
THE COMPLAINTS AND THEIR CHARACTERISTICS
C BP’s Office of Internal Affairs provided the Immigration Council with a total of 809
complaints that were filed against U.S. Border Patrol agents in all nine southwestern
Border Patrol sectors between January 22, 2009, and January 5, 2012. Data on
complaints were not provided for the first three months of Fiscal Year (FY) 2009 (October,
November, and December), nor the last eight months of FY 2012 (January-September). Partial
data were provided for the month of January in both FY 2009 and FY 2012 {Figure 1}.
Figure 1: Complaints Filed, FY 2009-2012
400
349
350
312
300
250
200
150
100 82
66
50
0
2009* 2010 2011 2012*
Fiscal Year
Source: FOIA Request, American Immigration Council.
* Data provided for only part of year.
According to the data 11 provided by CBP, “physical abuse” was the most prevalent reason for a
complaint, occurring in 40 percent of all cases, followed by “excessive use of force” (38
percent). “Unspecified abuse” (e.g. mentions of “misconduct,” “abuse,” or “mistreatment”)
account for 13 percent of cases, while “other” (e.g., inadequate conditions or racial profiling)
represents only about three percent of complaints. “Improper searches” or “inappropriate
touching”—usually forcing a person to strip—are cited in about two percent of cases. “Sexual
abuse” and “medical issues” (withholding of medical treatment) were each cited in less than
one percent of all complaints {Appendix Table 1}.
4The allegations contained within the complaints encompass many forms of abuse. The bullet
points below provide specific examples of the types of mistreatment highlighted in complaints,
the Border Patrol Sectors in which the alleged mistreatment occurred, and the outcome of the
complaints, if any. For instance:
“BPA [Border Patrol Agent] allegedly hit a UDA’s [Undocumented Alien’s] head against
a rock causing a hematoma.” (Tucson Sector—Counseling)
“Mexican Citizen alleges BPA physically abused her as she was trying to go back to
Mexico.” (San Diego Sector—Formal Court)
“BPA allegedly kicked female during apprehension causing her to miscarry.” (El Paso
Sector—No Action Taken).”
“A minor alleged he was physically forced by a BPA to sign a document.” (Tucson
Sector—No Action Taken).”
“A UDA alleges a BPA who arrested him stomped on his back after he had lain on the
ground.” (Rio Grande Valley Sector—No Action Taken).
“Allegedly having a relationship with an illegal alien/forcing female aliens to have
sex.” (El Centro Sector—Pending Investigation)
“Unknown BPA from the Laredo Section kicked already handcuffed alien.” (Laredo
Sector—Pending Investigation)
“Alleges that BPAs beat him with a baton and pepper sprayed him.” (San Diego
Sector—Pending Investigation)
“BPAs allegedly denied a UDA water; touched/treated female UDAs inappropriately.”
(Tucson Sector—Pending Investigation)
“Juvenile UDA alleges a BPA pepper sprayed her, hit her in the back; threatened to
throw a bomb at her.” (Rio Grande Valley Sector—Pending Investigation)
“A UDA alleges BPAs stripped him and left him naked in a cell, called him ‘faggot and
homo,’ took his DL [Driver’s License].” (El Centro Sector—Pending Investigation)
“BPA allegedly hit an undocumented juvenile with the butt of his flashlight; grabbed
his throat. Calexico, CA.” (El Centro Sector—Pending Investigation)
“Improper strip search of a driver at a Border Patrol checkpoint.” (El Paso Sector—
Written Report)
“Alleges an unidentified BPA stated ‘Don’t move or I’ll kill you’ as he was being
arrested.” (Rio Grande Valley—No Action Taken)
“Alleged excessive use of force by BPA during an arrest of an alien.” (Rio Grande
Valley—Suspension)
Nearly 97 percent of the alleged perpetrators of abuse were U.S. Border Patrol agents, while
the remaining 3 percent were Border Patrol supervisors. Among those cases in which the sex of
the victims was known, nearly 77 percent were male and 23 percent female. 12 In comparison,
85.6 percent of all U.S. Border Patrol apprehensions were of males and 14.4 percent were of
females between FY 2009 and 2012.13 Therefore, females appear to be overrepresented among
complainants. Nevertheless, these figures should be interpreted with caution given that sex
was missing in nearly half of the 809 cases. As opposed to the data on sex, information on
whether or not the victim was a juvenile appeared to be reported systematically. Overall,
5juveniles made up 7.2 percent of all complainants during the time period examined. This
percentage is strikingly consistent with apprehension figures. Between FY 2009 and 2012,
juveniles represented 7.3 percent of all individuals apprehended by the Border Patrol 14
{Appendix Table 1}.
MOST COMPLAINTS OCCURRED IN TUCSON, THE RIO GRANDE
VALLEY, AND SAN DIEGO
T here was substantial variation between U.S. Border Patrol sectors in terms of where
complaints were filed. The highest number of complaints were filed against agents in the
Tucson Sector (279), followed by the Rio Grande Valley Sector (167), and then the San
Diego Sector (132). Collectively, these three sectors account for 71.4 percent of all complaints
filed between January 22, 2009 and January 5, 2012 {Figure 2}.
Figure 2: Complaints Filed by Border Patrol Sector
300 279
(34.5%)
250
200
167
(20.6%)
150 132
(16.3%)
85
100 (10.5%)
43
(5.3%) 35 31
50 (4.3%) (3.8%) 18
11 8
(2.2%)
(1.4%) (1.0%)
0
Tucson Rio Grande San Diego Laredo Del Rio El Centro El Paso Unknown Yuma Big Bend
Valley
Source: FOIA Request, American Immigration Council.
Not surprisingly, more complaints were filed in sectors with higher levels of unauthorized
immigration. As a result, “complaint rates,” rather than the raw numbers of complaints, provide
a more accurate picture of the state of affairs along the southwestern border by accounting for
differences in migration flows through a particular sector.15 After taking apprehensions into
account, the highest rates of complaints in FY 2010-2011 were in the Del Rio Sector (116.7
complaints per 100,000 apprehensions), Rio Grande Valley Sector (114.3), and San Diego Sector
(107.2). In comparison, the Tucson Sector had a complaint rate of 69.5. At the other extreme,
the El Centro Sector had a complaint rate nearly a third or fourth of the size of the Del Rio, Rio
Grande Valley, and El Paso sectors during this time period {Figure 3 and Appendix Table 2}.
6Figure 3: Complaints per 100,000 Apprehensions, FY 2010 & 2011
140
116.7 114.3
120 107.2
101.8
100
85.5
80 69.5
64.4 61.8
60
41.4
40
20
0
Del Rio Rio Grande San Diego El Paso Laredo Tucson Big Bend Yuma El Centro
Valley
Source: FOIA Request, American Immigration Council.
Similar patterns emerge when complaint rates are calculated in terms of the number of Border
Patrol agents in each sector. The highest complaint rates were in the Tucson Sector (30.7
complaints per 1,000 agents), Rio Grande Valley Sector (27.5) and San Diego Sector (22.6). At
the other end of the continuum were Yuma Sector (4.1), El Paso Sector (4.2), and Big Bend
Sector (4.5) {Figure 4 and Appendix Table 2}.
Figure 4: Complaints per 1,000 Agents, FY 2010 & 2011
35
30.7
30 27.5
25 22.6
20
16.4
15
11.1 11.0
10
4.5 4.2 4.1
5
0
Tucson Rio San Diego Laredo El Centro Del Rio Big Bend El Paso Yuma
Grande
Valley
Source: FOIA Request, American Immigration Council.
7CHRONIC INACTION BY CBP
A mong the 809 formal complaints filed against the agency, 472 (58.3 percent) resulted in
“No Action Taken,” while 40 percent of complaints (324) were still being investigated
when the Immigration Council received the data in response to the FOIA request. Six
complaints resulted in counseling, two led to court proceedings against the perpetrator, two
led to an oral reprimand of the accused, and an additional two resulted in a written report. Only
one resulted in suspension of the perpetrator of the abuse. In other words, among the 485
complaints in which a formal decision was made, “No Action Taken” represented 97 percent of
all outcomes, with the average amount of time taken to arrive at a decision being 122 days.
Among the cases that were still “Pending Investigation,” the average number of days between
the date the complaint was filed and the last record date provided in the data set was 389 days.
472 Figure 5: Complaints by Decision/Action
500
(58.3%)
450
400
324
350 (40.0%)
300
250
200
150
100
50 6 2
2 2 1
(0.7%) (0.3%) (0.3%) (0.3%) (0.1%)
0
No Action Pending Counseling Formal Court Oral Reprimand Written Report Suspension
Investigation
Source: FOIA Request, American Immigration Council.
CONCLUSIONS AND RECOMMENDATIONS
O ne of the most revealing findings of this report concerns the prevailing lack of action
taken by CBP officials in response to the complaints received. This indicates issues of
both effectiveness and efficiency regarding the way in which CBP handles complaints.
Moreover, there is a clear need for a stronger system of incentives (both positive and negative)
for Border Patrol agents (and all CBP officers) to obey the law, respect legal rights, and refrain
from abusive conduct. In order to do that, the complaints process should not only be
8centralized, but complaints should also be processed more quickly and carefully reviewed.
Because of the seriousness of the issues involved, an external review of the complaints filed
against CBP is essential.
In terms of geographical distribution of complaints, some border sectors appear to register
higher complaint rates than others. During the time period studied, more than one in three
complaints filed against Border Patrol agents were directed at agents in the Tucson Sector.
However, after taking numbers of apprehensions and
Border Patrol agents into consideration—the former
of which is often used as a proxy for unauthorized 78 percent of allegations against
migration flow—complaint rates were highest in the Border Patrol agents were for
Rio Grande Valley, San Diego, Del Rio, and Tucson “physical abuse” or “excessive use of
sectors. In fact, the complaint rate per apprehensions force.”
in the Rio Grande Valley and Del Rio Sectors were
more than one-and-a-half times higher than in the
Tucson Sector. Of course, we cannot infer a direct association between occurrences of abuses
and filing of complaints. It is possible, for instance, that NGOs in some locations do a better job
of disseminating information about the complaint process. However, CBP should pay particular
attention to the sectors where the complaints are more heavily concentrated.
We also found that 78 percent of allegations against Border Patrol agents were for “physical
abuse” or “excessive use of force.” This, of course, could stem from the fact that individuals
who suffer more extreme types of abuse are more likely to report it. In any event, the existence
of so many complaints regarding physical abuse or excessive use of force reveals that the
nature of behaviors reported is indeed serious, and, therefore, the agency should give these
complaints the attention they deserve.
Moreover, it is essential that DHS streamline complaint processes into a unified procedure. This
would allow DHS to readily review complaints filed with the OIG, JIC, CRCL, and CBP local sector
offices and ports of entry, thereby presenting a clearer picture of any problems. It is also crucial
that communications regarding complaints be streamlined. Individuals who file complaints, or
organizations that file complaints on behalf of individuals, should be informed of the status of
the complaints throughout the review process. In addition, complaints should be used by the
agency as an opportunity to inform training and promotion of employees as well as improve the
performance of its personnel.
Aside from specific sanctions that may be adopted as a result of the review, reports of well-
founded complaints should be made available to supervisors, who can develop and implement
appropriate performance improvement plans where necessary. In other words, the lessons
from the complaints review should be actively shared with key CBP personnel in order to foster
a change of culture within the agency. Finally, it is important for CBP to become more
transparent, especially considering the magnitude of taxpayer resources allocated to the
agency.
9APPENDIX TABLES
10ENDNOTES
1
Some cases of CBP abuses are compiled on http://holdcbpaccountable.org/about-us/.
2
Daniel E. Martinez, Jeremy Slack, and Josiah Heyman, Bordering on Criminal: The Routine Abuse of Migrants in the
Removal System (Washington, DC: Immigration Policy Center, American Immigration Council, December 2013).
3
Scott Phillips, Nestor Rodriguez, and Jacqueline Hagan, “Brutality at the Border: Use of Force in the Arrest of
Immigrants in the United States,” International Journal of the Sociology of Law 30, no.4 (December 2002): 285-
306; Scott Phillips, Jacqueline Maria Hagan, and Nestor Rodriguez, “Brutal Borders?: Examining the Treatment of
Deportees During Arrest and Detention,” Social Forces 85, no.1 (September 2006): 93-109: No More Deaths, A
Culture of Cruelty: Abuse and Impunity in Short-term U.S. Border Patrol Custody (Tucson, AZ: 2011).
4
Daniel E. Martinez, Jeremy Slack, and Josiah Heyman, Bordering on Criminal: The Routine Abuse of Migrants in the
Removal System (Washington, DC: Immigration Policy Center, American Immigration Council, December 2013).
5
The goal of “prevention through deterrence” was to place Border Patrol “agents and resources directly on the
border in order to deter the entry of illegal aliens, rather than attempting to arrest aliens after they have already
entered the country.” This strategy was first implemented in El Paso in 1993 as Operation Blockade, then in San
Diego in 1994 as Operation Gatekeeper, and then in other portions of the Texas, California, and Arizona
borderlands {Chad C. Haddal, Border Security: The Role of the U.S. Border Patrol (Washington, DC: Congressional
Research Service, August 2010)}.
6
U.S. Department of Homeland Security, Office of Inspector General, CBP Use of Force Training and Actions to
Address Use of Force Incidents, OIG-13-114 (Revised), September 2013, pp. 8-11.
7
Chad C. Haddal, Border Security: The Role of the U.S. Border Patrol (Washington, DC: Congressional Research
Service, August 2010), pp. 33-34.
8
U.S. Department of Homeland Security, Office for Civil Rights and Civil Liberties, How to File a Complaint with the
Department of Homeland Security, October 3, 2012.
9
U.S. Department of Homeland Security, Office of Inspector General, CBP Use of Force Training and Actions to
Address Use of Force Incidents, OIG-13-114 (Revised), September 2013, pp. 5-6.
10
See Daniel E. Martinez, Jeremy Slack, and Josiah Heyman, Bordering on Criminal: The Routine Abuse of Migrants
in the Removal System (Washington, DC: Immigration Policy Center, American Immigration Council, December
2013), p. 2.
11
The majority of “physical abuse” and “excessive use of force” coded responses are from direct references to
these key words in the “Allegation Summary” field provided by CBP. When a direct reference to those codes was
not noted, we coded direct strikes, kicks, pushing/pulling, etc. as “physical abuse,” while the “excessive force”
code was utilized when the complaint involved unnecessary aggression while the agent was attempting to
apprehend, process, or transport an individual or groups of individuals. For instance, if a person was apprehended
and handcuffed, but then pushed, slapped, or thrown to the ground, we coded the complaint as “physical abuse,”
not “excessive use of force.” However, if the individual was tackled while being apprehended (but nothing else
occurred after he or she was in custody), we coded these incidents as “excessive use of force.” “Excessive use of
force” also includes mentions of Taser deployment, strikes with baton or flashlight, and canine injury during the
apprehension, processing, or transportation process. Non-descript mentions of “abuse,” “mistreatment,” or
“misconduct” were coded as “unspecified abuse.” The most severe form of abuse was coded in the rare instance
of multiple references to different abuse types.
12
The sex of the victims was derived from the allegation summary provided in response to the FOIA request. Cases
where sex was not explicitly mentioned were coded as missing data.
13
U.S. Customs and Border Protection, available at http://www.cbp.gov/newsroom/media-resources/stats.
14
Ibid.
1115
Complaint rates in sectors with lower numbers of apprehensions and agents should be interpreted with caution
because they are more susceptible to marginal changes in the numerator when the denominator is held constant.
This makes complaint rates in these sectors more unstable. For instance, Big Bend had 6 complaints and 9,324
apprehensions in FY 2010 & 2011. That’s a rate of 64.4 complaints per 100,000 apprehensions (6 / 9,324 x
100,000). Now suppose that, for whatever reason, there were actually 8 complaints instead of 6. This would send
the rate from 64.4 up to 85.8 complaints per 100,000 apprehensions. In contrast, an additional two complaints in
the Tucson Sector would hardly affect the rate at all because of the size of the denominator relative to that of Big
Bend’s.
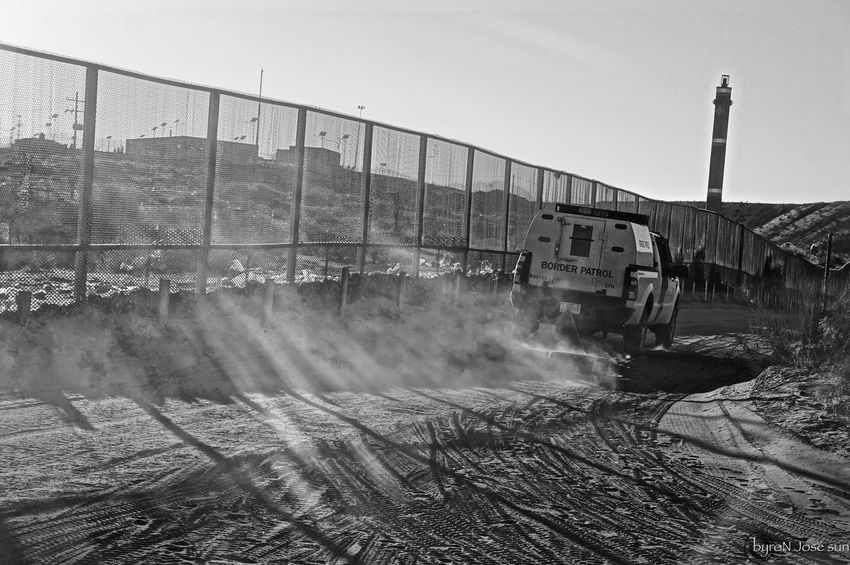
Cover Page Photo Courtesy of Byron José Sun.
12You can also read