Creation of wind roses un- der the KLAPS project - Umwelt ...
←
→
Page content transcription
If your browser does not render page correctly, please read the page content below
Creation of wind roses un- der the KLAPS project
Creation of wind roses in the Polish-Saxon
  border region under the KLAPS project

Michaela Surke, Majana Heidenreich, Valeri Goldberg

                                                      2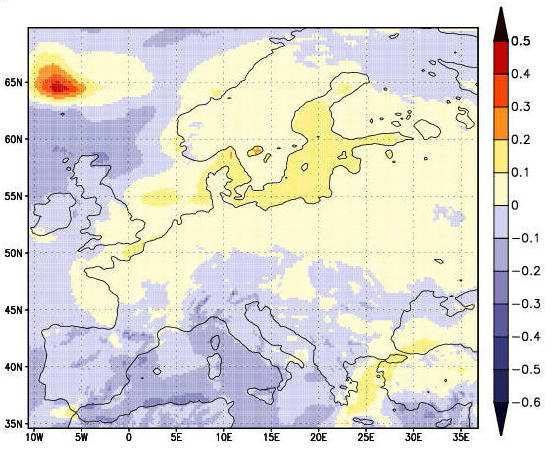
Table of contents

1        Motive and objective .............................................................................................................................. 6
2        Topic ...................................................................................................................................................... 6
3        Climatic characterisation of the KLAPS target area .............................................................................. 7
4        Data base .............................................................................................................................................. 8
5        Methods ................................................................................................................................................. 9
6        Results ................................................................................................................................................. 12
7        Conclusion ........................................................................................................................................... 22
8        Literature to studies conducted so far in Central Europe .................................................................... 24

                                                                                                                                                                     3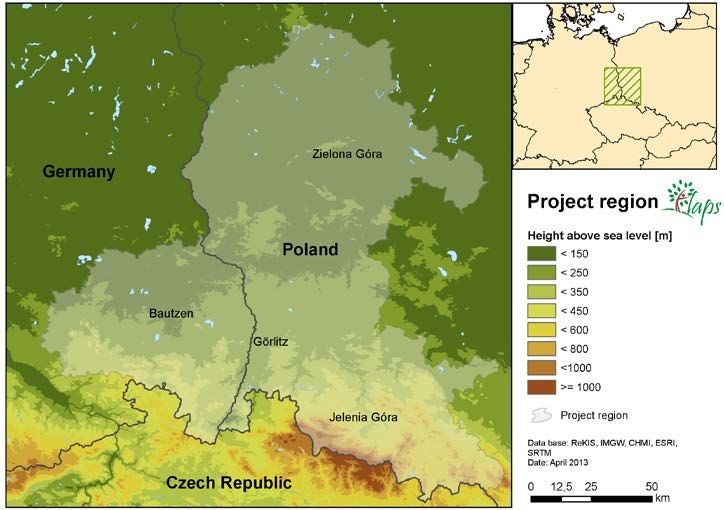
Table of figures

figure 1: Target area for the creation of wind roses in the KLAPS project............................................................ 8
figure 2: Spatial coverage of the CLM data set for the creation of the wind roses in the KLAPS project and
position of the radiosonde stations .....................................................................................................................10
figure 3: Wind roses determined from radiosonde for the KLAPS target area for the years 2000, 2005 and
2010 for the pressure range between 950 hPa and 850 hPa .............................................................................12
figure 4: Average wind roses determined from the climate simulation with CLM (C20) for the KLAPS target
area for the years 2000 and 2005 for the pressure range between 925 hPa and 850 hPa ...............................13
figure 5: Average wind roses determined from the climate simulation with CLM (C20) for the KLAPS target
area for the year 2010 for the pressure range between 925 hPa and 850 hPa .................................................14
figure 6: Average wind roses determined from the climate simulation with CLM (C20) for the KLAPS target
area for the decades 1971-1980, 1981-1990 and 1991-2000 for the pressure range between 925 hPa and
850 hPa ...............................................................................................................................................................15
figure 7: Average wind roses determined from the climate simulation with CLM (A1B) ) for the KLAPS target
area for the decades 2001-2010 and 2011-2020 for the pressure range between 925 hPa and 850 hPa ........16
figure 8: Average wind roses determined from the climate simulation with CLM (A1B) ) for the KLAPS target
area for the decades 2021-2030, 2031-2040 und 2041-2050 for the pressure range between 925 hPa and
850 hPa ...............................................................................................................................................................17
figure 9: Average wind roses determined from the climate simulation with CLM (A1B) ) for the KLAPS target
area for the decades 2051-2060, 2061-2070 und 2071-2080 for the pressure range between 925 hPa and
850 hPa ...............................................................................................................................................................18
figure 10: Average wind roses determined from the climate simulation with CLM (A1B) ) for the KLAPS target
area for the decades 2081-2090 and 2091-2100 for the pressure range between 925 hPa and 850 hPa ........19
figure 11: Average wind roses determined from the climate simulation with CLM (A1B) ) for the KLAPS target
area for the time slices 2021-2050 and 2071-2100 for the pressure range between 925 hPa and 850 hPa .....20
figure 12: Average wind roses determined from the climate simulation with CLM (A1B) ) for the KLAPS target
area for the time slices 1971-2000 (C20) and 2001-2100 (A1B) and 1971-2100 (C20 & A1B) for the pressure
range between 925 hPa and 850 hPa ................................................................................................................21
figure 13: u and v component and calculated wind speed (m/s) for a 3-hour average in CLM_C20_1 record for
the 850 hPa pressure level .................................................................................................................................24
figure 14: Projected changes in wind speed for models REMO and CLM from a study of the CSC Hamburg for
KLIFF and the KLIMZUG-Nord project ...............................................................................................................25
figure 15: Signal of change for the mean wind speed at 10 m a.s.l. for Europe .................................................26

                                                                                                                                                                       4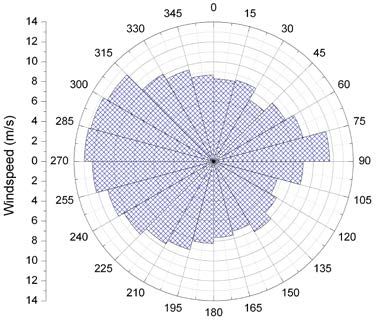
List of abbreviations

%                       per cent
‰                       per mill
A1B                     IPCC-scenario A1 balanced use of fossil and non fossil energy sources
C20                     control periode 1971-2000 (20. Century)
CERA                    Climate and Environmental Retrieval and Archive
CDO                     Climate Data Operator
CLM                     Regionales Klimamodell (Climate Limited Area Model)
DKRZ                    Deutsches Klimarechenzentrum (German Climate Computing Center)
CSC                     Climate Service Center Hamburg
h                       hour
hPa                     hektopascal (millibar)
IPCC                    Intergovernmental Panel on Climate Change
KLIFF                   Klimafolgenforschung in Niedersachsen (Climate impact and adaptation research in
                        Lower Saxony)
KLIMZUG-NORD            Forschungsprojekt zum Klimawandel in der Metropolregion Hamburg (Strategies
                        adapted to climate changes concerning the metropolitan area of Hamburg)
km                      kilometre
m/s                     metre per second
m a.s.l.                metre above sea level
NetCDF                  Network Common Data Format
REGKLAM                 Regionales Klimaanpassungsprogramm Modellregion Dresden (Regional Climate
                        Change Adaptation Programme Dresden Region)
REMO                    Regional climate model (Regionalmodell für Klimamodellierung und Wettervor-
                        hersage; Regional model for climate modeling and weather forecast)
u                       u (east-west)-coordinate of wind speed
v                       v (north-south)-coordinate of wind speed
WETTREG                 Regional climate model (WETTerlagenbasierte REGionalisierungsmethode; Regional-
                        isation method based on weather conditions)
WiRi                    Wind direction
WiTraK                  Windfeld-Transport- und Klimatologiesystem (Wind field transport and climatology
                        system)
WiV                     Wind speed

                                                                                                      5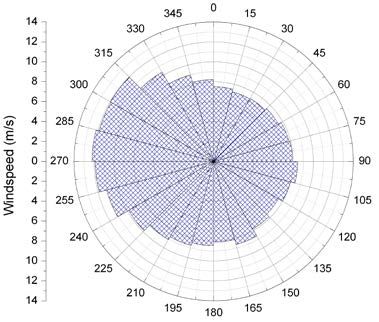
1 Motive and objective
The cross-border cooperation Saxony-Poland project KLAPS „climate change, air pollution and contamination
of ecosystems in the Polish-Saxon border region” which is funded from June 2014 to August 2012, will be led
by the Saxon State Office for Environment, Agriculture and Geology in Dresden (Lead Partner) and the IMGW
(Instytut Meteorologii i Gospodarki Wodnej) and the University of Breslau. It examines the impact of recent
and projected climate change and the effects of air pollutants on existing ecosystems. For the joint border
region Germany-Poland previously lacking both a transnational and coordinated climate diagnosis and projec-
tion, as well as an analysis of air pollutants in combination with changing wind conditions.

The main objective of the project is to predict the likely impact of climate change on population and tourism, as
well as the spread and distribution of air pollutants as a potential risk for existing ecosystems in the border
area with a common methodological approach for the entire project area. This will be carried out by air pollu-
tant diagnoses for the present and for the future simulations in the Polish-Saxon border region and climate.

2 Topic
For the projection of transport and deposition of air pollutants in the common border area, the change in wind
conditions (wind direction, wind strength) should be investigated. The creation of wind roses (frequency distri-
butions of wind direction and speed) for the period 1971-2100 will be embedded into the air pollutant projec-
tion, which is a novel approach in this combination.

The objective of the contract is the creation of wind roses in the Polish-Saxon border region as a part of the
KLAPS project. The development of wind roses for the KLAPS project area should be made for the free at-
mosphere using a dynamic climate model. The application of the dispersion model FRAME required wind sta-
tistics from the pressure level between 950 hPa and 850 hPa. Not all dynamic models provide climate data for
those levels, which can be derived from the radiosonde data. Using the outputs of a dynamic regional climate
model is recommended. These models base on same physical conditions as the global models but due to its
finer resolution (7-20 km) the regional models consider the influence of the topography in the target area
(13.7°E/50.67°N - 17.31°E/52.28°N) much better. Thus, the mountain ranges of the project area (Erzgebirge,
Zittauer Gebirge, Góry Izerskie, Karkonosze and Jesionik Wysoki) with maximum heights up to 1.600 m al-
ready have a significant influence on the flow conditions in the target area. It should be created the wind roses
of mean annual frequency distributions of wind direction and wind roses of the mean annual wind speed for
the following periods between 1971-2100:

 for the reference years 2000, 2005, 2010

 decades from 1971-2100

 30-year periods 2021-2050, 2071-2100

 average over the entire period 1971-2100, 2001-2100.

                                                                                                               6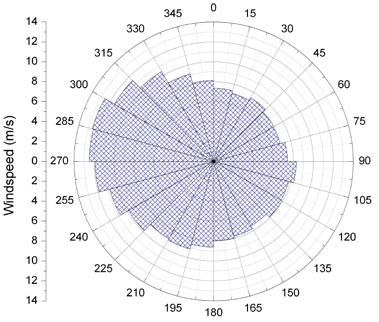
The wind rose distribution is presented in 24 classes according to the following scheme:

           from [deg]      to [deg]          freq [ - ]        windspeed [m/s]

           0               14                0.024             4.9

           15              29                0.018             5.2

           …

           345             359               0.030             5.6

For validating the results the mean wind roses based on radiosonde measurements of the stations Lindenberg
(Germany), Wroclaw (Poland) and Prague (Czech Republic) should be compared with the results of the dy-
namic climate model during the observation period. In addition, a literature study was carried out to classify the
results to studies already existing in Central Europe.

3 Climatic characterisation of the KLAPS
target area
The target area with a dimension of 250 km x 180 km is situated in south-western Poland and eastern Saxony
(figure 1). The topography is characterised by lowlands and various mid-range mountains (Erzgebirge, Zittauer
Gebirge, Góry Izerskie, Karkonosze and Jesionik Wysoki). The highest elevations reach 1.600 m:

 Gebirge                               Höchste Erhebung                                  Höhe (m ü. NN)

 Osterzgebirge                         Kahleberg                                               905

 Zittauer Gebirge                      Lausche                                                 793

 Góry Izerskie                         Wysoka Kopa                                            1127

 Karkonosze                            Śnieżka                                                1602

 Jesionik Wysoki                       Praděd                                                 1491

The regions of eastern Saxony and Lower Silesia, the main objective of the project area, are macro climatic
classified in the transitional climate between maritime western European and continental eastern European
climate. This climate zone is characterized by a constant exchange of maritime and continental weather condi-
tions. Connected with the supply of the associated air masses a variety of meteorological phenomena is
caused. The maritime influence, however, is dominant. The predominant wind direction in the region is west to
southwest, but frequently also south-westerly winds occur. In eastern Saxony, the yearly total precipitation is
700-850 mm, in mountainous areas up to 1.000 mm. The average temperature in summer is 14-18°C, in win-
ter around 0°C. In Lower Silesia it rains especially in spring and autumn. In the region of Sudetes the yearly
precipitation range is between 800 – 1.400 mm. In summer it is generally warm to hot with average tempera-
tures between 16°C and 21°C, in winters there are average temperatures around -5°C (Wroclaw) (SMUL
2008, Polska 2013).
The climate of the different mountain regions is characterised by cool summers (mean in July in Karkonosze
12-14°C) and moderate summery precipitation (Śnieżka: maxima of June-September 1.160 mm). The moun-
tains are rich in forests (about 650 m a.s.l. spruce is dominating), above the climatic timberline (at 1.200 m
a.s.l.) there are high mountain mats used as pastures (Academic, 2013). The Góry Izerskie is characterised by

                                                                                                                7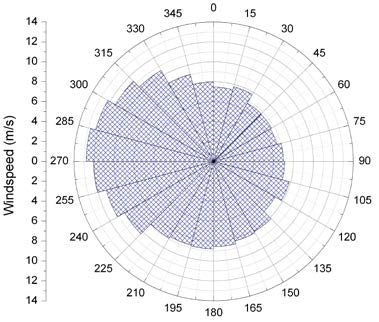
a very harsh climate. The distribution of temperature extremes often depends on the type and composition of
the ground, causing, e.g. cold air pools. The winter climate is dominated by formation of temperature inver-
sions combined with a reduced air circulation. The prevailing wind direction is northwest in the Góry Izerskie
(Iser-Magistrale, 2013). The climate in the Karkonosze is marked as subalpine to alpine in the heights of
1.200 m and is characterised by frequent weather changes. The ridge is one of the most wind-exposed areas
of Europe. Prevailing wind direction is west. Winds occur from south and southeast, which transport dry and
warm air masses into the area, occur less frequently. On the Polish side of the Karkonosze foehn is a common
weather phenomenon (mainly in spring and autumn), which occurs during inflow of moist air from the south-
west. Like in the Góry Izerskie in winter there are often temperature inversions (NP Riesengebirge, 2013). In
Jesionik Wysoki the climate is also very rough and comparable to the Alps at the altitude of 2.000 m
(Tschechien, 2006).

                figure 1: Target area for the creation of wind roses in the KLAPS project

The climate of the Erzgebirge ridge also can be characterised as rough. The temperatures throughout the year
are significantly lower than in the lowlands and the summer is noticeably shorter and there are often cool days.
The mean annual temperature is 3-5°C (Zinnwald: 4.5°C). The wind speed increases with height, but is often
modified by channelling in valleys and flow over hilltops, and it also can attenuated in valleys and hollows.
Southerly inflow during the winter months can cause effects of foehn at the northern edge of the Erzgebirge
(mainly at high pressure impact with inversions). Another phenomenon is the "Bohemian wind" - a regional
wind in winter. It is caused by the outflow of cold air from the Bohemian basin of the valleys of the river Elbe
and Neiße connected to the overflow of the ridges of the eastern Erzgebirge and Zittauer Gebirge. The "Bo-
hemian wind" is characterised by high wind speeds in conjunction with gusts from south to southeast (SMUL,
2008). The Zittauer Gebirge is characterised by continental climate. At the higher peaks (e.g. Lausche and
Hochwald) northern and north-westerly winds cause orographic precipitation. This is connected with strong
summer rainfall and extensive snowfalls in the winter episode. As already stated, in relevant atmospheric con-
ditions the "Bohemian wind" occurs in the Zittauer Gebirge too (naturparkblicke, 2013).

4 Data base
                                                                                                              8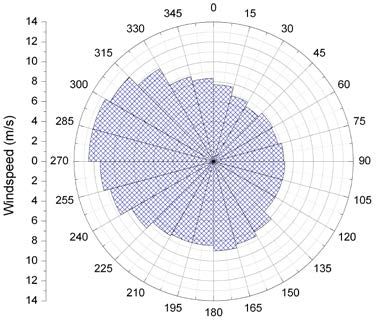
The data base for the creation of the wind statistics in the target area of the KLAPS project is derived from the
first run of the CLM_A1B simulation. The data in selected data stream 3 is provided on a geographical grid.

The netCDF files are structured as follows:

         gridsize (Zielgebiet)   = 152
         xname                   = lon
         yname                   = lat
         xunits                  = degrees_east
         yunits                  = degrees_north
         xsize (Zielgebiet)      = 19
         ysize (Zielgebiet)      =8
         xfirst (Zielgebiet)     = 13,8
         xinc                    = 0,2
         yfirst (Zielgebiet)     = 50,8
         yinc                    = 0,2
         timestep                = 3h

The data were obtained from the CERA database of the German Climate Computing Centre (DKRZ). CERA is
an acronym for Climate and Environmental Retrieval and Archive. The wind data for the regional climate mod-
                    th
el CLM for C20 (20 century) and the IPCC scenario A1B have a temporal resolution of three hours. The rec-
ords for the periods 1960-2000 (C20) and from 2001 to 2100 can be downloaded with the software Jblob pro-
vided by the DKRZ from the database.

The wind statistics is created on the base of the model output of the climate model CLM (Climate Limited Area
Model). The model is a dynamic high-resolution regional model (ca. 20 km). The model provides time series of
meteorological and atmospheric elements near the ground. Among others, the u and v component of wind
speed at different pressure levels is provided. The u component represents the east-west component of the
wind speed, and the v-component is for the north-south component.
In the specification of the creation of wind statistics the range between 950 hPa and 850 hPa is required. The
pressure level 950 hPa is not provided in the CLM data and must be derived from analytic approaches using
standard atmosphere leading to uncertainties, which would subsequently affect the wind roses itself. There-
fore, the CLM model data for the 925 hPa level were used. However, the average heights above sea level
were determined using the approach of the Standard Atmosphere corresponding to the pressure level:

 925 hPa =      760 m a.s.l. (950 hPa =   540 m a.s.l.)

 850 hPa = 1.460 m a.s.l.

Both pressure levels are not in the free atmosphere, as indicated in the specification, but in the underground-
influenced boundary layer. That means that influences of topography and land are included in the wind statis-
tics.

5 Methods

                                                                                                               9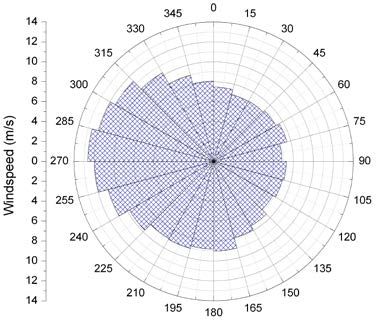
The pressure level 925 hPa and 850 hPa are available as a direct output in the regional climate model CLM3
only.

A regional climate model with a resolution of about 20 km (CLM) provides 152 grid points for the target area,
which are summarised by linear interpolation to a mean flow field. The processing of netCDF files was per-
formed using the software CDO:

 Cutting the target area (figure 2)

       Rectangle        13.7°E / 50.67°N (13°41'60"E / 50°40'12''N)
                        17.31°E / 52.28°N (17°18'36"E / 52°16'48''N)

       cdo sellonlatbox,lon1,lon2,lat1,lat2 ifile ofile

 Calculation of area means (weighted mean) for u and v component of wind speed (m/s) for pressure levels
 925 hPa and 850 hPa, which are present in the raw data for each model time step

       cdo fldmean u/v-ifile u/v_mean-ofile

 Calculation of mean value of the two pressure levels 925 hPa and 850 hPa from the field means for u and v
 component (m/s)

        cdo divc,2 –add u/v925_mean-ifile u/v850_mean-ifile U/V_mean-ofile

                 figure 2: Spatial coverage of the CLM data set for the creation of the
                 wind roses in the KLAPS project and position of the radiosonde stations

 Calculation of the area mean of the wind speed (m/s) for the range between 925 hPa and 850 hPa from the
 u and v component (between 925 hPa and 850 hPa)

        windspeed = u 2 + v 2

       cdo sqrt –add –sqr U_mean-ifile – sqr V_mean-ifile WiV-ofile

 Calculation of the area mean of the wind directions (deg) in 925 hPa and 850 hPa pressure levels

10 180
⋅ arctan 2(− u ,−v )
180
winddir = with = 57,3
π π
cdo mulc,57.3 –atan2 – mulc,-1 U_mean-ifile –mulc,-1 V_mean-ifile UV-ofile
(the angle will be between -180 und 180 degree)
cdo ltc,0 UV-ofile mask
(creates a mask with value = 1 for all values < 0 and else value = 0)
cdo ifthen mask –addc,360 UV-ofile unter0
(for values < 0 use values from ifile, add 360 and set missing value else)
cdo ifnotthen mask UV-ofile ueber0
(for values > 0 use values from ifile and missing value else)
cdo ifthenelse mask unter0 ueber0 WiRi
(merge both files in file with wind direction as result)
Merging files for wind speed and wind direction in an ordered time series.
cdo mergetime ifile1 ifile2 ifile3 … ofile
116 Results
The Wroclaw University created wind roses for the pressure range between 950 hPa and 850 hPa based on
measurements of radiosondes at the weather stations Lindenberg (Germany), Prague (CZ) and Wroclaw (PL).
These measurements represent the mean of frequency distributions of wind direction and wind speed for the
years 2000, 2005 and 2010 (figure 3). The wind roses based on measurements of radiosondes should be
used to validate the wind roses based on model output.
2000 2000
2005 2005
2010 2010
figure 3: Wind roses determined from radiosonde for the KLAPS target area for the years 2000, 2005
and 2010 for the pressure range between 950 hPa and 850 hPa
left: frequency (‰) of occurrence of wind directions
right: mean wind speed (m/s)
12The frequencies of occurrence of certain wind directions show the dominance of westerly winds. For the year
2000 also a higher incidence of southern winds was determined compared to other sectors. The wind roses for
the years 2005 and 2010, in contrast, show a more frequent south easterly inflow. The data obtained by radio-
sonde reach wind speeds up to 8 m/s.
The lowest wind speeds occur in 2005 in the north eastern sector. In this sector, also the lowest frequencies
were determined. In 2005 and 2010 the mean wind speeds outside the western sector reach 5-6 m/s.
The wind speed and frequency statistics for the years 2000, 2005 and 2010 derived from the model data of the
regional climate model CLM is shown in figure 4 and figure 5. Compared to the wind roses using data from
radiosonde frequency and wind speed, a different distribution of the frequencies of wind direction is detected.
Furthermore, the wind speeds are different from that of the statistics based on radiosonde data. The model
data show a higher incidence of wind from north (up to 13.5%) in 2000, in 2005 and 2010 the wind data de-
rived from the model data show frequencies higher than those determined from the radiosonde data.
2000 2000
2005 2005
figure 4: Average wind roses determined from the climate simulation with CLM (C20) for the KLAPS
target area for the years 2000 and 2005 for the pressure range between 925 hPa and 850 hPa
left: frequency (‰) of occurrence of wind directions
right: mean wind speed (m/s)
132010 2010
figure 5: Average wind roses determined from the climate simulation with CLM (C20) for the KLAPS
target area for the year 2010 for the pressure range between 925 hPa and 850 hPa
left: frequency (‰) of occurrence of wind directions
right: mean wind speed (m/s)
The statistics calculated from the model output shows wind speeds up to 5 m/s higher compared to average
wind speeds measured by radiosonde. Furthermore the statistics of wind speed from model data shows higher
wind speeds in the eastern and south-eastern sectors for 2000 and 2010 compared to data from the radio-
sondes. It also should be noted for 2005 that the mean wind speeds calculated from the CLM model data
show a higher variability than those determined by soundings. The wind speeds in the eastern sectors are
much lower than in the western sectors, what is not observed in the observed data.
The data from the regional model CLM represent the typical wind statistics adequately well. Differences to the
measurements are caused by the comparison of areal data from the model with selectively collected data from
the radiosondes as well as by the different low pressure level used from calculation (925 hPa vs. 950 hPa).
It should be examined whether the differences in wind statistics (frequencies and wind speed) also occur for
run 2 and 3 of the CLM model. Anomalies of the model data from observed data (bias) were found for the CLM
model, especially in the precipitation data and adjusted by a bias correction. However, the correction of the
wind data, if necessary, must be the subject of further investigation.
14Figure 6 shows the average wind roses for the decades 1971-1980 to 1991-2000. Derived from the CLM
model data statistics of frequency and wind speed they are based on the data from the C20 record.
1971-1980 1971-1980
1981-1990 1981-1990
1991-2000 1991-2000
figure 6: Average wind roses determined from the climate simulation with CLM (C20) for the KLAPS
target area for the decades 1971-1980, 1981-1990 and 1991-2000 for the pressure range between
925 hPa and 850 hPa
left: frequency (‰) of occurrence of wind directions
right: mean wind speed (m/s)
The frequencies in the decades show a similar distribution with a maximum in the western sectors and the
minimum in the northeast. Wind from the sector from 270-285° occurs most frequently with 10.5 - 10.6%. The
model data also show low frequencies in the south-eastern and southern sectors. The frequencies are not
higher than 4%. The statistics for frequency are similar to that from the radiosonde, indicating a good imaging
capability of the real conditions by the model.
15The wind roses for the mean wind speed also show a maximum in the western sectors. In the decade 1971-
1980 the maximum of 12.2 m/s can be found in the sector 285°-300°. The lowest wind speeds are observed in
the sectors of north to northeast in all three decades. Also in all three decades a slightly higher wind speed
than in the adjacent sectors is recorded for the eastern sectors between 75° and 120°. Individual sectors with
higher wind speed as in the single years 2000 and 2010 do not occur in the average wind speeds over the
decades.
Figure 7 to figure 10 show the wind roses for the decades 2001-2010 to 2091-2100. The decades are charac-
terised by a very low frequency of wind from the sectors between 0° and 150° (e.g. in 2001-2010 in the sector
60°-75°: 1.1% and in 2081-2090 in sector 60°-75°: 1.0%). The highest frequencies can be found in all decades
in the sectors from 255° to 300°, the maximum frequency of 12.7% occurs in the decade 2081-2090 in the
sector 270°-285°.
2001-2010 2001-2010
2011-2020 2011-2020
figure 7: Average wind roses determined from the climate simulation with CLM (A1B) ) for the KLAPS
target area for the decades 2001-2010 and 2011-2020 for the pressure range between 925 hPa and
850 hPa
left: frequency (‰) of occurrence of wind directions
right: mean wind speed (m/s)
162021-2030
2021-2030
2031-2040 2031-2040
2041-2050 2041-2050
figure 8: Average wind roses determined from the climate simulation with CLM (A1B) ) for the KLAPS
target area for the decades 2021-2030, 2031-2040 und 2041-2050 for the pressure range between
925 hPa and 850 hPa
left: frequency (‰) of occurrence of wind directions
right: mean wind speed (m/s)
172051-2060 2051-2060
2061-2070 2061-2070
2071-2080 2071-2080
figure 9: Average wind roses determined from the climate simulation with CLM (A1B) ) for the KLAPS
target area for the decades 2051-2060, 2061-2070 und 2071-2080 for the pressure range between
925 hPa and 850 hPa
left: frequency (‰) of occurrence of wind directions
right: mean wind speed (m/s)
182081-2090 2081-2090
2091-2100 2091-2100
figure 10: Average wind roses determined from the climate simulation with CLM (A1B) ) for the KLAPS
target area for the decades 2081-2090 and 2091-2100 for the pressure range between 925 hPa and
850 hPa
left: frequency (‰) of occurrence of wind directions
right: mean wind speed (m/s)
The mean wind speeds are distributed similar to the frequencies in the sectors. In the sectors of 255° to 300°
(in some cases up to 315°) the highest mean wind speeds occur. Computed of the CLM model data, the high-
est average wind speed is 12.9 m/s from the sector 270°-285° in the decade 2091-2100. The lowest average
wind speeds can be found in the sectors where the lowest frequencies are listed. It is noteworthy that in the
sectors between 90° and 120° a second maximum of the mean wind speeds can be found.
The increase and decrease of the maximum frequencies between the decades do not follow a recognisable
st
pattern. Towards the end of the 21 Century the frequencies seem to be increasing slightly in the western
sectors from 255 to 300 degrees.
A pattern of increasing mean wind speeds cannot be seen. The maximum wind speed of 12.6 m/s in the dec-
ade 2001-2010 is excelled in the decades 2041-2050 and 2081-2090, but in the other decades, the maxima of
the mean wind speed are below this value. Although the average wind speeds in the various sectors between
the decades show small increases or decreases, a significant change is not observed.
However, only averages over years, decades, 30-year time slices or even 100 years are considered in this
work. It is therefore not excluded that in the period to 2100 an increase of wind events with higher wind speeds
will appear.
19The wind statistics for the 30-year time slices 2021-2050 and 2071-2100 is shown in figure 11. The frequen-
cies show a maximum in the western sector (255° to 300°). In the adjacent sectors also higher frequencies of
wind direction with about 8% occur. In the time slice 2071-2100 compared to the 2021-2050 time slice in the
western sectors between 225° and 330°a small increase in the frequencies is recorded. The sectors between
330° and 30° and 65° to 210° show a slight decrease in the same period. The maximum frequency increases
from 11.4% in the time slice 2021-2050 to 11.9% in the 2071-2100 time slice.
The average wind speed increases in the sectors 65° to 315° in the time slice 2071-2100 compared to the time
slice 2021-2050. In the other sectors the wind speed decreases. In the time slice 2071-2100 the highest aver-
age wind speed is 12.5 m/s in the sector 270°-285°, compared to 12.4 m/s in the same sector for the time slice
2021-2050.
2021-2050 2021-2050
2071-2100 2071-2100
figure 11: Average wind roses determined from the climate simulation with CLM (A1B) ) for the KLAPS
target area for the time slices 2021-2050 and 2071-2100 for the pressure range between 925 hPa and
850 hPa
left: frequency (‰) of occurrence of wind directions
right: mean wind speed (m/s)
Compared to the time slice 1971-2000 (see figure 12 above) in the time slices 2021-2050 and 2071-2100 the
frequencies increase in the western sectors and decrease in the south-western sectors. The distribution of the
mean wind speed shows that a local maximum in time slice 1971-2000 is impossible to detect in the middle
st
and in the end of the 21 Century. The wind speeds in the sectors of 75° to 135° are higher in the time slices
2021-2050 and 2071-2100 than 1971-2000.
20Figure 12 shows the wind climatology for the periods 1971-2000, 1971-2100 and 2001-2100.
1971-2000 1971-2000
1971-2100 1971-2100
2001-2100 2001-2100
figure 12: Average wind roses determined from the climate simulation with CLM (A1B) ) for the KLAPS
target area for the time slices 1971-2000 (C20) and 2001-2100 (A1B) and 1971-2100 (C20 & A1B) for the
pressure range between 925 hPa and 850 hPa
left: frequency (‰) of occurrence of wind directions
right: mean wind speed (m/s)
The frequencies of wind directions occurring in the periods 1971-2000, 1971-2100 and 2001-2100 show a very
similar distribution. Wind in the sectors between 15° and 135° occurs with very low probability. The frequency
within these sectors is mostly below 2%. In the sectors between 255° and 300° the highest frequencies are
determined. In the period 2001-2100 compared to 1971-2000 an increase in frequency occurs in the sector
225° to 360°. In the other sectors the frequencies decrease. The largest increase is observed in the sectors
from 255° to 300° - it is between 0.6% and 1.0%. The decrease in the sectors of 105° to 165° is 0.4% to 0.6%.
21Comparing the time slice 1971-2000 with the period 1971-2100 the same pattern occurs, but the changes are
much lower (increase between 0.1% and 0.2%, decrease from 0.1% to 0.15%).
In all three periods the mean wind speed has its maximum in the western sectors. In the sectors of 240° to
330° the mean wind speeds are greater than 10.0 m/s. The largest values can be found in the period 2001-
2100. This represents an increase between 0.1 m/s and 0.5 m/s compared to the period 1971-2000. Com-
pared to the period 1971-2100, the average wind speed increases 0.1 m/s at most. A decrease in mean wind
speed was found only in the sectors of 0° to 210°. The distribution of the mean wind speed is almost identical
in all periods. However, in the time slice 1971-2000 a maximum in wind speed in the eastern sectors is much
less obvious in the later time slices.
All related ascii data of figure 4 to figure 12 are saved as *txt files on the attached CDROM.
7 Conclusion
For the target area of the project KLAPS a wind climatology was created from projection data of the regional
climate model CLM, which has a spatial resolution of ca. 20 km. The temporal resolution of the data set is
3 hours. The data are available as netCDF files at DKRZ and can be obtained from the website of the CERA
database.
The mean annual frequency distributions of wind direction and the mean annual wind speed were calculated
for the following periods between 1971-2100:
for the reference years 2000, 2005, 2010
decades from 1971-2100
30-year periods 2021-2050, 2071-2100
average over the entire period 1971-2000, 1971-2100, 2001-2100.
The data was processed with software CDO (Climate Data Operators), a collection of command line operators
for processing and analysis of climate data. CDO is provided by the Max Planck Institute for Meteorology in
Hamburg. Furthermore OriginLab was used for visualising the data.
The final result of data analysis was an average of wind speed and wind direction frequency between the
925 and 850 hPa pressure levels. The pressure level 950 hPa is not provided by the CLM model output. A
conversion from the 925 hPa level to the 950 hPa level does not likely improve the accuracy of the results,
since additional uncertainties are included using a standard atmosphere for the data conversion.
The comparison between model results and observations from radiosonde for the pressure range from
950 hPa to 850 hPa shows differences in both the distribution of the frequencies and the absolute wind speed.
The model data show a higher frequency of wind directions from the west and wind speeds which are 5 m/s
higher in the maximum in comparison with measurements. The data from the regional model CLM represent
the typical wind statistics adequately well. Differences to the measurements are caused by the comparison of
areal data from the model with selectively collected data from the radiosondes as well as by the different low
pressure level used from calculation (925 vs. 950 hPa). In addition, the influence of topography and surface
roughness will is slightly considered in the regional model.
22The increase and decrease of the maximum frequencies between the decades of 1971-2100 do not follow a
st
recognisable pattern. Towards the end of the 21 Century the frequencies seem to be increasing slightly in the
western sectors from 255 to 300 degrees. The average wind speed in the various sectors shows small in-
creases or decreases between the decades. A significant change, however, is not observed.
Compared to the time slice 1971-2000 increases can be found both in frequency and wind speed for the time
slices 2021-2050 and 2071-2100 as well as for 1971-2100 and 2001-2100. The changes have not been exam-
ined for significance. A noticeable maximum in wind speed in the eastern sectors in the time slice 1971-2000
cannot be found in the later time slices.
Overall, a change signal for a certain direction in the frequency as well as the wind speed cannot be deter-
mined. This is also observed in other studies (see chapter 8).
The time series of wind speeds (u, v components) calculated by the climate model CLM and derived time se-
ries of wind speed and wind direction are considered to be robust, because the drive of the regional climate
model CLM is based on a Global Circulation model which depicts the typical flow patterns in the atmosphere
well.
However, the calculated wind roses for the target area of the project KLAPS remain uncertain due to the inad-
equate inclusion of real influences of topography and land use on the wind field in the atmospheric boundary
layer.
The pressure levels 950 hPa, 925 hPa and 850 hPa correspond approximately to a height of between 550 m
and 1450 m a.s.l. The wind (wind direction and speed) in the target area is therefore influenced by the topog-
raphy. The highest peaks reach 1600 m a.s.l. Furthermore the target area of the project KLAPS is rich in for-
ests. Thus the roughness plays an important role for a reliable statement on the prevailing wind conditions. A
mass consistent wind model such as WiTraK (Kerschgens, 1995) would include the characteristics of the land
surface in the calculation of wind climatology and thus reflect the influence of land use and terrain topography.
23Figure 13 shows inhomogeneity induced due to land use and topography in the target area. It is shown the u
and v components as well as the calculated wind speed from the CLM record for a time step of 3 hours.
.
figure 13: u and v component and calculated wind speed (m/s) for a 3-hour average in
CLM_C20_1 record for the 850 hPa pressure level
8 Literature to studies conducted so far in
Central Europe
To assess the obtained results, a literature study was made on studies carried out for Central Europe so far
studies on the change in wind speed due to climate change mainly exist in relation to extreme events (wind-
throw in forests and storm surges along the coasts). Therefore, the focus here is on extreme value statistics.
Two studies from the wind energy industry, focusing on the mean wind speeds, examine long-term trends in
northwest and northern Europe. In one of the studies the change signals based on wind indices (Atkinson,
2006), the other one analysed model data from AOGCMs (Atmosphere Ocean General Circulation Models)
(Pryor, 2005). Both of the studies come to the conclusion that the mean wind speed will decrease. The former
study is based on recent data up to 2005, the second works with projection data to 2100. However, the study
st
based on model data also shows that the mean wind speed will be lower at the end of 21 Century, but in
other periods, compared to 1961-1990, no significant change could be determined.
The main conclusion to current studies is that significant developments in the wind conditions in the lower
troposphere cannot currently be determined over the past decades. This is due to lack of reliable measure-
24ments of the wind. However, it can be indirectly derived from pressure data that the wind vector varies greatly
from year to year. Considered over long periods of time, some pronounced calmer and more active decades
become noticeable. However, there is not a trend in wind speed detected on the last 100 years (Storch, 2010).
In northern Germany, according to climate model predictions, only a very small increase in wind from 1-4% is
expected by the end of the century (Storch, 2010; Norddt. Klimatlas, 2013). The third workshop report of the
KLIMZUG project northwest2050 expects a slight increase in the mean wind speed for the future, but only the
dynamic climate models REMO and CLM show that change. WETTREG as a statistical-dynamical model pro-
jects decreasing mean wind speeds (nordwest2050, 2010). For Lower Saxony the Climate Service Center &
Max Planck Institute for Meteorology in Hamburg calculated change signals for wind speed as part of climate
change projections and effects of climate change on the local level. In the estimation of the bandwidth of the
climate development in Lower Saxony the projected changes in wind speed for the regional climate model
REMO and CLM were identified.
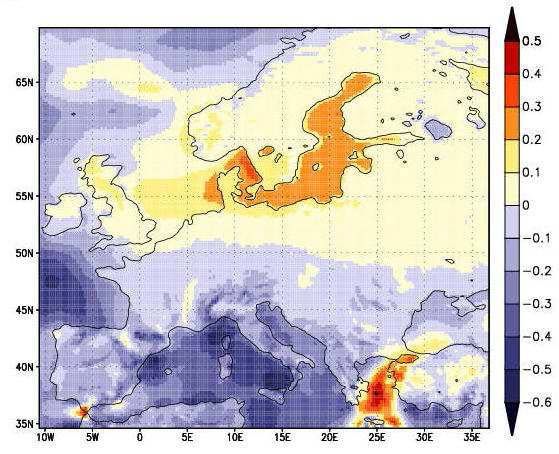
Figure 14 shows the projected change signals for this study for the periods 2021-2050 vs. 1971-2000 and
2071-2100 vs. 1971-2000 as an annual average. The change signals are further subdivided according to sea-
sons. The authors pointed out the large uncertainties in change signals (Moseley, 2013).
figure 14: Projected changes in wind speed for models REMO and CLM from a study of the CSC Ham-
burg for KLIFF and the KLIMZUG-Nord project
25Further investigation of the mean wind speeds for Europe at 10 m a.s.l., also show only a very small increase
in wind speed (e.g. figure 15). The change rate is 0-0.1 m/s or -0,1-0,1 m/s (Walther, 2006; Hennemuth,
2008).
2021-2050 vs. 1961-1990, A1B_1 – C20_1 2071-2100 vs. 1961-1990, A1B_1 – C20_1
figure 15: Signal of change for the mean wind speed at 10 m a.s.l. for Europe
Studies in the narrower surroundings of the target area of the project KLAPS do not exist. Until the end of the
st
21 Century for an estimation of the change the Regional Climate Atlas of Germany can be used (Regionaler
Klimaatlas Dtl. 2013). There cannot be found particular trends in Saxony, as in the Saxony region outweigh
the areas, in which do not match any computations relating to the climate change in the average wind speed.
st
Until the end of the 21 Century (2071-2100) is specified for possible changes in the average wind speed
throughout the year compared to today (1961-1990): unclear: -1% to +2% for 2071-2100 vs. 1961-1990; 0% to
+1% for 2021-2050 vs.1961-1990. The results are valid for a height of 10 m a.s.l.
26References
Academic dictionaries and encyclopedias: Sudeten
[http://universal_lexikon.deacademic.com/190892/Sudeten; download 02.07.2013]
Atkinson, N. et al. (2006): Long-term wind speed trends in northwestern Europe. Technical report, Garrad
Hassan
Bernhofer, C., Matschullat, J., Bobeth, A. (Hrsg.) (2011): Klimaprojektionen für die REGKLAM-Modellregion
Dresden. Publikationsreihe des BMBF-geförderten Projektes REGKLAM – Regionales Klimaanpassungspro-
gramm für die Modellregion Dresden, Heft 2. Rhombos-Verlag Berlin.
Die Iser-Magistrale für Wanderungen. Teil des Projekts „Neuer Kammweg“, im Rahmen der Gemeinschaftsini-
tiative INTERREG III A durch die EU kofinanziertes Projekt [http://www.jizerskamagistrala.cz/de/isergebirge-
/die-natur-des-isergebirges/; download 02.07.2013]
Hennemuth B et al. (2008): Change of Wind Speed in Europe in Regional Climate Model Scenario Projections.
Vortrag im Rahmen der DEWEK 2008, Bremen 26.11.2008
Kerschgens M. et al. (1995): WiTraK (Windfeld-Transport- und Klimatologiesystem). Ann. Meteorol. 31: 135-
136
Moseley, C et al (2013): Klimawandelprognosen für Niedersachsen und Auswirkungen des Klimawandels auf
die kommunale Ebene. Präsentation Neustadt am Rübenberge 11.03.2013
naturparkblicke.de – Unterwegs im Naturpark Zittauer Gebirge. Publikation des Landschaftspflegeverbandes
„Zittauer Gebirge und Vorland“ e.V. und der Projektgruppe naturparkblicke.de (gefördert durch EPLR Sach-
sen) [http://www.naturparkblicke.de/index.php?option=com_content&view=article&id=155&Itemid=68; down-
load 02.07.2013]
Norddeutscher Klimaatlas, Norddeutsches Klimabüro [http://www.norddeutscher-
klimaatlas.de/klimaatlas/2071-2100/jahr/mittlere-
windgeschwindigkeit/norddeutschland/uebereinstimmung.html; download 09.07.2013]
nordwest2050: Perspektiven für klimaangepasste Innovationsprozesse in der Metropolregion Bremen-
Oldenburg im Nordwesten: 3. Werkstattbericht Juni 2010. Klimaszenarien für ‚nordwest2050’ Teil 2: Randbe-
dingungen und Beschreibung
Polnischer Nationalpark Riesengebirge, Klima [http://kpnmab.pl/pl/karkonoskie-klimaty,97; download
02.07.2013]
Polska, Offizielles Förderportal der Republik Polen. Praktische Infos: Klima
[http://de.poland.gov.pl/Klima,574.html; download 02.07.2013]
Pryor, S. C. et al. (2005):Climate change impacts on wind speeds and wind energy density in northern Europe:
empirical downscaling of multiple AOGCMs. Clim Res Vol. 29: 183–198, 2005
Regionaler Klimaatlas Deutschland, Regionale Klimabüros, Helmholtz-Gesellschaft. [http://www.regionaler-
klimaatlas.de/klimaatlas/2071-2100/jahr/mittlere-windgeschwindigkeit/sachsen/uebereinstimmung.html; down-
load 02.07.2013]
SMUL (2008): Sachsen im Klimawandel. Eine Analyse. Eigenverlag des Sächs. Staatsministeriums für Um-
welt & Landwirtschaft
Storch v. H., Claussen, M. (Hrsg.): Klimabericht für die Metropolregion Hamburg, 2010
27Tschechien. Illustrierter Reiseführer mit landeskundlicher Einführung. Baedeker, 2006
Walther A. et al. (2006): A high resolution reference data set of German wind velocity 1951–2001 and compar-
ison with regional climate model results. Meteorologische Zeitschrift, Vol. 15 , No. 6, 585-596 (December
2006)
28Herausgeber:
Sächsisches Landesamt für Umwelt, Landwirtschaft und Geologie (LfULG)
Pillnitzer Platz 3, 01326 Dresden
Telefon: + 49 351 2612-0
Telefax: + 49 351 2612-1099
E-Mail: lfulg@smul.sachsen.de
www.smul.sachsen.de/lfulg
Autoren:
Michaela Surke, Majana, Heidenreich, Valeri Goldberg
Technische Universität Dresden
Fakultät Umweltwissenschaften
Professur für Meteorologie
01062 Dresden
Telefon: + 49 351 463-31340
Telefax: + 49 351 463-31302
E-Mail: meteorologie@tu-dresden.de
tu-dresden.de/meteorologie
Redaktion:
Susann Schwarzak
Abteilung Klima, Luft, Lärm, Strahlen/Referat Klima, Luftqualität
Söbrigener Str. 3a
01326 Dresden
Telefon: + 49 351 2612-5511
Telefon: + 49 351 2612-5099
E-Mail: Susann.Schwarzak@smul.sachsen.de
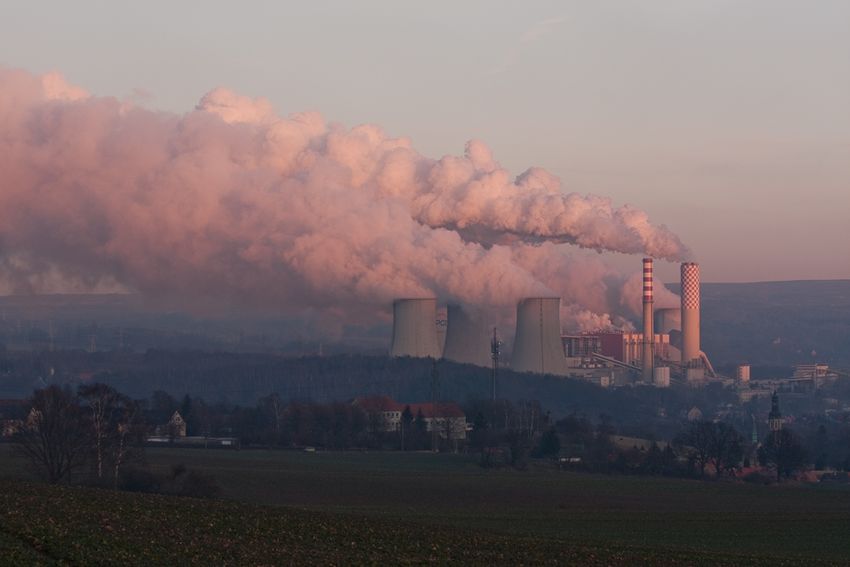
Umschlagfoto:
Kraftwerk Turów, wikimedia.org/Vondraussen, CC BY 3.0
Redaktionsschluss:
11.07.2013
Verteilerhinweis:
Diese Informationsschrift wird von der Sächsischen Staatsregierung im Rahmen
ihrer verfassungsmäßigen Verpflichtung zur Information der Öffentlichkeit
herausgegeben.
Sie darf weder von Parteien noch von deren Kandidaten oder Helfern im Zeit-
raum von sechs Monaten vor einer Wahl zum Zwecke der Wahlwerbung ver-
wendet werden. Dies gilt für alle Wahlen.
Missbräuchlich ist insbesondere die Verteilung auf Wahlveranstaltungen, an
Informationsständen der Parteien sowie das Einlegen, Aufdrucken oder Aufkle-
ben parteipolitischer Informationen oder Werbemittel. Untersagt ist auch die
Weitergabe an Dritte zur Verwendung bei der Wahlwerbung. Auch ohne zeitli-
chen Bezug zu einer bevorstehenden Wahl darf die vorliegende Druckschrift
nicht so verwendet werden, dass dies als Parteinahme des Herausgebers zu-
gunsten einzelner politischer Gruppen verstanden werden könnte.
Diese Beschränkungen gelten unabhängig vom Vertriebsweg, also unabhängig
davon, auf welchem Wege und in welcher Anzahl diese Informationsschrift dem
Empfänger zugegangen ist. Erlaubt ist jedoch den Parteien, diese Informations-
schrift zur Unterrichtung ihrer Mitglieder zu verwenden.
29You can also read