Analysis and Prioritization of the Floating Photovoltaic System Potential for Reservoirs in Korea - MDPI
←
→
Page content transcription
If your browser does not render page correctly, please read the page content below
applied
           sciences
Article
Analysis and Prioritization of the Floating
Photovoltaic System Potential for Reservoirs in Korea
Sung-Min Kim 1 , Myeongchan Oh 2 and Hyeong-Dong Park 2,3, *
 1    Division of Graduate Education for Sustainability of Foundation Energy, Seoul National University,
      Seoul 08826, Korea; snuhyrule@hanmail.net
 2    Department of Energy Resources Engineering, Seoul National University, Seoul 08826, Korea;
      amir117@daum.net
 3    Research Institute of Energy and Resources, Seoul National University, Seoul 08826, Korea
 *    Correspondence: hpark@snu.ac.kr; Tel.: +82-2-880-8808

 Received: 31 December 2018; Accepted: 21 January 2019; Published: 24 January 2019

 Abstract: Photovoltaic (PV) energy is one of the most promising renewable energies in the world
 due to its ubiquity and sustainability. However, installation of solar panels on the ground can cause
 some problems, especially in countries where there is not enough space for installation. As an
 alternative, floating PV, with advantages in terms of efficiency and environment, has attracted
 attention, particularly with regard to installing large-scale floating PV for dam lakes and reservoirs
 in Korea. In this study, the potentiality of floating PV is evaluated, and the power production is
 estimated for 3401 reservoirs. To select a suitable reservoir for floating PV installation, we constructed
 and analyzed the water depth database using OpenAPI. We also used the typical meteorological
 year (TMY) data and topographical information to predict the irradiance distribution. As a result,
 the annual power production by all possible reservoirs was estimated to be 2932 GWh, and the
 annual GHG reduction amount was approximately 1,294,450 tons. In particular, Jeollanam-do has
 many reservoirs and was evaluated as suitable for floating PV installation because of its high solar
 irradiance. The results can be used to estimate priorities and potentiality as a preliminary analysis for
 floating PV installation.

 Keywords: floating photovoltaic system; renewable energy; solar energy; photovoltaic energy;
 greenhouse gas

1. Introduction
      To reduce greenhouse gas (GHG) and protect the environment, renewable energy sources are
increasingly utilized worldwide. According to Renewable Capacity Statistics [1], the total renewable
power capacity for power generation is 2179 GW in 2017, with an 8.3% increase over the previous year.
In particular, the growth rate of photovoltaic (PV) energy is prominent because the price of solar panels
is steadily declining, and various stimulus policies are being implemented. PV energy is considered to
be one of the most promising energy alternatives due to its ubiquity and sustainability. Particularly in
South Korea, PV energy is spreading very quickly after the introduction of the Renewable Portfolio
Standards (RPS) program, which requires electricity providers to increase their renewable energy
production. PV energy is the renewable energy that accounts for the largest portion in Korea today,
except for waste energy and bio-energy. According to the Korea New and Renewable Energy Center
(KNREC, Yongin, Korea), renewable energy supply ratio in Korea is about 19.5%, 61.7%, 4.3%, and 2.5%
for solar, biomass, hydro, and wind, respectively in 2016. The supply of PV energy in Korea was only
7.6 toe (tonne of oil equivalent) until 2006 but increased to a value of 1092.8 toe in 2016. This is because
government policies have been actively implemented, and the public has become actively engaged in

Appl. Sci. 2019, 9, 395; doi:10.3390/app9030395                                  www.mdpi.com/journal/applsci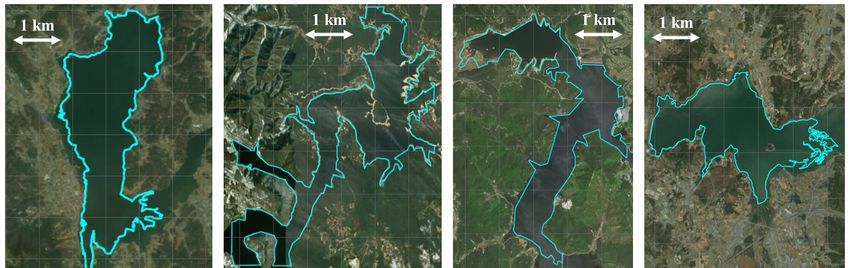
Appl. Sci. 2019, 9, 395                                                                             2 of 17

PV projects to generate profits by selling the produced electricity. However, the excessive installation
of PV facilities has caused various problems. In addition to the damage to the landscape caused by
the installation of solar panels, the residents of areas where the panels have been installed have been
inconvenienced by the reflected light and increase in the ambient temperature. In addition, solar
panels that are swept away in the event of landslides or typhoons can cause safety accidents. In recent
years, there has been an increase in complaints from local residents, as the solar power generation
business has become a means of speculation in the area of PV power generation. These problems
can be even more significant in countries such as South Korea, where available land is scarce, so that
there is not enough area for the installation of solar panels. Therefore, floating PV systems, which can
overcome or alleviate these problems, have attracted considerable attention in these countries.
      In addition to being able to utilize the reflected light from the water surface, the floating PV is
known to be about 11% more efficient than the terrestrial solar panel due to the temperature reduction
effect in water [2]. Solar panels that cover the water can also reduce evaporation [3] and prevent
algae [4] due to shadows by the panels. In other words, the floating PV is advantageous in terms
of efficiency and environmental aspects, in addition to the lack of need for land. Because of these
advantages, floating PV systems installed on water bodies, such as reservoirs or dam lakes, have
increased worldwide and have already been deployed in several countries, including South Korea,
Japan, China, and the US [5]. Although most technological growth occurred between 2007 and
2014, the global installed capacity for floating PV has increased significantly since 2015. Floating PV
installations in the world were estimated at 94 MW by 2016, of which about 60% were known to be
installed in Japan [6]. In 2017, however, the world’s largest floating PV system was installed on the
pit lake of a coal mine in China and is known to have capacity of 40 MW. The system is composed of
120,000 solar panels, supplying the electricity needs of 15,000 households [7]. Recently, South Korea
has been rapidly improving its floating PV technology and increasing installation capacity. The Korea
Water Resources Corporation (K-water, Daejeon, Korea) carried out the first demonstration project
in South Korea at the Hapcheon reservoir in 2014 with a capacity of 100 kW. In addition, K-water
operates South Korea’s first commercial system by producing 500 kW of electricity for approximately
170 households. K-water plans to install 550-MW capacity dam lakes by 2022, and the Korea Rural
Community Corporation (KRC, Naju, Korea) is planning 1900 MW of capacity for the reservoirs
under management.
      Various studies have been conducted to improve and utilize floating PV. There have been many
studies on mooring systems to maintain the balance of panels on the water [8,9], and a solar tracking
system has been actively studied to improve efficiency [10,11]. In recent years, it has become possible to
transmit and receive data from a floating PV through the integration of ICT technology [12]. In addition,
there have been several studies where Geographical Information System (GIS) techniques have been
applied to determine a suitable location for field application and evaluation of the PV potential [13].
Song and Choi [14] evaluated the potential and economic feasibility of a pit lake on the abandoned
mine site in Gangwon-do, South Korea, by assessing shadow effects based on GIS techniques and a
fish-eye lens camera. Lee and Lee [15] evaluated the applicability of floating PV by region based on
the analytic hierarchy process (AHP), considering geographical conditions and weather conditions.
Lee et al. [16] evaluated additional parameters to be considered because of the difference between
conventional and floating PV systems and evaluated the suitability of the Hapcheon dam area.
      There have been many studies regarding individual reservoirs, lakes, and dams, but little research
has been conducted on a national scale. Particularly in countries like Korea where large-capacity
floating PV systems will be installed in the long term, the PV potential of each available area should be
assessed. The purpose of this study is to evaluate the applicability and potential of floating PV for the
approximately 3400 reservoirs registered and managed in Korea.
Appl. Sci. 2019, 9, 395 3 of 17
2. Study Area and Data
In this study, we investigated whether floating PV installation is suitable for reservoirs distributed
in South Korea. There are 3401 reservoirs managed by the KRC as a database that contains information
such as the area of the reservoir, dead water level, full water level, and water storage capacity.
The database was downloaded from the Public Data Portal (PDP, data.go.kr). Spatial data such as
location and boundary information for each reservoir are also managed and provided to the public.
They were downloaded from the National Spatial Data Infrastructure Portal (NSDI, data.nsdi.go.kr).
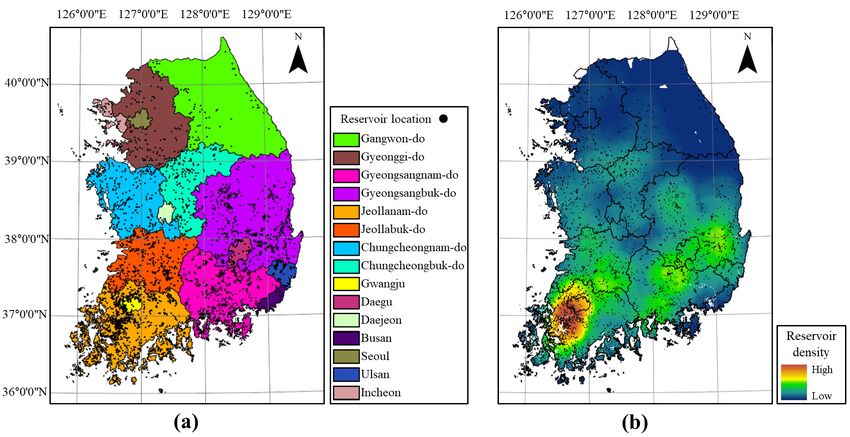
Figure 1a shows reservoir locations, provinces, and some major cities, and Figure 1b shows reservoir
density across the country. It can be seen that the most reservoirs are concentrated in Jeollanam-do.
Using this location data, each reservoir is constructed as point data, and each point object has the
name and standard code of the reservoir. Since these standard codes are used in the same way in all
the databases, they are used to perform joint work between different data sources. To calculate the
area for each reservoir and perform geospatial analysis, information on the boundary of the reservoir
was used. Most of the reservoir boundaries and locations are very accurately constructed, except
some of the very small reservoirs, when compared with satellite images. To operate floating PV
properly, the reservoir needs to have sufficient water depth. Therefore, information on reservoir depth
is required for this study, and the PDP provides the level of the reservoir managed by the KRC on a
daily basis. This information is provided through OpenAPI, which is a publicly available application
programming interface that provides developers with programmatic access to web service. In this
study, we constructed a database of the daily reservoir depth over one year in 2017 for all reservoirs
through Python coding for OpenAPI. To evaluate the potential of floating PV installed in the reservoir,
it is necessary to use the solar irradiance for each site. In this study, we use the typical meteorological
year (TMY) data constructed by the Korea Institute of Energy Research (KIER, Daejeon, Korea) to
predict the amount of solar irradiance at each site. Global horizontal irradiance (GHI) and direct
normal irradiance (DNI) derived from TMY data are used in this study. TMY datasets in 16 cities
are created by KIER and distributed by the National Center for Standard Reference Data (NCSRD,
Daejeon, Korea). In addition, it is necessary to analyze the shadowing effect to evaluate the power
production of floating PV. For this purpose, information about the terrain is needed. In this study,
the digital elevation model (DEM) of 90-m resolution, downloaded from the National Geographic
Information Institute (NGII, Suwon, Korea), is used. The DEM and TMY observation points for South
Korea are shown in Figure 2.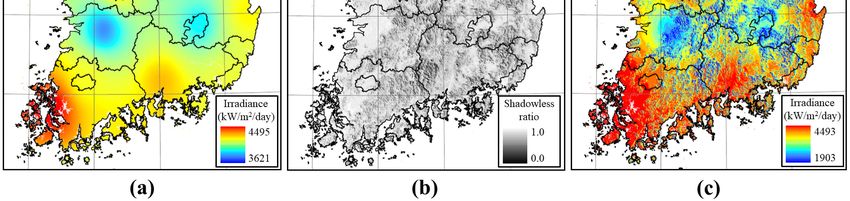
and distributed by the National Center for Standard Reference Data (NCSRD, Daejeon, Korea). In
addition, it is necessary to analyze the shadowing effect to evaluate the power production of
floating PV. For this purpose, information about the terrain is needed. In this study, the digital
elevation model (DEM) of 90-m resolution, downloaded from the National Geographic Information
Institute (NGII, Suwon, Korea), is used. The DEM and TMY observation points for South Korea
Appl. Sci. 2019, 9, 395
are
4 of 17
shown in Figure 2.
Figure1.1.Reservoirs
Figure ReservoirsininKorea:
Korea:(a)
(a)reservoir
reservoirlocations,
locations,provinces
provincesand
andsome
somemajor
majorcities;
cities;(b)
(b)reservoir
reservoir
Appl.density
Sci. 2018,across
density acrossthe
the
8, x FOR country.
country.
PEER REVIEW 4 of 15
Figure2.2.Digital
Figure DigitalElevation
ElevationModel
Model(DEM)
(DEM)and
andTypical
TypicalMeteorological
MeteorologicalYear
Year(TMY)
(TMY)data
dataobservation
observation
points in Korea.
points in Korea.
3.3.Methods
Methods
Figure
Figure3 3shows
showsthethe
study process
study processused to select
used suitable
to select reservoirs
suitable for installing
reservoirs floating
for installing PV from
floating PV
approximately 3400 reservoirs in South Korea and to evaluate the expected effect.
from approximately 3400 reservoirs in South Korea and to evaluate the expected effect. This study This study process
can be summarized
process as follows.as
can be summarized Infollows.
the first step,
In theTMY
firstdata
step,were
TMY used
data to were
predict the to
used daily average
predict the solar
daily
irradiance, considering the annual irradiance of South Korea. In this process,
average solar irradiance, considering the annual irradiance of South Korea. In this process, anan interpolation method
was applied. However,
interpolation method was this applied.
solar irradiance
However, mapthis
does notirradiance
solar take into account
map does thenot
effects
takeofinto
the terrain.
account
In theeffects
the second ofstep, we performed
the terrain. topographic
In the second step, weanalysis using the
performed DEM to account
topographic analysisfor the influence
using the DEMofto
the shadow
account forcaused by the terrain.
the influence An average
of the shadow causeddaily
by irradiance
the terrain.mapAn was created
average based
daily on topography,
irradiance map was
taking
created into account
based the shadowing
on topography, ratio into
taking and solar
accountirradiance map created
the shadowing ratioinand
the first
solarstep. In the third
irradiance map
created in the first step. In the third step, reservoirs that do not have sufficient water depth were
excluded from the analysis. In the fourth step, the possible power production of the floating PV
system of each reservoir was estimated by considering the meteorological data and system design
parameters. In the fifth step, the economic feasibility and reduction in GHG emissions by
administrative districts were evaluated based on the expected power production.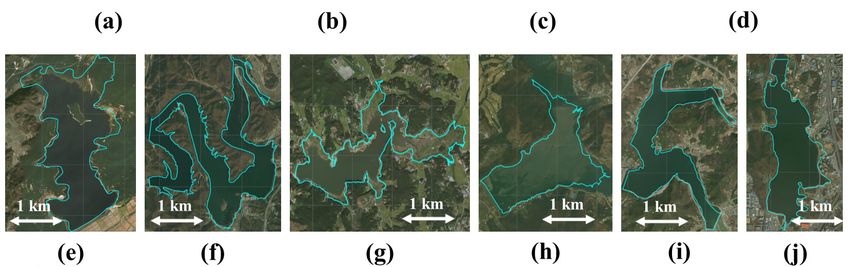
Figure 3 shows the study process used to select suitable reservoirs for installing floating PV
from approximately 3400 reservoirs in South Korea and to evaluate the expected effect. This study
process can be summarized as follows. In the first step, TMY data were used to predict the daily
average solar irradiance, considering the annual irradiance of South Korea. In this process, an
interpolation method was applied. However, this solar irradiance map does not take into account
Appl. Sci. 2019, 9, 395                                                                                         5 of 17
the effects of the terrain. In the second step, we performed topographic analysis using the DEM to
account for the influence of the shadow caused by the terrain. An average daily irradiance map was
created
step,       based on
       reservoirs     thattopography,
                            do not havetaking    intowater
                                         sufficient    account
                                                            depththe shadowing
                                                                    were excludedratio
                                                                                   fromand    solar irradiance
                                                                                         the analysis.           map
                                                                                                        In the fourth
created
step,  theinpossible
               the firstpower
                           step. In the third of
                                  production    step,
                                                   thereservoirs
                                                        floating PVthat do notofhave
                                                                     system      each sufficient
                                                                                       reservoir water   depth were
                                                                                                  was estimated     by
excluded      from    the   analysis. In the  fourth  step,  the  possible power    production
considering the meteorological data and system design parameters. In the fifth step, the economicof the  floating  PV
system of and
feasibility    eachreduction
                      reservoir in
                                 wasGHGestimated   by considering
                                           emissions                 the meteorological
                                                       by administrative    districts weredata   and system
                                                                                           evaluated   based design
                                                                                                               on the
parameters.
expected     powerIn production.
                        the fifth step, the economic feasibility and reduction in GHG emissions by
administrative districts were evaluated based on the expected power production.

       Figure 3. Overall
                     Overall study
                              study process
                                    process to
                                             to select
                                                select suitable
                                                       suitable reservoirs
                                                                reservoirs and
                                                                           and assess
                                                                               assess the potential of floating
       photovoltaic    systems  in Korea.
                                   Korea.
Appl. Sci. 2018, 8, x FOR PEER REVIEW                                                                         5 of 15

3.1. Point Irradiance Calculation and Interpolation
3.1. Point Irradiance Calculation and Interpolation
      The solar irradiance was calculated based on an equal-area-equal-angle sky division grid [17]
      The solar irradiance was calculated based on an equal-area-equal-angle sky division grid [17]
with the TMY dataset of 16 cities. Beam and diffuse irradiances for each position in the celestial sphere
with the TMY dataset of 16 cities. Beam and diffuse irradiances for each position in the celestial
were calculated by summing all the irradiance over the entire year for a time interval. This study refers
sphere were calculated by summing all the irradiance over the entire year for a time interval. This
to this irradiance intensity map of the sky as Sunmap. Figure 4a shows the average of Sunmap for a
study refers to◦this irradiance intensity map of the sky as Sunmap. Figure 4a shows the average of
tilt angle of 20 from all 16 cities, and Figure 4b shows the average of total irradiance as a function of
Sunmap for a tilt angle of 20° from all 16 cities, and Figure 4b shows the average of total irradiance
solar panel direction.
as a function of solar panel direction.

     Figure
     Figure 4.
             4. (a)
                 (a) Mean
                     Mean Sunmap
                            Sunmap ofof TMY
                                        TMY dataset
                                              dataset in
                                                       in Korea
                                                          Korea with
                                                                with aa tilt
                                                                        tilt angle
                                                                             angle 20°;
                                                                                   20◦ ; (b)
                                                                                          (b) Mean
                                                                                              Mean total
                                                                                                   total irradiance
                                                                                                          irradiance
     with respect   to solar panel direction.
     with respect to solar panel direction.

      The
      The top
           top is
                is north,
                   north, and
                          and the
                              the center
                                   center point
                                          point represents
                                                  represents the
                                                              the zenith.
                                                                  zenith. The
                                                                          The sky
                                                                                sky diffuse
                                                                                    diffuse model
                                                                                             model [18][18] is
                                                                                                             is used
                                                                                                                used
when
 when calculating the diffuse irradiance
                                 irradiance in
                                             in the
                                                 the sky.
                                                      sky.The
                                                           Thetotal
                                                               totalincident
                                                                     incidentirradiance
                                                                               irradianceofofthe
                                                                                               thetilted
                                                                                                    tiltedsurface
                                                                                                            surfaceis
is the summation of all positive normal intensities from the entire sky. Considering the irradiance of
each city in the TMY dataset, it was assessed that the optimal panel direction of Korea is southward,
and the optimal tilt angle is about 30° for most cities. However, many solar panels in the floating PV
system have been installed with a tilt angle close to horizontal. National Renewable Energy
Laboratory (NREL, Golden, Colorado, USA) research has shown that a tilt angle of 11° is the typical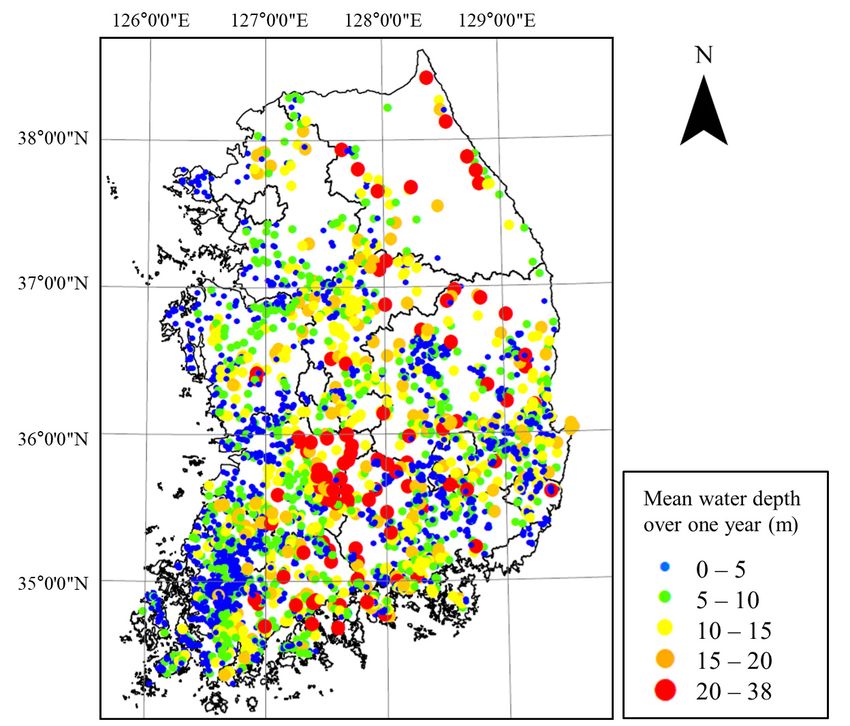
Appl. Sci. 2019, 9, 395                                                                                 6 of 17

the summation of all positive normal intensities from the entire sky. Considering the irradiance of each
city in the TMY dataset, it was assessed that the optimal panel direction of Korea is southward, and the
optimal tilt angle is about 30◦ for most cities. However, many solar panels in the floating PV system
have been installed with a tilt angle close to horizontal. National Renewable Energy Laboratory (NREL,
Golden, Colorado, USA) research has shown that a tilt angle of 11◦ is the typical mounting angle for
floating solar systems in Tokushima, Japan [19]. Other installed systems in Italy and Singapore also
have a tilt angle close to the horizontal [20]. This preference is derived for reasons such as maximizing
power density or structural stability. Therefore, this study sets a tilt angle of 20 ◦ , which has a difference
in irradiance of less than 1%, compared to a tilt of 30 ◦ .
      Point irradiance data was interpolated to generate an irradiance map to estimate the irradiance
in all areas in Korea. Interpolation is a technique to estimate values between known data. Kriging is
a widely used geostatistical interpolation method, which calculates weighting from the correlation
of known points. Although it is statistically powerful and is preferred in many cases, a sufficient
number of points is necessary to estimate the statistical relationship of each point. Therefore, kriging
is not applicable in this study, so the inverse distance weighting (IDW) method was applied. IDW
is a deterministic method, which is frequently used in many studies [21]. As shown in Equation (1),
the IDW method interpolates unknown values based on distances and values of known points.

                                                             Ii
                                                      ∑in=1 diP
                                               Ip =               ,                                        (1)
                                                      ∑in=1 d1P
                                                              i

where I p is the irradiance of an unknown point, n is number of points, i is an index of a point, Ii is
irradiance of the known ith point, di is the distance between the unknown point and the known ith
point, and P is power parameter. This method was used to generate a renewable energy resource atlas
in Korea [22]. In addition, Evrendilek et al. [23] showed that the accuracies of IDW and co-kriging are
similar for Turkey.

3.2. Solar Irradiance Map based on Shadow Analysis
      As the study area has mountainous terrain, calculating shadowing is an essential process. Whether
the sky is covered by terrain or not is determined using the DEM for each position in the Sunmap grid.
This sky coverage map is referred to as Viewmap and is used to calculate the shadowed irradiance or
sunshine duration. Details of the process are described in Oh et al. [17]. The annual sunshine duration
is calculated based on Sunmap and Viewmap.
      The annual sunshine duration is calculated considering the effect of shadows, but the difference
in irradiance at different times is not considered. For example, even though the sunshine duration in
the morning or evening is the same as the sunshine duration at noon, the irradiance in the morning
or evening is smaller. To solve this problem, this study used an hourly weight. Figure 5 shows the
hourly distribution of irradiance, which is the hourly irradiance divided by the total irradiance, for
each city in the TMY dataset. This shows that the hourly distribution for all cities is similar. Therefore,
this study assumes that the pattern of hourly distribution of irradiance is the same for every location.
Based on this assumption, the sunshine duration for each hour is calibrated as the shadowless ratio by
considering the weighting according to the hourly distribution of irradiance.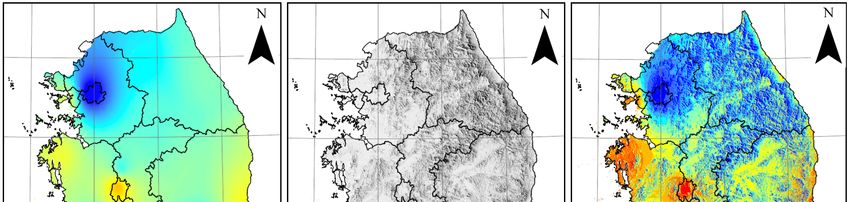
shows the hourly distribution of irradiance, which is the hourly irradiance divided by the total
irradiance, for each city in the TMY dataset. This shows that the hourly distribution for all cities is
similar. Therefore, this study assumes that the pattern of hourly distribution of irradiance is the
same for every location. Based on this assumption, the sunshine duration for each hour is calibrated
Appl. Sci. 2019, 9, 395                                                                          7 of 17
as the shadowless ratio by considering the weighting according to the hourly distribution             of
irradiance.

                    Figure 5. Graph of the ratio of hourly irradiance of each city in TMY dataset.

    Equation (2) shows the equation for the hourly weight calculation, and Equation (3) shows the
equation for irradiance considering shadows,

                                                        S      Ith
                                                 Wh = = h ×× ∑24
                                                                                                                            (2)
                                                                                                                            (2)
                                                      Smaxh  ∑i=1 Iti
                                                              !
                                                          24
                                                  Isp = = ∑ Wh I p                                                          (3)
                                                                                                                            (3)
                                                              h =1

where hℎisisthe
where            the  time
                   time     index
                         index  Wh is theis weight
                                             the weight
                                                    at eachat time     Ith isℎ,annual
                                                               eachh,time            is irradiance
                                                                                         annual irradiance
                                                                                                     of the TMY of dataset
                                                                                                                    the TMY   at
dataset
time  h, Sath time   ℎ,
              is sunshine   is sunshine
                             duration   at duration   at time
                                            time h, Smaxh        ℎ,
                                                            is maximum        issunshine
                                                                                  maximum      sunshine
                                                                                           duration        duration
                                                                                                       at time  h, andat Itime
                                                                                                                           sp is
ℎ, and
irradiance     is irradianceshadows
              considering      considering
                                         of theshadows
                                                 unknown  of point.
                                                             the unknown
                                                                     The ratiopoint.     The ratio
                                                                                   of sunshine        of sunshine
                                                                                                  duration   and the duration
                                                                                                                       hourly
and the hourly
distribution          distribution
                 of irradiance       of TMY
                                 of the  irradiance  of isthe
                                                dataset        TMY dataset
                                                           calculated             is calculated
                                                                         in Equation      (2). Meanin values
                                                                                                       Equationfor (2).  Mean
                                                                                                                    the entire
valuesdataset
TMY      for the  areentire  TMY
                       used in  the dataset     are used
                                     calculation.          in the atcalculation.
                                                    The weight         each time isThe  theweight      at eachoftime
                                                                                             multiplication        theseis two
                                                                                                                            the
multiplication
ratios.             of these of
        The summation         twoallratios.
                                     hourlyThe    summation
                                              weights   is usedof asall
                                                                     thehourly     weightsequal
                                                                          total weight,       is used
                                                                                                    to 1aswhen
                                                                                                           the total
                                                                                                                thereweight,
                                                                                                                        are no
equal to 1and
shadows       when    there
                   equal  to are no shadows
                             0 when              and equal
                                      that position   is fullytoshadowed.
                                                                 0 when that position is fully shadowed.
     The irradiance map assuming shadows (Figure 6c) is generated by the multiplication of the
interpolated irradiance map (Figure 6a) and total weight map (Figure 6b). This map can represent both
the influence of weather and terrain. The spatial resolution of the map is 90 m, which is equal to that
of the DEM.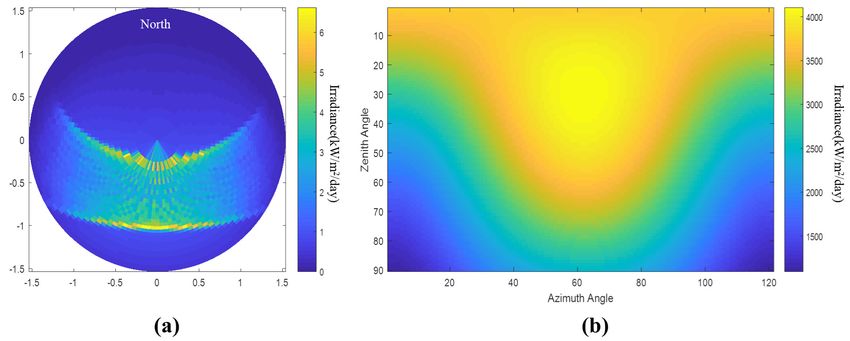
Appl. Sci. 2018, 8, x FOR PEER REVIEW 7 of 15
The irradiance map assuming shadows (Figure 6c) is generated by the multiplication of the
interpolated irradiance map (Figure 6a) and total weight map (Figure 6b). This map can represent
bothSci.
Appl. the influence
2019, 9, 395 of weather and terrain. The spatial resolution of the map is 90 m, which is equal to
8 of 17
that of the DEM.
Figure 6.6. Irradiance
Figure Irradiance prediction:
prediction: (a)(a)interpolated
interpolatedirradiance map;
irradiance (b)(b)
map; shadowless ratio
shadowless map;
ratio (c)
map;
irradiance
(c) map
irradiance considering
map shadow
considering shadow bybyterrain.
terrain.
3.3.
3.3.Constraint
ConstraintAnalysis
Analysison
onReservoir
ReservoirDepth
Depth
In
Ingeneral,
general,forforsmooth
smooth installation
installation andandoperation
operationof the
of floating
the floatingPV, aPV,reservoir with awith
a reservoir watera depth
water
greater than 5 m is recommended, maintaining a water depth of at least 1 m
depth greater than 5 m is recommended, maintaining a water depth of at least 1 m [24]. Therefore, [24]. Therefore, reservoirs
that do not meet
reservoirs these
that do notconditions
meet these were excludedwere
conditions in this study. Ininfact,
excluded thisa study.
floatingInPV of 465
fact, kW installed
a floating PV of
in thekW
465 Geumgwang
installed inreservoir in Korea had
the Geumgwang difficulty
reservoir in operation
in Korea because of
had difficulty in aoperation
summer drought
because that
of a
caused
summer drought that caused the bottom of the reservoir to be revealed [25]. The KRC provides for
the bottom of the reservoir to be revealed [25]. The KRC provides the daily water level the
each
dailyreservoir using
water level forOpenAPI. The data
each reservoir format
using is XML,The
OpenAPI. anddata
the API service
format type is
is XML, andREST
the type. When
API service
the
typestandard
is RESTcodetype.and search
When theperiod
standardare requested
code andassearchparameters,
periodthe areserver provides
requested the daily level
as parameters, the
for that period. Since only one standard code for a particular reservoir
server provides the daily level for that period. Since only one standard code for a particular can be input in one request,
Python-based
reservoir can be coding
inputwas performed
in one request, to obtain data coding
Python-based for more was than 3000 reservoirs.
performed to obtain ThedataRequests
for more
module
than 3000 reservoirs. The Requests module from Python was used for OpenAPI requests, and for
from Python was used for OpenAPI requests, and the BeautifulSoup module was used the
parsing XML data.
BeautifulSoup Sincewas
module the water
used level is provided
for parsing XMLasdata.an elevation,
Since thethe water
water depth
level was calculated
is provided as an
by subtracting
elevation, the dead
the water depthwater
waslevel of eachby
calculated reservoir fromthe
subtracting thedead
water level.
water Thisofstudy
level constructed
each reservoir a
from
reservoir depth database of 2017 and used it for analysis because for some reservoirs
the water level. This study constructed a reservoir depth database of 2017 and used it for analysis there is no data
before
because 2017.
for some reservoirs there is no data before 2017.
3.4.
3.4.Design
Designand
andEvaluation
Evaluationofofthe
thePV
PVSystem
System
In ◦
Inthis
thisstudy,
study,ititisisassumed
assumedthat
thatthe
thesolar
solarPV
PVpanels
panelsare
areinstalled
installedin
inaafixed-tilt
fixed-tiltarray
arraywith
withaa20
20°
slope
slopefacing
facingsouth. The
south. Theannual power
annual production
power of theofPV
production system
the was calculated
PV system using theusing
was calculated formula
the
of RETScreen
formula software developed
of RETScreen by Naturalby
software developed Resources
Natural Canada (NRC,
Resources Ottawa,
Canada Canada).
(NRC, Ottawa,RETScreen
Canada).
evaluates
RETScreen theevaluates
power ofthe thepower
PV system
of thevia
PVEquation (4),Equation (4),
system via
=t × S×× η×r η× η×inv
η × ×1 [1
−− βp ××
( T(c −−2525)]
) ×× 1(1−−λ p )××((1
1 −−λc ))
EA = H (4)
(4)
where is the amount of power (kWh/h) produced by a PV system, is solar irradiation per
where E A is the amount of power (kWh/h) produced by a PV system, Ht is solar irradiation per unit
unit area per unit time (kWh/m 2/h), is a surface area (m 2) of the solar array, η is conversion
area per unit time (kWh/m2 /h), S is a surface area (m2 ) of the solar array, ηr is conversion efficiency
efficiency (0–1) of the solar cell module, η is conversion efficiency of the inverter, is
(0–1) of the solar cell module, ηinv is conversion efficiency of the inverter, β p is temperature coefficient
temperature coefficient related to the efficiency of the solar cell module, (°C) is average
related to the efficiency of the solar cell module, Tc (◦ C) is average temperature of the solar cell module,
temperature of the solar cell module, is loss coefficient of the solar cell module, and is loss
λ p is loss coefficient of the solar cell module, and λc is loss coefficient of the inverter [26]. Table 1
shows the parameters for the solar panel and inverter used in this study. In this study, the number and
surface area of the panels that can be installed are calculated, considering the area of each reservoir,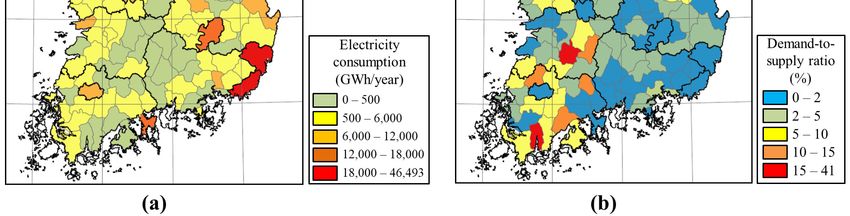
Appl. Sci. 2019, 9, 395                                                                                   9 of 17

the area of one panel, and array spacing. Then, this result is substituted into equation (4), and finally,
the power production is estimated.

                  Table 1. Design parameters for the photovoltaic systems considered in this study.

             Type                                  Parameter                                    Value
                                                   Model                                    SPR-210-BLK
                                                Length (m)                                      1.56
                                                 Width (m)                                      0.80
                                         Power capacity (kW/unit)                               0.21
     Solar cell module
                                               Efficiency (%)                                   16.9
                                    Nominal Operating cell temperature (◦ C)                     46
                                       Temperature coefficient (%/◦ C)                         −0.4
                                                 Losses (%)                                       1
                                                    Model                                    SPR-12000f
                                                Efficiency (%)                                  95.5
           Inverter
                                              Capacity (kW/unit)                                12.5
                                                  Losses (%)                                     0

      The parameters of solar panel and inverter in this study are the values of the products that
are commercially available and are produced on an industrial scale. If more efficient equipment is
installed in the reservoirs than Table 1, then the total power production and environmental benefit
will increase further. In that case, however, the overall cost will increase, and the economic burden
will also increase. Therefore, appropriate selection should be made according to technology level
and economic conditions at installation. According to Battaglia et al. [27], current silicon solar cells
technology achieved over 25% of efficiency, and several advanced concepts have been proposed to
overcome single-junction solar cells. In addition, silicon hetero-junction solar cell achieved over 26%
of efficiency [28]. Therefore, more efficient equipment is expected to be installed at a lower cost in
the future.

3.5. Economic Assessment and GHG Reduction
      In this study, an economic assessment is performed in terms of the cost of the PV system and the
profit from the power production. The cost of a PV system can be separated into the initial installation
costs and operating costs. According to the Korea Energy Economics Institute (KEEI, Ulsan, Korea) [29],
the installation cost is about 1.43 USD/W, and the annual operating cost is about 10.38 USD/kW.
The RPS system was used to estimate the revenue generated by electricity production and sales.
The RPS system calculates the electricity sales revenue by summing the system marginal price (SMP)
and renewable energy certificates (REC). Here, SMP refers to the revenue from the sale of electricity
through the Korea Power Exchange (KPX, Naju, Korea). REC is a tradable, non-tangible energy
commodity that represents 1 MWh of electricity generated from an eligible renewable energy resource.
Since the prices of SMP and REC are constantly changing, this study used the average value of the
amount traded in Korea since 2018. SMP and REC prices are 82.93 USD/MWh and 89.06 USD/MWh,
respectively. In addition, in Korea, the power generated by a floating PV is multiplied by a REC weight
of 1.5 308.
      The net present value (NPV) of the PV system was also calculated by Equation (5).

                                                      N
                                                            Et − Ct
                                            NPV =     ∑ (1 + r)t − C0                                        (5)
                                                     t =1

where N is the system operating period (20 y in this study), Et is annual electricity sales revenue (USD),
Ct the annual operating cost (USD), r is the discount rate, and C0 is initial cost (USD). A discount rate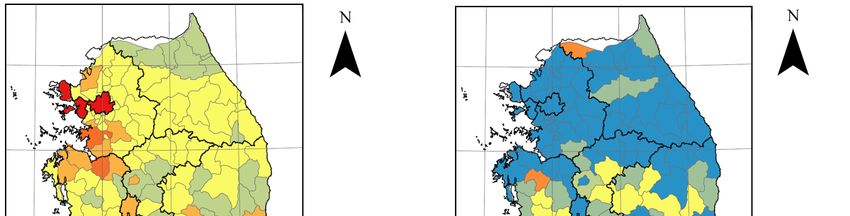
Appl. Sci. 2018, 8, x FOR PEER REVIEW                                                                          9 of 15
Appl. Sci. 2019, 9, 395                                                                                      10 of 17
 where     is the system operating period (20 y in this study),   is annual electricity sales revenue
 (USD),     the annual operating cost (USD), is the discount rate, and        is initial cost (USD). A
of 5.5% was applied in this study, according to KEEI [30]. The payback year can be determined by
 discount rate of 5.5% was applied in this study, according to KEEI [30]. The payback year can be
calculating N, satisfying the condition that NPV becomes zero in Equation (5).
 determined by calculating , satisfying the condition that NPV becomes zero in Equation (5).
     GHG reduction was also calculated in this study by multiplying the GHG emission reference
      GHG reduction was also calculated in this study by multiplying the GHG emission reference
value (0.4415 tCO2 /MWh) and total amount of power (MWh/year). GHG reduction refers to the
 value (0.4415 tCO2/MWh) and total amount of power (MWh/year). GHG reduction refers to the
amount of GHG generated when the same amount of power produced through renewable energy is
 amount of GHG generated when the same amount of power produced through renewable energy is
generated through the fossil energy system.
 generated through the fossil energy system.
4. Results
 4. Results
      Figure 7 shows the variation in the mean water depth over one year by distinguishing reservoirs
      Figure
for each        7 shows
           province.        the variationthe
                       In Gangwon-do,       innumber
                                                 the mean    water depth
                                                        of reservoirs       overbut
                                                                      is small,    one
                                                                                     theyear    by distinguishing
                                                                                          reservoirs have a deep
 reservoirs   for  each  province.  In Gangwon-do,     the   number  of reservoirs   is
water depth. On the other hand, Jeollanam-do has the highest number of water reservoirs small,  but the reservoirs
                                                                                                            but the
 have   a  deep    water   depth.  On   the  other  hand,   Jeollanam-do   has  the   highest
lowest average water depth. Commonly, the water depth falls rapidly from May to July and tends  number     of  water
to recover after July. Figure 8 shows the map of the average water depth for each reservoir overMay
 reservoirs   but  the  lowest  average  water   depth. Commonly,     the water   depth   falls rapidly  from    the
 to Julyof
course    and  tendsThere
            a year.    to recover  after July. Figure
                             are a considerable       8 shows
                                                   number        the map that
                                                            of reservoirs of the
                                                                               areaverage   waterfor
                                                                                    not suitable   depth    for each
                                                                                                       floating  PV
 reservoir   over   the  course  of  a year.  There  are  a  considerable  number     of  reservoirs  that
installations, in which the average water depth is less than 5 m. There are many reservoirs in Jeolla-do     are  not
 suitable  for  floating  PV  installations,  in which  the  average
and Gyeongsang-do, but many reservoirs are low in water depth.        water  depth   is less than  5 m.   There   are
 many reservoirs in Jeolla-do and Gyeongsang-do, but many reservoirs are low in water depth.

           Figure 7. The
           Figure 7. The variation
                         variation of
                                   of mean
                                      mean water
                                           water depth
                                                 depthover
                                                       overone
                                                           oneyear
                                                               yearfor
                                                                    forreservoirs
                                                                        reservoirsof
                                                                                   ofeach
                                                                                      eachprovince.
                                                                                           province.

     The floating PV capacity and power production of each reservoir was calculated considering
the solar irradiance, characteristics of the panel, and installation area of the panel. In this study, an
additional 11% efficiency was considered for the use of the floating PV. The results for all reservoirs
are shown in Table 2, based on the ratio of the installation area for the reservoirs satisfying the water
depth requirements assumed above. Only reservoirs with a floating PV capacity of 100 kW or greater
were considered. Generally, it is common to install floating PV panels in 10% of the reservoir area.
In this case, 1134 reservoirs satisfy the condition, and the total installed capacity of the panels is about
2103 MW, with an annual power production of 2932 GWh. In recent years, a floating PV has been
installed for a high percentage of the reservoir area in several cases [31]. If a floating PV is installed
over the entire area of the reservoir under extreme assumptions, the total installed capacity of the
panel is estimated to be 21,093 MW, and the annual power production is estimated to be 29,409 GWh.
Appl. Sci. 2019, 9, 395 11 of 17
Appl. Sci. 2018, 8, x FOR PEER REVIEW 10 of 15
Figure
Figure 8. The
8. The mapmap
ofofthe
theaverage
average water
water depth
depthfor
foreach
eachreservoir over
reservoir a year.
over a year.
Figure The9afloating
is a mapPVshowing
capacity and power production
the annual electricity of eachfor
usage reservoir was calculatedunits
the administrative considering
of Korea in
the solar irradiance, characteristics of the panel, and installation area
2017. Metropolitan cities or industrial cities such as Seoul, Ulsan, Incheon, and Busan show of the panel. In this study, an
relatively
additional 11% efficiency was considered for the use of the floating PV.
high electricity usage, and their annual electricity consumption is about 46,493 GWh, 32,095 GWh, The results for all reservoirs
are shown in Table 2, based on the ratio of the installation area for the reservoirs satisfying the water
23,876 GWh, and 20,467 GWh, respectively. Figure 9b shows what percentage of electricity usage
depth requirements assumed above. Only reservoirs with a floating PV capacity of 100 kW or greater
can be satisfied when a floating PV is installed in each administrative unit. It is assumed that solar
were considered. Generally, it is common to install floating PV panels in 10% of the reservoir area.
Appl. Sci. 2018, 8, x FOR PEER REVIEW
In
11 of 15
panels are installed in 10% of the reservoir area. It is estimated that Jeolla-do, which
this case, 1134 reservoirs satisfy the condition, and the total installed capacity of the panels is about has a relatively
low power
2103 MW,
assumed
consumption
with
that solar
and are
an annual is favorable
panels power
for floating
production
installed in 10% ofof2932 PV
theGWh.
installation,
In recent
reservoir
can asupply
years,
area. It
a PV
floatingthat
is estimated
large
hasportion
been of
Jeolla-do,
the electric
installed
which power
has demand
fora arelatively in
high percentage comparison
low power with
of theconsumption
reservoir areaother
in is
and provinces.
several For
casesfor
favorable [31]. example,
If a floating
floating it is estimated
can that
PV is installed
PV installation,
aboutsupply
41%the
over ofaentire
the power
large area demand
of
portion the theofelectric
Imsil
of reservoir in
under Jeollabuk-do
powerextreme
demand and
assumptions,16% the
of the
in comparison totalpower demand
installed
with other capacity of Gangjin
provinces. the in
of For
panel is estimated
Jeollanam-do
example, can
it is be to bethat
covered
estimated 21,093
byaboutMW,
floating
41% and
of the
PV the annual
power power production
generation.
power demand of Imsil in is estimated to
Jeollabuk-do be 16%
and 29,409of
GWh.
the power demand of Gangjin in Jeollanam-do can be covered by floating PV power generation.
Table 2. The results of floating photovoltaic system installations according to the ratio of the
installation area for all reservoirs satisfying the water depth requirements.
Installation area
to reservoir area 10 20 30 40 50 60 70 80 90 100
ratio (%)
Number of
reservoirs 1134 1201 1218 1225 1230 1234 1236 1236 1236 1236
satisfying 100 kW
Maximum
75.85 151.70 227.55 303.40 379.25 455.10 530.95 606.80 682.65 758.50
capacity (MW)
Total capacity
2102.89 4216.33 6326.63 8436.33 10545.97 12655.63 14765.12 16874.42 18983.73 21093.03
(MW)
Total power
production 2931.94 5878.65 8820.95 11762.40 14703.79 17645.20 20586.38 23527.30 26468.21 29409.12
(GWh/year)
Figure 9a is a map showing the annual electricity usage for the administrative units of Korea in
2017. Metropolitan cities or industrial cities such as Seoul, Ulsan, Incheon, and Busan show
relatively high electricity usage, and their annual electricity consumption is about 46,493 GWh,
32,095 GWh, 23,876 GWh, and 20,467 GWh, respectively. Figure 9b shows what percentage of
electricity usage can be satisfied when a floating PV is installed in each administrative unit. It is
Figure
Figure 9. Map
9. (a) (a) Map of the
of the annualelectricity
annual electricity usage
usage for
for the
theadministrative
administrativeunits andand
units (b) map of theof the
(b) map
demand-to-supply
demand-to-supply ratio
ratio forfor electricityusage.
electricity usage.
Table 3 shows the overall results of reservoir condition, installed floating PV capacity, annual
power production, and GHG reduction of each province. It can be seen that Jeollanamdo,
Gyeongsangbuk-do, and Chungcheongnam-do, which have high solar irradiance and a large
number of reservoirs, have high power production and high GHG reduction. If a floating PV is
installed in 10% of the area for all reservoirs, the expected annual power production is 2932 GWh,
and the annual GHG reduction amount is approximately 1,294,450 ton.Appl. Sci. 2019, 9, 395 12 of 17
Table 3 shows the overall results of reservoir condition, installed floating PV capacity, annual
power production, and GHG reduction of each province. It can be seen that Jeollanamdo,
Gyeongsangbuk-do, and Chungcheongnam-do, which have high solar irradiance and a large number
of reservoirs, have high power production and high GHG reduction. If a floating PV is installed in 10%
of the area for all reservoirs, the expected annual power production is 2932 GWh, and the annual GHG
Appl. Sci. 2018,
reduction 8, x FORisPEER
amount REVIEW
approximately 1,294,450 ton. 12 of 15
Assuming that a floating PV is installed in 10% of the reservoir area, the analysis results of the
top 10Assuming
reservoirsthat a floating
(Figure PV the
10) with is installed
highest in 10% production
power of the reservoir area, the
are shown analysis
in Table results
4. In of the
this case, a
larger reservoir area corresponds to more power generation. Therefore, the top 10 reservoirs with higha
top 10 reservoirs (Figure 10) with the highest power production are shown in Table 4. In this case,
larger reservoir
economic efficiencyarea corresponds
were also analyzedto more power
for an generation.
installed Therefore,
100-kW floating the top
PV (476 10ofreservoirs
units with
PV panel with
high economic
0.21-kW capacity).efficiency were also
For a floating PV analyzed
installed inforproportion
an installedto 100-kW
the area floating PV (476 the
of the reservoir, units of PV
analysis
panel with 0.21-kW capacity). For a floating PV installed in proportion to
shows that maximum power production corresponds to a PV installed in Yedang reservoir, located the area of the reservoir,
theChungcheongnam-do.
in analysis shows that In maximum
this case,power production
reservoirs corresponds
suitable for floating PV toinstallations
a PV installed in Yedang
are distributed
reservoir, located in Chungcheongnam-do. In this case, reservoirs suitable
nationwide. On the other hand, in terms of economic efficiency, reservoirs of Jeollanam-do with high for floating PV
installations are distributed nationwide.
solar irradiance were found to be advantageous. On the other hand, in terms of economic efficiency,
reservoirs of Jeollanam-do with high solar irradiance were found to be advantageous.
10.Boundary
Figure 10. Boundarydata data
andand satellite
satellite images
images of top of top 10 reservoirs
10 reservoirs with the
with the highest highest
power power
production:
production:
(a) (a)Seomjin;
Yedang; (b) Yedang;(c)(b) Seomjin;
Najuho; (c) Najuho;
(d) Topjeong; (d) Topjeong;
(e) Togyo; (f) Miho;(e)
(g)Togyo;
Gosam;(f) Miho; (g)
(h)Bulgop; (i) Gosam;
Yidong;
(h)Bulgop;
(j) (i) Yidong; (j) Deokdong.
Deokdong.
Table 4. The analysis results of the top 10 reservoirs with the highest power production and with
the highest efficiency.
Power
Reservo product GHG NPV Pay
Reservoir Capacit
Rank Province City ir area ion reducti (10,000 back
name y (MW)
(km2) (GWh/y on (ton) USD) (year)
ear)
1 Yedang Chungcheongnam-do Yesan 8.83 75.85 107.58 47494.86 17513.99 4.42
2 Seomjin Jeollabuk-do Imsil 10.11 75.25 102.39 45205.39 16191.54 4.70
Floating PV
installed in
proportion to 3 Najuho Jeollanam-do Naju 7.19 54.94 80.51 35544.71 13392.70 4.21
the area of
the reservoir 4 Topjeong Chungcheongnam-do Nonsan 5.82 47.20 67.77 29921.57 11125.65 4.34
(High powerAppl. Sci. 2019, 9, 395 13 of 17
Table 2. The results of floating photovoltaic system installations according to the ratio of the installation area for all reservoirs satisfying the water depth requirements.
Installation area to reservoir area ratio (%) 10 20 30 40 50 60 70 80 90 100
Number of reservoirs satisfying 100 kW 1134 1201 1218 1225 1230 1234 1236 1236 1236 1236
Maximum capacity (MW) 75.85 151.70 227.55 303.40 379.25 455.10 530.95 606.80 682.65 758.50
Total capacity (MW) 2102.89 4216.33 6326.63 8436.33 10,545.97 12,655.63 14,765.12 16,874.42 18,983.73 21,093.03
Total power production (GWh/year) 2931.94 5878.65 8820.95 11,762.40 14,703.79 17,645.20 20,586.38 23,527.30 26,468.21 29,409.12
Table 3. The results of reservoir condition, installed floating photovoltaic (PV) capacity, annual power production, and greenhouse gas (GHG) reduction of
each province.
Mean Maximum Mean Maximum Total GHG
Mean Mean Mean PV Total PV Total Power
Number of Irradiance PV Power Power Reduction
Water Reservoir Capacity Capacity Production
Reservoirs (kW/m2 Capacity Production Production (1000
Depth (m) Area (km2 ) (MW) (MW) (GWh/year)
/day) (MW) (GWh/year) (GWh/year) tCO2 /year)
Gangwon-do 48 12.09 0.50 3714.40 2.43 30.28 116.81 3.28 41.21 157.36 69.47
Gyeonggi-do 50 9.78 0.64 3704.45 3.61 24.60 180.60 4.88 34.20 244.19 107.81
Gyeongsangnam-do 167 12.23 0.22 3864.00 0.81 6.22 135.27 1.11 8.73 184.85 81.61
Gyeongsangbuk-do 227 11.26 0.38 3814.96 1.75 20.48 397.25 2.45 29.07 556.32 245.62
Jeollanam-do 285 9.96 0.32 3987.81 1.50 54.94 427.50 2.17 80.51 617.29 272.53
Jeollabuk-do 149 12.37 0.38 3798.40 1.95 75.25 290.11 2.67 102.39 397.32 175.42
Chungcheongnam-do 98 9.78 0.61 3877.83 3.65 75.85 357.75 5.16 107.58 505.29 223.09
Chungcheongbuk-do 110 12.43 0.40 3781.62 1.79 26.56 197.18 2.45 36.71 269.32 118.90
Sum 1134 2068.53 2931.94 1294.45Appl. Sci. 2019, 9, 395 14 of 17
Table 4. The analysis results of the top 10 reservoirs with the highest power production and with the highest efficiency.
Power GHG NPV Pay
Reservoir Capacity
Rank Reservoir Name Province City Production Reduction (10,000 Back
Area (km2 ) (MW)
(GWh/year) (ton) USD) (year)
1 Yedang Chungcheongnam-do Yesan 8.83 75.85 107.58 47,494.86 17,513.99 4.42
2 Seomjin Jeollabuk-do Imsil 10.11 75.25 102.39 45,205.39 16,191.54 4.70
Floating PV
3 Najuho Jeollanam-do Naju 7.19 54.94 80.51 35,544.71 13,392.70 4.21
installed in
4 Topjeong Chungcheongnam-do Nonsan 5.82 47.20 67.77 29,921.57 11,125.65 4.34
proportion to the
5 Togyo Gangwon-do Cheorwon 3.92 30.28 41.21 18,195.17 6518.30 4.69
area of the
6 Miho Chungcheongbuk-do Jincheon 4.42 26.56 36.71 16,206.52 5869.99 4.59
reservoir
7 Gosam Gyeonggi-do Anseong 3.56 24.60 34.20 15,101.31 5493.85 4.55
(High power
8 Bulgop Jeollanam-do Yeonggwang 3.20 21.44 31.70 13,996.68 5304.63 4.15
production)
9 Yidong Gyeonggi-do Yongin 2.87 22.00 30.31 13,382.42 4836.23 4.61
10 Deokdong Gyeongsangbuk-do Gyeongju 3.11 20.48 29.08 12,836.71 4736.96 4.41
1 Naesan Jeollanam-do Haenam 0.11 0.10 0.16 69.08 27.08 3.82
2 Jangsan Jeollanam-do Shinan 0.14 0.10 0.16 69.04 27.06 3.82
3 Gopyeong Jeollanam-do Haenam 0.08 0.10 0.16 68.86 26.95 3.84
4 Cheongsu Jeollanam-do Muan 0.15 0.10 0.16 68.54 26.75 3.86
Floating PV with
5 Illo Jeollanam-do Muan 0.75 0.10 0.15 68.39 26.66 3.88
100 kW capacity
6 Gwangdae Jeollanam-do Shinan 0.41 0.10 0.15 68.21 26.55 3.89
(High efficiency)
7 Sindeok Jeollanam-do Yeongam 0.13 0.10 0.15 68.20 26.54 3.89
8 Dopyeong Jeollanam-do Jindo 0.11 0.10 0.15 68.09 26.48 3.90
9 Sungdong Jeollanam-do Muan 0.17 0.10 0.15 68.02 26.43 3.91
10 Sungyang Jeollanam-do Yeongam 0.40 0.10 0.15 67.77 26.28 3.93Appl. Sci. 2019, 9, 395 15 of 17
5. Conclusions
In this study, we analyzed the water level data of 3401 reservoirs in Korea using OpenAPI
and extracted reservoirs suitable for floating PV installation. In this analysis, the conditions of an
average reservoir water depth greater than 5 m and minimum water depth greater than 1 m were
considered. GIS spatial analysis was applied to the TMY dataset to predict the national distribution
of solar irradiance for shadow conditions. Assuming an expected power production of 10% of the
area of all reservoirs satisfying the conditions, the annual power production was estimated to be
2932 GWh, and the annual GHG reduction amount was estimated to be 1,294,450 ton. In particular,
Jeollanam-do has many reservoirs, including many suitable for floating PV installation because of
high solar irradiance. The results of this study can be used to estimate priorities and potentiality
prior to actual floating PV installation and detailed analysis. This study did not take degradation into
consideration because it is aimed at estimating priorities through relative comparisons. However, as
floating PV is installed in the water, it is necessary to study the efficiency change and degradation
related to the moisture in actual installation.
The results of this study are very useful for preliminary evaluation at the national level, but
improvement is needed in the following points. First, there may be a limit to the prediction accuracy in
that only 16 data points are used to predict the solar irradiance. If the irradiance is measured at many
more points, accurate irradiance prediction can be made. However, because of budget limitations, it is
necessary to continuously increase the number of solar irradiance observation points at the government
level. It is also possible to improve the accuracy of solar irradiance prediction through complex analysis
with satellite image data. Next, the water level data used in this study is not well managed by the
government, and some data are missing or include errors. In this study, we manually identified and
corrected these errors. To reflect water level data in real time during the operation of the floating PV
in the future, more thorough management of water level data is needed. In addition, this study was
carried out to evaluate reservoirs suitable for floating PV installation and to evaluate their overall
potential. However, to actually install floating PV in individual reservoirs, a more accurate analysis
of the area’s solar irradiance, wind speed, accessibility, detailed topography, and other conditions
needs to be implemented. Finally, since SMP and REC prices are constantly changing, it is necessary to
periodically consider the economic feasibility. The results of this study have important implications in
Korea for large-scale floating PV installation in the future. For the successful application of floating PV,
a rigorous feasibility assessment and planning for the redistribution of profit is most important, to
minimize environmental damage and repudiation from the local residents.
Author Contributions: H.-D.P. conceived and designed the analysis. S.-M.K. and M.O. performed the analysis.
S.-M.K. and M.O. developed the code and analyzed the data. H.-D.P. contributed reagents/materials/analysis
tools. S.-M.K. wrote the paper.
Funding: This research was funded by the National Research Foundation of Korea (NRF) (No. NRF-2017R1A2B4007623).
Acknowledgments: This research was supported by the Brain Korea 21 Project.
Conflicts of Interest: The authors declare no conflict of interest.
References
1. The International Renewable Energy Agency (IRENA). Renewable Capacity Statistics 2018; IRENA: Abu Dhabi,
United Arab Emirates, 2018.
2. Choi, Y.K. A Study on Power Generation Analysis of Floating PV System Considering Environmental Impact.
Int. J. Softw. Eng. Appl. 2014, 8, 75–84. [CrossRef]
3. Sahu, A.; Yadav, N.; Sudhakar, K. Floating photovoltaic power plant: A review. Renew. Sust. Energ. Rev. 2016,
66, 815–824. [CrossRef]Appl. Sci. 2019, 9, 395 16 of 17
4. Galdino, M.; de Almeida Olivieri, M.M. Some Remarks about the Deployment of Floating PV Systems in
Brazil. J. Elec. Eng. 2017, 5, 10–19. [CrossRef]
5. The World Bank. Where Sun Meets Water: Floating Solar Market Report; The World Bank: Washington, DC,
USA, 2018.
6. Minamino, S. Floating Solar Plnats: Niche Rising to the Surface? Available online: https://www.solarplaza.
com/channels/top-10s/11634/floating-solar-plants-niche-rising-surface/ (accessed on 28 December 2018).
7. Osborne, M. China Completes Largest Floating Solar Power Plant. Available online: https://www.pv-tech.
org/news/china-completes-largest-floating-solar-power-plant (accessed on 28 December 2018).
8. Lee, Y.G.; Joo, H.J.; Yoon, S.J. Design and installation of floating type photovoltaic energy generation system
using FRP members. Sol. Energy 2014, 108, 13–27. [CrossRef]
9. Kim, S.H.; Yoon, S.J.; Choi, W. Design and Construction of 1 MW Class Floating PV Generation Structural
System Using FRP Members. Energies 2017, 10, 1142. [CrossRef]
10. Choi, Y.K.; Kim, I.S.; Hong, S.T.; Lee, H.H. A Study on Development of Azimuth Angle Tracking Algorithm
for Tracking-type Floating Photovoltaic System. Adv. Sci. Technol. Lett. 2014, 51, 197–202. [CrossRef]
11. Choi, Y.K.; Lee, N.H.; Lee, A.K.; Kim, K.J. A Study on Major Design Elements of Tracking-Type Floating
Photovoltaic Systems. Int. J. Smart Grid Clean Energy 2014, 3, 70–74. [CrossRef]
12. Lee, A.K.; Shin, G.W.; Hong, S.T.; Choi, Y.K. A Study on Development of ICT Convergence Technology for
Tracking-Type Floating Photovoltaic Systems. Int. J. Smart Grid Clean Energy 2014, 3, 80–87. [CrossRef]
13. Song, J.; Choi, Y.; Yoon, S.H. Analysis of Photovoltaic Potential at Abandoned Mine Promotion Districts in
Korea. Geosyst. Eng. 2015, 18, 168–172. [CrossRef]
14. Song, J.; Choi, Y. Analysis of the Potential for Use of Floating Photovoltaic Systems on Mine Pit Lakes: Case
Study at the Ssangyong Open-Pit Limestone Mine in Korea. Energies 2016, 9, 102. [CrossRef]
15. Lee, K.R.; Lee, W.H. Floating Photovoltaic Plant Location Analysis using GIS. J. Korean Soc. Geospat. Inf. Syst.
2016, 24, 51–59. [CrossRef]
16. Lee, S.H.; Lee, N.H.; Choi, H.C.; Kim, J.O. Study on Analysis of Suitable Site for Development of Floating
Photovoltaic System. J. Korean Inst. Illum. Electr. Install. Eng. 2012, 26, 30–38.
17. Oh, M.; Park, H.D. A new algorithm using a pyramid dataset for calculating shadowing in solar potential
mapping. Renew. Energy 2018, 126, 465–474. [CrossRef]
18. Perez, R.; Seals, R.; Michalsky, J. All-Weather Model for Sky Luminance Distribution—Preliminary
Configuration and Validation. Sol. Energy 1993, 50, 235–245. [CrossRef]
19. NREL. STAT FAQs Part 1: Floating Solar. Available online: https://www.nrel.gov/state-local-tribal/blog/
posts/stat-faqs-part1-floating-solar.html (accessed on 28 December 2018).
20. Patil, S.S.; Wagh, M.M.; Shinde, N.N. A Review on Floating Solar Photovoltaic Power Plants. Int. J. Sci. Eng.
Res. 2017, 8, 789–794.
21. Palmer, D.; Cole, I.; Betts, T.; Gottschalg, R. Interpolating and Estimating Horizontal Diffuse Solar Irradiation
to Provide UK-Wide Coverage: Selection of the Best Performing Models. Energies 2017, 10, 181. [CrossRef]
22. Kang, Y.H. KOREA Renewable Energy Resource Atlas; Korea Institute of Energy Research: Daejeon, Korea, 2015.
23. Evrendilek, F.; Ertekin, C. Assessing solar radiation models using multiple variables over Turkey.
Clim. Dynam. 2008, 31, 131–149. [CrossRef]
24. LSIS. Floating Photovoltaic System; LS Industrial Systems: Anyang, Korea, 2016.
25. Kim, G.H. Water Solar Power Plant That Sits Down on the Ground Due to Drought. Available online:
https://www.yna.co.kr/view/AKR20170626109700061 (accessed on 28 December 2018).
26. RETScreen International Clean Energy Decision Support Centre. Clean Energy Project Analysis, RETScreen
Engineering & Cases Textbook; CANMET Energy Technology Centre: Montreal, QC, Canada, 2005.
27. Battaglia, C.; Cuevas, A.; De Wolf, S. High-efficiency crystalline silicon solar cells: Status and perspectives.
Energy Environ. Sci. 2016, 9, 1552–1576. [CrossRef]
28. Yoshikawa, K.; Kawasaki, H.; Yoshida, W.; Irie, T.; Konishi, K.; Nakano, K.; Uto, T.; Adachi, D.; Kanematsu, M.;
Uzu, H.; et al. Silicon heterojunction solar cell with interdigitated back contacts for a photoconversion
efficiency over 26%. Nat. Energy 2017, 2, 17032. [CrossRef]You can also read