Greening the Network: Indonesia Market Analysis - (Sizing Potential for Green Power in Indonesia) April 2013 - GSMA
←
→
Page content transcription
If your browser does not render page correctly, please read the page content below
In partnership with the Netherlands

Greening the Network: Indonesia Market Analysis
(Sizing Potential for Green Power in Indonesia)
April 2013
GSMA Green Power for Mobile
Greening the Network: Indonesia Market Analysis                                                              2

Contents
                                                  Objective
                                                            3 2. Powering Telecom: Current Approach		                                                            11
                                                  Approach
                                                           3 2.1 Current State of Deployment		                                                                   11
                                                  Glossary			                                           4        2.2 Costs of Powering Telecom Sector		          12

                                                  Executive Summary		                                   5    3. Powering Telecom: Green Telecom and Market Sizing 13

                                                  1. Indonesia		                                        6        3.1 Green Technology Options		                  13
                                                                                                                 3.2 Market Sizing		                             14
                                                   1.1 Geographical		                                   6
                                                                                                                 3.3 Potential OPEX Saving		                     15
                                                   1.2 Economic		                                       6
                                                   1.3 Power and Energy		                               6    4. Powering Telecom: The Way Forward		              15
                                                  		   1.3.1 Electricity Infrastructure		               7        4.1 Short Term		                                15
                                                  		   1.3.2 Energy Regulation in Indonesia		           8        4.2 Long Term		                                 15
                                                   1.4 Telecommunication		                              8        4.3 Site Sharing/Leasing		                      16
                                                  		   1.4.1 Subscriber and Penetration		               8        4.4 Future Business Model		                     16
                                                  		   1.4.2 Managed Services		                         9    5. Conclusion		                                     17
                                                  		   1.4.3 Tower Company		                            9

                                                   1.5 Eco-system and Fiscal Incentive		                10
                                                  		   1.5.1 Industry Structure		                       10
                                                  		   1.5.2 Incentives to Promote Green Technology		   10
GSMA Green Power for Mobile
Greening the Network: Indonesia Market Analysis                                                                                   3

Objective                                         3

Approach                                          3

Glossary		                                        4

Executive Summary                                 5

1. Indonesia                                      6

2. Powering Telecom: Current Approach             11

3. Powering Telecom: Green Telecom
   and Market Sizing                              13

4. Powering Telecom: The Way Forward              15

5. Conclusion                                     17

                                                       Objective                                                                  Approach
                                                       This Indonesia specific market analysis report aims at identifying and     The approach for this report was to gather first hand data through
                                                       examining green power deployment possibilities and their potential for     stakeholder interactions and questionnaires. At the same time, the
                                                       the Telecom industry in the country.                                       report utilises some generic data from the market through various
                                                                                                                                  secondary resources.
                                                       The report analyses the current state of energy and infrastructure
                                                       regulations in Indonesia and looks into current deployment methods in
                                                       telecommunications and infrastructure management. The report walks the
                                                       reader through the number of towers installed and their power connection
                                                       status. It also evaluates market sizing and future trends in greening
                                                       Telecom networks and will showcase the potential opportunities for ESCO
                                                       providers with regards to energy outsourcing model.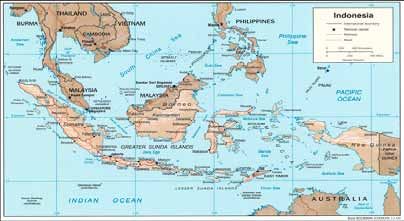
GSMA Green Power for Mobile
Greening the Network: Indonesia Market Analysis                                                                                            4

Objective                                         3    Definition                                                                          Figures and Tables

Approach                                          3
                                                       GSMA             GSM Association                                                    Figure 1      Map of Indonesia
Glossary		                                        4
                                                       GPM              Green Power for Mobile                                             Figure 2      Electrification Ratio
Executive Summary                                 5    MNO              Mobile Network Operator                                            Figure 3      Electrification Ratio by Provinces
1. Indonesia                                      6    DG               Diesel Generator                                                   Figure 4      Power Consumption per Sector Basis, 2011
                                                       GDP              Gross Domestic Bruto                                               Figure 5      2011 Total Energy Mix
2. Powering Telecom: Current Approach             11
                                                       PLN              Perusahaan Listrik Negara/State Electricity Company                Figure 6      Subscriber Growth
3. Powering Telecom: Green Telecom                     MEMR             Ministry of Energy and Mineral Resources                           Figure 7      Market Penetration
   and Market Sizing                              13   GHG              Green House Gas                                                    Figure 8      Financial Instruments Support
4. Powering Telecom: The Way Forward              15   TOE              Ton of Oil Equivalent                                              Figure 9      Exemption Facilities
                                                       RE               Renewable Energy                                                   Figure 10     Problematic Sites Distribution
5. Conclusion                                     17
                                                       kWh              kilo Watt hour                                                     Figure 11     Current Power Solution Deployment for Problematic Sites
                                                       MWh              Mega Watt Hour                                                     Figure 12     Powering Cost Structure
                                                       GB               Giga Byte                                                          Figure 13     Solar Radiation in Indonesia
                                                       SLA              Service Level Agreement                                            Figure 14     Wind Speed in Indonesia
                                                       KPI              Key Performance Indicator                                          Figure 15     Current Deployment
                                                       OPEX             Operating Expenditure                                              Figure 16     Site Growth
                                                       CAPEX            Capital Expenditure                                                Figure 17     Off-Grid and Unreliable Grid Sites Growth
                                                       SPMS             Spare Part Management System                                       Figure 18     Business Model Trends
                                                       MCIT             Ministry of Communication and Information Technology
                                                       FCU              Fan Cooling Unit                                                   Table 1       GDP at the current price
                                                       BTS              Base Transmitter Station                                           Table 2       Electricity Generation vs Demand
                                                       ESCO             Energy Service Company                                             Table 3       Own Effort Commitment
                                                       PPA              Power Purchase Agreement                                           Table 4       Tower Ownership
                                                       ESA              Energy Saving Agreement                                            Table 5       Non Fossil Fuel Energy Resources
                                                                                                                                           Table 6       Green Power Choices in Indonesia
                                                       Off-grid site:     Telecom Base Station Site which is NOT connected to the
                                                                          commercial Grid power supply
                                                       On-grid site:      Telecom Base Station Site which is connected to the commercial
                                                                          Grid power supply
                                                       Tower Company:     A company that manages a part or the entire assets
                                                                          of a telecom tower
GSMA Green Power for Mobile
Greening the Network: Indonesia Market Analysis                                                                                      5

Objective                                         3

Approach                                          3

Glossary		                                        4

Executive Summary                                 5

1. Indonesia                                      6

2. Powering Telecom: Current Approach             11

3. Powering Telecom: Green Telecom
   and Market Sizing                              13

4. Powering Telecom: The Way Forward              15
5. Conclusion                                     17

                                                       Executive Summary                                                             Green power deployments have led to the establishment of 4,590 green
                                                                                                                                     sites in the network, of which 87% are solar based power solutions. The
                                                       Indonesia, the country of thousand islands, was recognized as the             GSMA estimates that the total energy consumption for powering 90,699
                                                       biggest archipelago country in the world, with 17,508 islands. The 5          sites is around 1.58 billion kWh and it would reach up to 2.35 billion
                                                       biggest islands, lying from west to the east, concentrate more than 242       kWh by 2015. The number of off-grid and unreliable grid sites will
                                                       million people. The whole country has more than 60 million people with        increase from 4,174 to 14,854 sites.
                                                       limited access to electricity.
                                                                                                                                     In the short term, MNOs can make immediate savings of about US$5.8
                                                       The Telecom industry is one of the key driving forces for social-economic     million by implementing DG battery hybrid solutions for 874 off-grid
                                                       development in Indonesia. Approximately 90,699 towers serve more than         sites. GSMA also estimates a potential saving of around US$56.4 million
                                                       90.29 million unique subscribers with coverage of about 87% of the            by converting 4,174 potential sites to renewable energy, which would
                                                       population. Market penetration in Indonesia is about 44% and expected         reach US$151.5 million by 2015. This will require an investment of about
                                                       to grow in the coming year1.                                                  US$526.6 million for 14,854 sites by 2015.

                                                       Out of the total 90,699 deployed sites, GSMA identified 874 sites that rely   The ESCO business model presents another opportunity for realizing
                                                       completely on 24x7 Diesel based energy resource and 3,300 sites are           OPEX savings for MNOs. Adopting the ESCO model based on a power
                                                       configured with optimized DG battery hybrid solutions. By 2015, GSMA          purchase agreement (PPA), MNOs realized an OPEX savings of around
                                                       estimates the number of telecom towers will reach 134,426.                    US$11.1 million for 4,174 potential sites in 2012 and it those could rise up
                                                                                                                                     to US$82.6 million by 2015. GSMA estimates that the market potential for
                                                                                                                                     the ESCO reached an estimate US$6.4 million in 2012 and it could reach
                                                                                                                                     US$22.7 million by 2015 for 14,854 sites.

1   Wireless Intelligence
GSMA Green Power for Mobile
Greening the Network: Indonesia Market Analysis 6
Objective 3 1. Indonesia Weather and climate in Indonesia are linked to the country’s proximity
to the Equator, making Indonesia a tropical climate country where, in
Approach 3 Indonesia is a country consisting of 17,508 islands from the East to the general, the weather is hot and humid. Indonesia’s climate is divided
Glossary 4 West and lies between Asia and Australia. It shares borders with into two distinct seasons: dry and rainy seasons. The rainy season goes
Malaysia on Borneo Island, East Timor on Timor Island and Papua from October to April and the dry season starts in March and ends
Executive Summary 5 New Guinea on Papua Island. Other neighbouring countries include in September.
1. Indonesia 6 Singapore, Philippines, Australia, Palau and India.
1.2 Economic
2. Powering Telecom: Current Approach 11 1.1 Geographical
Indonesia’s economy has experienced a stable growth for the past four
3. Powering Telecom: Green Telecom Stretching from Sabang to Merauke, Indonesia consists of various ethnic, years with an average increase in GDP per capita of around 5%. Similarly,
and Market Sizing 13 linguistic and religious diversities. The Javanese are the largest ethnic the population growth is stable with 1% annual growth. In 2011, GDP
group and, politically, the most dominant. Besides having a large per capita has reached US$3,495, relative to 2003, where GDP per capita
4. Powering Telecom: The Way Forward 15
population and densely-populated regions, Indonesia possesses a rich was around US$ 1,058. It showed significant increase within one decade3.
5. Conclusion 17 nature that supports the second highest level of biodiversity in the world.
Table 1. GDP at the current price
Figure 1. Map of Indonesia
2008 2009 2010 2011
GDP per capita (current US$) 2,172 2,273 2,952 3,495
GDP per capita growth (annual %) 4.89% 3.54% 5.11% 5.38%
Population growth (annual %) 1.07% 1.04% 1.03% 1.02%
1.3 Power and Energy
Indonesia, as an emergent country, still has a problem with energy.
Around 25% of the population does not have access to electricity4.
The challenge in Indonesia is unique as it is an archipelago. The power
generation and distribution are the main challenges to providing energy
access to community.
Power and energy are managed by the State Electricity Company (PLN)
under the Ministry of Energy and Mineral Resources (MEMR). PLN is
Indonesia has a population of about 242.32 million people and a territory responsible for generation, distribution and maintenance of the
of 1,904,569 sq. km, with a density of 134 per sq. km2. The territory of electricity infrastructure whereas MEMR formulates policies related to
Indonesia stretches from 6o 08’ N to 11o 15’ S latitude and from 94o 45’ E power. The supervision, control and management are managed by State
to 141o 05’ E longitude. Minister for State Owned Enterprises (BUMN).
2 Statistics Indonesia – www.bps.go.id
3 World Bank – www.worldbank.org
4 Ministry of Energy and Mineral Resources – www.esdm.go.idGSMA Green Power for Mobile
Greening the Network: Indonesia Market Analysis 7
Objective 3 1.3.1 Electricity Infrastructure Table 2 below gives us the comparison of power generation versus
To build electricity infrastructure in Indonesia is tricky. The geographical demand and presents a net positive total generation year by year. At the
Approach 3
distance that separats one island from the other brings its own challenges. province level, the electrification ratio is given in Figure 3, and shows
Glossary 4 If we have a look at the electrification history since 1980 up until 2012, as that while some provinces are still lacking electricity, most of them are
shown on Figure 2, the electrification ratio has reached more than 75% in well provided with an electrification ration of more than 60%.
Executive Summary 5
2012. It does not mean that the access to electricity is identical from one
1. Indonesia 6 place to the other. In fact, the highest electrification ratio is in the main Table 2. Electricity Generation vs Demand7
capital city, Jakarta, and the lowest one is in Papua, with 34.64% of the 2008 2009 2010 2011
2. Powering Telecom: Current Approach 11
population having access to electricity5. Electricity Generation (GWh) 134,343 139,354 153,832 166,355
3. Powering Telecom: Green Telecom Demand (GWh) 129,019 134,582 147,297 157,993
and Market Sizing 13 Figure 2. Electrification Ratio
100% Note: Total electricity generation after losses calculation
4. Powering Telecom: The Way Forward 15 90%
80% 72.9% 75.3%
65.8% 67.2%
5. Conclusion 17 70% 62% 63% 64.3% 65.1% To fulfil the national energy demand, PLN purchases electricity from
57%
60%
43% the private sector at a higher price, pushing PLN to subsidise the cost,
50%
40% 28% since it sells the electricity based on the price fixed by government.
30% 16%
20% 8%
10% Based on PLN’s 2011 power consumption data, the household sector has
0% the highest national energy consumption level (41%) and is followed by
1980 1985 1990 1995 2000 2005 2006 2007 2008 2009 2010 2011 2012
the industrial sector (35%).
Figure 3. Electrification Ratio by Provinces6 Figure 4. Power Consumption per Sector Basis, 20118
2% 2% 2%
Category
>60%
NAD Kalteng Kaltim Gorontalo
89.79% 77.37% 70.92% 66.50% 41 – 60%
Sumut 20 – 40%
84.41% Sulut Malut Papua Barat
Sumsel Kalbar 83.36% 75.84% 65.17%
Riau 74.95% 76.32%
80.16% 35%
Kepri 41%
93.98%
Sumbar
81.85%
Jambi Sulteng
86.22% 73.99%
Bengkulu
77.38%
Babel Sultra
Lampung 89.71% Kalsel 78.77% Maluku
76.75% 83.44% Sulbar Sulsel 78.76% Household
Banten 74.60% 78.77%
69.81% Commercial
Jakarta DIY Industry
100% 75.98%
Jateng Jatim NTB NTT Papua Illumination
77.85% 72.32% 57.50% 45.47% 34.64%
Jabar
Social
5 Ministry of Energy and Mineral Resources – www.esdm.go.id 70.82% Bali Government
76.90% 18%
6 State Electricity Company (PLN) – www.pln.co.id
7 Ministry of Energy and Mineral Resources – www.esdm.go.id
8 State Electricity Company (PLN) – www.pln.co.idGSMA Green Power for Mobile
Greening the Network: Indonesia Market Analysis 8
Objective 3 1.3.2 Energy Regulation in Indonesia Figure 5. 2011 Total Energy Mix11
The Ministry of Energy and Mineral Resources predicts an average 5.03%
Approach 3
growth of energy consumption of 7% per year and the biggest energy
Glossary 4 demand is dominated by fossil energy. Indonesia has aimed to reduce 24.29%
Green House Gas emission (GHG) by 26% or 767 million Ton of Oil
Executive Summary 5
Equivalent (TOE) by its own effort – and by 41% with international
1. Indonesia 6 support by 2020, as stated in the President Act No 61/20119.
2. Powering Telecom: Current Approach 11 46.77%
The table 3 below shows the breakdown in targets of GHG emission
3. Powering Telecom: Green Telecom reduction across segments. The energy sector contribution in the target
and Market Sizing 13 GHG emission reduction stands at 30 TOE as shown in the table. MEMR
expects that, through the development, implementation of renewable
4. Powering Telecom: The Way Forward 15
energy and clean fossil technology, it will reach the target.
5. Conclusion 17 RE
Table 3. Own Effort Commitment 10
23.91%
Crude Oil
Sector Target (million TOE) Percentage Coal
Forest, Peat Land, Agriculture 680 88.66% Natural Gas
Energy Sector 30 3.91%
Waste 48 6.26%
Industry 9 1.17% To promote renewable energy based power plant, government released
some fiscal incentives to the industry.
Based on 2011 data, the total energy usage mix in the country is as seen 1.4 Telecommunication
in Figure 5. Overall, crude oil is the most-popular resource for generating 1.4.1 Subscriber and Penetration12
energy, representing 46.77% of the total energy mix. The main reason for The Telecom market in Indonesia has reached almost 37% market
this is the generation of subsidies provided by the government. The penetration in Q4 2012 and more than 278.3 million connections in the
renewable energy contribution is around 5%. network, with a SIM per subscriber ratio of 2.63.
9 State Ministry for Development Planning – www.bapennas.go.id
10 Ministry of Energy and Mineral Resources – www.esdm.go.id
11 Ministry of Energy and Mineral Resources – www.esdm.go.id
12 Wireless IntelligentGSMA Green Power for Mobile
Greening the Network: Indonesia Market Analysis 9
Objective 3 Figure 6. Subscriber Growth 1.4.2 Managed Services
100 100.00% Managed services or operational outsourcing is the day to day operation
Approach 3 90.29
90 90.00% and management responsibilities awarded to a managed services
81.85
Glossary 4 80 80.00% provider or operations partner, based on certain SLAs and KPIs
70
71.13
70.00% agreements. The managed services providers in Indonesia are led by
Executive Summary 5 59.85 Telecom equipment vendors and some local maintenance companies
Millions
60 60.00%
53.84
1. Indonesia 6 50 50.00% with the support of sub-contractors at the field level.
43.56
40 40.00%
2. Powering Telecom: Current Approach 11
30 27.01%
23.59% 30.00% The operational outsourcing scope varies from MNO to MNO. Some
3. Powering Telecom: Green Telecom 20 18.85% 15.07% 20.00% major MNOs have given their end-to-end maintenance responsibilities
11.17% 10.31%
and Market Sizing 13 10 10.00% to OEM providers while other MNOs are outsourcing only a part of the
0 0.00% operations, including field maintenance activities to Local Maintenance
4. Powering Telecom: The Way Forward 15
Companies. Outsourcing the operations and maintenance of telecom
2007 2008 2009 2010 2011 2012
5. Conclusion 17 and power equipment can benefit MNOs by increasing their focus on
Unique Subscriber (million) Growth Rate
marketing and customer experiences activities to boost their revenue.
Figure 7. Market Penetration On power maintenance, Managed Services or Local Maintenance
3.00 100.00% Companies need to maintain the equipment up time based on agreed
2.61 2.62 2.63
2.52 90.00% SLA/KPIs. But for Managed Services Companies the scope of work to
2.50 2.37 80.00% maintain an operator’s network can be included with some OPEX target
2.00
2.04 70.00% and Spare Parts Management System (SPMS).
60.00%
1.50 50.00% 1.4.3 Tower Company
40.00% The Tower Company business model is growing in Indonesia, but the
1.00 36.71%
33.61% 30.00% paradigm of tower business has not yet changed as Tower Companies
29.50%
25.08% 20.00% – as service providers – are still focusing only on renting space and not
0.50 22.79%
18.64% 10.00% yet moving as total infrastructure provider model, including energy
0.00 0.00% service providers as their tenants.
2007 2008 2009 2010 2011 2012
SIMs Per Subscriber Market Penetration Nowadays, MNOs are facing challenges to expand their coverage due to
land availability and community issues. To eliminate those issues, the
government has released Act No. 02/PER/M.KOMINFO/03/2008 from
Indonesia has about 90.29 million unique subscribers with a market Ministry of CIT to mandate site sharing concept14.
penetration below 50%. The interesting point is that the number of SIMs
per subscriber has reached almost 3 SIMs per subscriber. It shows that
subscribers are using multiple SIMs to get the benefit from MNO’s
discount tariff offered in the market whereas the subscriber growth rate
has declined for the past 3 years13.
13 Wireless Intelligence
14 Ministry of CIT – www.kominfo.go.idGSMA Green Power for Mobile
Greening the Network: Indonesia Market Analysis 10
Objective 3 The GSMA estimates that more than 25,000 towers are identified as Figure 8. Financial Instruments Support
owned by Tower Companies with an average tenancy ratio of 1.5 – 1.6, Financial Instruments Support
Approach 3
and about 40,000 Base stations are installed at those towers sites15.
Glossary 4
1.5 Eco-system and Fiscal Incentive
Executive Summary 5 Tax Borne
Income Tax Value Added Tax Import Duty
by Government
1. Indonesia 6 1.5.1 Industry Structure
2. Powering Telecom: Current Approach 11 The Telecom infrastructure industry in Indonesia is represented by Reduce net income Exemption for import
MNOs or Tower Companies who own the tower assets, as well as by tax for 30% of total duty of:
3. Powering Telecom: Green Telecom investment (5% a year
telecoms equipment vendors who supply telecom sites with power for 5 years)
and Market Sizing 13
equipment and solutions. The site maintenance is led by the managed Accelerated Goods and machinery
4. Powering Telecom: The Way Forward 15 services providers with support from sub-contractors at the field level. depreciation Exemptions of VAT for for development and Regulated in State
Taxable goods, capital investment Annual budget law
5. Conclusion 17 machinery and and its implementation
The ownership structure between MNOs, Tower Companies and Local equipment for RE regulations
Imposition of income utilization (not including Capital goods import
Maintenance providers is presented below. The MNOs still owns the tax on dividend paid spare parts) for construction and
majority of the towers although transferring tower assets to tower to Foreign Taxable at
10%
development of
eletricity industry
companies is becoming a trend in the market.
Compensation for
losses in certain
Table 4. Tower Ownership circumstances
MNO Tower Telecom Power Managed
Company Vendor Vendor Services/
O&M
Who owns the tower assets? • •
Another Act from the Ministry of Finance, no 130/PMK.011/2011,
mentions tax exemption for pioneer industry. The industries that
Who owns the power equipment? • •
can have this facility need to comply with a short list of criteria such
Who provides Power equipment & solution? • •
us below:
Who manages power? • • •
Who plans the power equipment? •
■ Pioneer industry
Who manages site operations? • • • ■ Having a new investment plan minimal IDR 1 billion or equal
US$100 million17
1.5.2 Incentives to Promote Green Technology
■ Placing funds in Indonesia banking minimum 10% from the total
capital investment
On promoting renewable energy in the country, the government released
fiscal incentives for investors. The first act from the Ministry of Finance ■ Exists as Entity in Indonesia
is Act no 21/PMK.011/2010 on tax and custom facilities for renewable
energy utilisation16.
15 GPM Analysis and Research
16 Ministry of Finance, www.depkeu.go.id
17 1 USD = 10,000 IDRGSMA Green Power for Mobile
Greening the Network: Indonesia Market Analysis 11
Objective 3 The pioneer industry criteria as per Act no 130/PMK.011/2011 are: 2. Powering Telecom: Current Approach
Approach 3 ■ Basic metals manufacture industry 2.1 Current State of Deployment
Glossary 4 ■ Industry of oil refining and/or basic organic chemical resources
from oil and natural gas Around 90,699 tower sites are serving the islands across the country.
Executive Summary 5 Based on the current power situation, 4,930 sites (5% of total tower
■ Machinery industry
1. Indonesia 6 sites) are off-grid and more than 4% (3,834 tower sites) are unreliable
■ Renewable resources industry
grid sites18.
2. Powering Telecom: Current Approach 11 ■ Communication equipment industry
3. Powering Telecom: Green Telecom This said, the power situation in Indonesia is different from one island to
and Market Sizing 13 Provision of exemption facilities or income tax reduction as mentioned another island. Java and Bali islands have more reliable power grid
by the Act are presented below: connection than the other islands, with an electrification ratio of more
4. Powering Telecom: The Way Forward 15 than 78% and an average outage of less than 16 hours a year19.
5. Conclusion 17 Figure 9. Exemption Facilities
The 8,764 sites per island with distribution issues are shown on figure 10.
ACT 130/PMK.011/2011 for Corporate Tax Payer
Figure 10. Problematic Sites Distribution
1.55%
5.27%
EXAMINATION OF CORPORATE INCOME TAX
5 – 10 tax years
29.75%
After the of Corporate Income Tax exemption facility
REDUCTION OF CORPORATE INCOME TAX
50% of Income Tax payable for 2 tax years
42.05%
Sumatera
Ministry of Finance may provide facilities Corporate Java
Income Tax exemption or reduction for a period EXCEED
predetermined period of time 21.38% Bali-Nusra
Kalimantan
Sulawesi-Papua
The facilities can be utilized if:
1. Had executed the entire capital investment
2. Has been produced commercially
Figure 10 shows that MNOs are suffering in Sumatera where 42.05% of
the problematic sites are located, followed by Kalimantan with 29.75%.
19 State Electricity Company (PLN) – www.pln.co.idGSMA Green Power for Mobile
Greening the Network: Indonesia Market Analysis 12
Objective 3 To address the challenges of unreliable grid connection, MNOs try to The cost of powering Telecom sites can be divided into direct and
implement energy efficiency solutions for those sites. DG battery hybrid indirect as below:
Approach 3
solutions are common for areas with unreliable grid. The number of
■ Direct cost : cost of diesel and electricity
Glossary 4 current deployments for problematic sites and their power source is
shown on figure 11. ■ Indirect cost : cost of maintenance for the equipment including diesel
Executive Summary 5 generator and other power system, and overheads
1. Indonesia 6 More than 52% of sites are green sites and around 37% of them are using
2. Powering Telecom: Current Approach 11 DG battery hybrid solution by optimizing batteries on site20. As shown in figure 12, the cost structure varies by component between
off-grid sites and on-grid sites. The major difference is the electricity cost
3. Powering Telecom: Green Telecom Figure 11. Current Power Solution Deployment for Problematic Sites that is relevant only for on-grid sites.
and Market Sizing 13 24x7 DG
874,
4. Powering Telecom: The Way Forward 15 9.97%
The overall cost structure shows that diesel costs are the major
component in both scenarios. For off-grid cost structure the diesel
5. Conclusion 17 constitutes 70% of the total cost and 59% for on-grid site21
Figure 12. Powering Cost Structure
7%
Off-Grid Cost 70%
Green Power 23%
4,590
52.37%
DG-Battery 14%
Hybrid
6%
3,300 On-Grid Cost
37.65% 59%
21%
0% 20% 40% 60% 80% 100%
Direct: Electricity Logistic Direct: Diesel Maitenance
2.2 Cost of Powering the Telecom Sector
The cost of powering the telecom sector will depend on the power
connections available for each site. Bad or unreliable power connections
have led MNOs to rely on diesel generators to power the site. Diesel cost
varies across sites depending on the geography and location.
20 GPM Research
21 GPM Research (the cost modelling for Java island structure)GSMA Green Power for Mobile
Greening the Network: Indonesia Market Analysis 13
Objective 3 3. Powering Telecom: Green Telecom and Market Sizing Indonesia also has a big potential for solar energy deployments as the
daily average solar insolation is 4.8 kWh/sq. m/day. Figure 13 shows that
Approach 3 This section describes the potential of green technology and the the southern part of the country receives the highest solar radiation.
Glossary 4 available options in Indonesia. It also analyses the levels of adoption of
green power sources in the Telecom industry. Figure 13. Solar Radiation in Indonesia23
Executive Summary 5
1. Indonesia 6 3.1 Green Technology Options
Indonesia has a wide range and variety of renewable resources, from
2. Powering Telecom: Current Approach 11
geothermal, hydro, mini hydro, nuclear, biomass, wind and solar energy.
3. Powering Telecom: Green Telecom According to the Ministry of Energy and Mineral Resources, renewable
and Market Sizing 13 energy resources have a potential to contribute to national electrification
as shown on table 5.
4. Powering Telecom: The Way Forward 15
5. Conclusion 17 Table 5. Non Fossil Fuel Energy Resources22
Non Fossil Energy Potential Capacity
Hydro 75,670 MW
Mini/Micro Hydro 1,013.5 MW The average wind speed in Indonesia is 3 – 4 m/s, but the southern part
Geothermal 29,038 MW of Indonesia has an average wind speed of 5 -6 m/s which may be
Biomass 49,810 MW suitable for small scale Telecom applications24.
Uranium 3.000 MW
Figure 14. Wind Speed in Indonesia
Solar Energy 4.80 kWh/m2/day
Wind Energy 3 – 6 m/s
Hydro technology has the potential to be implemented on most of the
larg islands across the country. Kalimantan and Papua have more than
20,000 MW hydro power generation potential. Kalimantan is called the
island of a thousand rivers.
About 276 geothermal locations have been identified in Indonesia; most
of them are located in Sumatera, Java and Sulawesi. And the rest are
located in Kalimantan, Maluku and South Nusa.
Fuel cells based on hydrogen have massive deployments and are well
Indonesia has a strong potential for biomass gasification. The most known in the Telecom industry since more than 500 sites are up and
common biomass resources available in the country are rice husk, crop running in Sumatera and Java islands. The supply chain issue for
residue, wood, animal waste, municipal waste, sugarcane bagasse etc. hydrogen and methanol is taken care of by third party fuel cell
Rice husk and animal residue might be some of the most promising suppliers, based on supply and maintenance agreements.
biomass energy resources in Indonesia.
22 Ministry of Energy and Mineral Resources – www.esdm.go.id
23 Tier – www.3tier.com/firstlook
24 Meteorology, Climatology and Geophysical Department – www.bmkg.go.idGSMA Green Power for Mobile
Greening the Network: Indonesia Market Analysis 14
Objective 3 The table below describes the market availability for each choice and
the potential for adoption of the particular green technology in the
Approach 3
Telecom industry.
Glossary 4
Table 6. Green Power Choices in Indonesia
Executive Summary 5
Factors Solar Biomass Wind Fuel Cell Pico Hydro
1. Indonesia 6
Solution Availability Very Good Poor Poor Very Good Good
2. Powering Telecom: Current Approach 11 Reliability Good Good Good Good Good
Market Acceptance Good Poor Poor Good Poor
3. Powering Telecom: Green Telecom
and Market Sizing 13 Supply Chain Readiness Good Poor Poor Good Good
Stage of Adoption Commercial N/A Commercial Commercial Commercial
4. Powering Telecom: The Way Forward 15
Resource Potential Moderate Good Low Moderate Low
5. Conclusion 17 Barriers to Adoption - High CAPEX on initial stage - Supply chain challenges - Low scalability only limited on - Supply chain availability for - Number of sites near the
- Space requirement - Unproven operational trial in coastal area hydrogen or methanol river flow location
telecom field - High initial CAPEX - Suitable only for unreliable sites - High initial CAPEX
- Business model offering - Operational challenges
Risks to Adoption - Reliability issues due to distance - Biomass supply and sustainability - Operational risk due to wind speed - High replacement cost of fuel cell - Operational risks associated
from the nearest O&M based - Scalability of solution for availability with limited knowledge and
- Vandalism of battery and panel theft telecom load - Unreliable power generation due readiness
to wind speed characteristic
3.2 Market Sizing Figure 15. Current Deployment
In Indonesia, the CAPEX model is the only existing option for MNOs to Green Power Installed Potential for Green Power
put green technology solutions in their network. Meanwhile the OPEX 1
1
model is only running for DG lease agreements on energy outsourcing 2
4,023 3,300
model between MNOs and suppliers. 7
556
GSMA has identified that from 90,699 tower sites in Indonesia, 5% or
4,590 sites, are deployed with green power solution and 4,174 additional
sites have the potential to be converted to green sites25. Of these 874
potential sites, 79% are unreliable grid sites with outage in excess of
more than 8 hours a day while the remaining 21% of sites which are
completely off-grid with only diesel generators and batteries to power
Solar 24x7 DG
the system.
Fuel Cell DG-Battery Hybrid
Biofuel
Solar-Wind
Wind
25 GSMA-IFC GPM Market Research and Analysis
Pico HydroGSMA Green Power for Mobile
Greening the Network: Indonesia Market Analysis 15
Objective 3 3.3 Potential OPEX Saving Figure 16. Site Growth27
With 4,174 potential sites, there may be room for significant savings by Site Growth
Approach 3
implementing green power technology. GSMA estimates that MNOs can
160,000
Glossary 4 save around US$56.4 million per year by going green. This will require a
140,000 134,426
Executive Summary 5 CAPEX of around US$35,500 per site. The total investment requirement
120,000
is of about US$148 million for the 4,174 potential sites26.
100,000 90,699
1. Indonesia 6
80,000
2. Powering Telecom: Current Approach 11 4. Powering Telecom: The Way Forward 60,000
40,000
3. Powering Telecom: Green Telecom 4.1 Short Term
and Market Sizing 13 20,000
MNOs have short term plans to reduce their operational cost as well as 0
4. Powering Telecom: The Way Forward 15 carbon footprint in their network by becoming energy efficient.
2012 2015
Converting off-grid sites that are running a diesel generator 24 hours per
5. Conclusion 17 Tower
day to green power will have a huge impact on savings. Some equipment
modernisation to low power BTS, replacing indoor BTSs to outdoor BTSs Figure 17. Off-Grid and Unreliable Grid Sites Growth
or replacing existing air conditioners with fan cooling unit (FCU) are
some examples of energy efficiency enhancements that most MNOs do. 10,000
9,132
9,000
GSMA records that out of 90,699 sites across the country, 874 sites are
8,000
located in off-grid areas and 3,300 more sites are on-air, in unreliable
7,000
grid conditions. To power up 90,699 sites, it will require around 1.58
6,000
billion kWh on an annual basis. 5,722
5,000
4,000 3,300
GSMA estimates that the potential OPEX saving, by converting the 874
3,000
off-grid sites from 24x7 DG run systems to DG-battery hybrid solutions,
2,000
will create a saving of more than US$5.8 million every year. The savings
1,000 874
can be achieved more by optimising DG and batteries configuration.
0
Off-grid Unreliable Grid
4.2 Long Term
2012 2015
In the long term, considering the market penetration growth from 37% to
65%, as well as site sharing/leasing trends and the 2% of networking
blocking ratio, GSMA estimates tower site growth to be at 134,426 sites in The long term strategy will be in line with OPEX reduction and energy
the next 3 years. optimisation programme by ensuring technology solutions and their
benefits, as well as creating a positive environmental impact.
Regarding off-grid and unreliable grid sites, GSMA estimates that 5,772
new sites will still be off-grid sites and 9,132 sites will have unreliable
grid connectivity by 2015. Except for certain MNOs that have corporate
social responsibility laws on deploying USO in remote rural area, the
26 GSMA-IFC GPM Market Research and Analysis
27 GSMA GPM Market Research and Analysis
number of off-grid site will increase accordingly.GSMA Green Power for Mobile
Greening the Network: Indonesia Market Analysis 16
Objective 3 4.3 Site Sharing/Leasing The transformation has only just started- Energy Service Companies
The site sharing or site leasing business model has become one of the (ESCO) are yet to fully emerge to provide reliable power outsourcing to
Approach 3
most strategic options for MNO to reduce their capital cost on MNOs or tower companies when available. The ESCO can act as an
Glossary 4 infrastructure part. Site sharing business models currently have a energy provider to both tower companies and MNOs. An ESCO not only
concept of one to one swap deal between two operators, which is takes responsibility for financing the equipment, but also the full provision
Executive Summary 5
different from site leasing business models where MNO needs to go to of power to the tower. The ESCO business and energy service models that
1. Indonesia 6 tower companies to match their BTS planning with tower company’s are being considered, developed and tested in the market place include:
2. Powering Telecom: Current Approach 11 infrastructure. ■ Power Purchase Agreement (PPA), the ESCO will install the
renewable energy power system and sells power to the MNOs at an
3. Powering Telecom: Green Telecom On site leasing, Tower companies provide passive infrastructure to agreed per kWh rate.
and Market Sizing 13 support MNOs. The emerging trend is that MNOs will try to sell their
■ Energy Saving Agreement (ESA), the ESCO will install the renewable
4. Powering Telecom: The Way Forward 15 towers to tower companies and MNOs will lease them back from the
energy power system on existing site and the MNOs fee is based on
tower companies.
5. Conclusion 17 portion of verified energy cost ‘savings’.
4.4 Future Business Model ■ Fixed Fee Operating Lease, the ESCO will install the renewable energy
power system and sell monthly power to the MNO at a fixed cost.
Indonesia’s market is unique with regards to tower sharing mechanisms.
The main benefit from this scheme is that MNOs will not have any
MNOs will bring their own power systems on the lease premises. In
variable budget on their expenditure.
some parts of the world, the trend has shifted in terms of the business
model and infrastructure ownership. Tower companies will provide
The ESCO model will allow MNOs to make some savings. The saving for
passive infrastructure for MNOs. It means MNOs do not need to spend
4,174 potential sites was of about US$11.1 million in 2012 and will be of
their time and capital on providing power systems to the sites and they
US$82.6 million by 2015, for MNOs that have not invested any CAPEX.
can therefore focus on their core business to maintain their market share
The potential market for the ESCO model reached US$6.4 million in 2012
and customer satisfaction.
and will reach up to US$22.7 million for 14,854 sites by 201528.
Figure 18. Business Model Trends
Shared Tower
Third Party
ESCo
Community
Past Present Future
26 GSMA-IFC GPM Market Research and Analysis
27 GSMA GPM Market Research and Analysis
28 GSMA GPM Market Research and AnalysisGSMA Green Power for Mobile
Greening the Network: Indonesia Market Analysis 17
Objective 3 5. Conclusion
Approach 3 Indonesia, as the biggest mobile network in South East Asia, has
Glossary 4 contributed 4,590 green sites across the country. Solar and fuel cell
technologies are the most preferable choices for MNOs to green their
Executive Summary 5 network. Some incentive trials and studies on the possibility for wind
1. Indonesia 6 energy solutions are needed before powering the Telecom networks.
On energy efficiency, DG battery hybrid solutions are the most practical
2. Powering Telecom: Current Approach 11 ones in Indonesia for Telecom networks as they work by optimising
3. Powering Telecom: Green Telecom batteries life cycle on site and reducing generator run hours.
and Market Sizing 13
Indonesia has targeted to reduce Green House Gas emission (GHG) by
4. Powering Telecom: The Way Forward 15
26% (767 million TOE) through its own effort and 41% with international
5. Conclusion 17 support by 2020. To boost the green technology penetration, the
government has implemented some incentives for the industry starting
with income tax reduction, exemption of VAT and some waiver on
import duty.
However to green the network and create a positive environmental impact,
proper planning is required to deploy a new plan in the network, with the
government’s support as a regulator in the industry.You can also read