Shape and Size of Particles Scaled from Concrete Surfaces during Salt Frost Testing and Rapid Freeze/thaw in Water - Sciendo
←
→
Page content transcription
If your browser does not render page correctly, please read the page content below
Nordic Concrete Research – Publ. No. NCR 64 – ISSUE 1 / 2021 – Article 4, pp. 53-68

 © Article authors. This is an open access article distributed under            ISSN online 2545-2819
 the Creative Commons Attribution-NonCommercial-NoDerivs
                                                                               ISSN print 0800-6377
 licens. (http://creaticecommons.org/licenses/by.nc-nd/3.0/).

                                                                              Received: March 5, 2021
 DOI: 10.2478/ncr-2021-0001                                            Revision received: June 15, 2021
                                                                               Accepted: June 16, 2021

Shape and Size of Particles Scaled from Concrete Surfaces during Salt Frost
Testing and Rapid Freeze/thaw in Water

                        Marte Beheim Brun
                        MSc
                        Norwegian University of Sc.&Techn., Dept. of Structural Eng.
                        Richard Birkelands vei 1a, NO-7034 Trondheim
                        e-mail: martebbrun@msn.com

                        Andrei Shpak
                        Senior Engineer, Ph.D.
                        Aker Solutions AS
                        Ranheimsvegen 10, 7044 Trondheim, Norway
                        e-mail: andrei.shpak@akersolutions.com

                        Stefan Jacobsen
                        Professor
                        Norwegian University of Sc.&Techn., Dept. of Structural Eng.
                        Richard Birkelands vei 1a, NO-7034 Trondheim
                        e-mail: stefan.jacobsen@ntnu.no

ABSTRACT
Thickness (T), Length (L), Width (W) and size distribution of scaled concrete particles in frost
testing were measured. T (mm) increases with particle size surprisingly similarly for different
concrete qualities and frost test methods. 2T/(L+W) reduces as function of size and is lowest for
the largest particles of the salt scaling test: 0.1 – 0.15 but increases if large aggregate particles
scale. Particle size distributions from salt frost testing peak for particles of 1-2 mm. The particles
are flakier compared to particles from freeze/thaw in water which also have flatter size distribution
no matter type of concrete or degree of damage. Scaling in water is not so efficiently reduced by
air voids despite protecting very efficiently against internal damage and scaling in salt frost
testing. Comparisons with T predicted by the glue spall model (≈3/4 x ice thickness) and the air
void dependent (≈3x critical air void spacing) model proposed by Fagerlund are difficult due to
the size dependent flake thickness. Image analysis could well describe shape. Further studies of
concrete flake thickness scaled at varying thickness of ice layers are proposed.

Key words: frost, de-icer salt, scaled particles, shape, T/L/W, size, microscopy, image analysis

                                                    53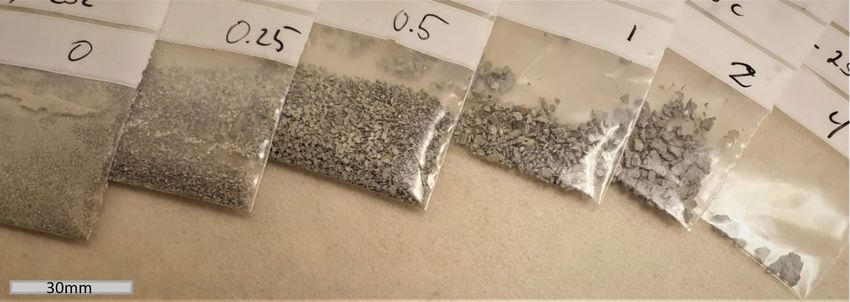
Nordic Concrete Research – Publ. No. NCR 64 – ISSUE 1 / 2021 – Article 4, pp. 53-68

1.            INTRODUCTION

Frost deterioration can cause surface scaling and/or cracking of concrete structures simultaneously
exposed to frost, water, de-icers and seawater unless the material quality is adequate according to
standard rules and specifications [1]. An effective air void system is important along with
sufficiently low mass – ratio of an adequate binder, sufficient curing and high strength [1,2].
Exposed products and structural parts are kerbs, safety barriers, horizontal parts like decks, slabs,
partly or completely wet and frequently de-iced, and submerged vertical parts like pillars, weather
exposed walls, hydraulic structures like dams and waterways. A synergistic form of deterioration
together with other forms of deterioration (ASR, reinforcement corrosion) can also occur. Air
voids have, however, also been found to protect against accelerated damage by freezing of water
in pre-existing cracks [3] and against loss of bond to steel [4]. Hence structural analysis of frost
deteriorated concrete should be accompanied with proper analysis of the concrete material in
question including the air void system. The effect of Supplementary Cementitious Materials
(SCM) like Fly Ash (FA), Slag (GGBFS), Condensed Silica Fume (CSF) on frost durability has
received attention due to their widespread use. SCM effect on frost durability is debated since
performance in frost testing tends to vary largely with type of SCM, curing,
ageing/drying/carbonation and the type of performance test, even at constant mass- or w/b- ratio.
In the European Salt Frost Test [5] for measurement of resistance against scaling (kg/m2 concrete
lost from the surface) there are therefore special rules for curing and ageing of concrete specimens
with SCM. Furthermore, [5] states that signs of internal cracking following the salt scaling testing
should be reported. Durability against internal cracking (increased length/dilation, loss of
compressive strength, cracking, loss of dynamic modulus of elasticity) is usually measured in
other types of standard tests like [6,7].

Surface scaling only occurs when the surface is continuously wet or covered with ice during
freezing and thawing, both in salt frost testing [5,8] and in freeze/thaw in water [6,7]. Though
surface damage at freezing with pure water is studied less than salt scaling it has been investigated
by a few researchers [10,11]. Gagné [10] monitored scaling during rapid freeze/thaw testing in
water according to [6] of many specimens with w/b = 0.23 – 0.30 with varying air void systems,
cement types and with and without CSF. No clear correlation was found between scaling and
internal cracking measured on the same specimens. It was even noted that air entrained specimens
could sometimes scale more than companion specimens without air during the rapid freeze/thaw
test in water whether internal cracking occurred or not. In [11] the scaling in rapid freeze/thaw in
fresh water [6] was found to correlate more clearly to the accelerated liquid uptake during
freeze/thaw than salt frost scaling in the European salt frost test [5]. This lack of correlation
between salt scaling and liquid uptake during salt frost test supports that different mechanisms are
active in salt scaling and internal cracking. In another study on w/b = 0.45 mixes without and with
SCM the effect of salt in the water surrounding the specimen in the rapid freeze/thaw test was
studied [12]. It showed that salt increased the scaling compared to pure water as expected, though
the internal cracking was similar in water and 3 % NaCl [12]. The work [13] points to that scaling
with pure water is related to ice bond to the concrete surface. Although field inspection showed
scaling damage in the ice zone on the upstream side of concrete dams this was hard to mimic in
the lab and fresh water ice only caused scaling on concrete with relatively high w/b. The first
indication of a different mechanisms than a “simple degree of saturation-damage relation” for salt
frost scaling is the study of Verbeck and Kliger [8]. They observed a pessimum de-icer
concentration in the outer salt solution for both air entrained and non-air entrained concrete with
maximum scaling around 3 % de-icer. They used four widely different organic and inorganic de-
icers in concretes that had been presaturated with water to the same moisture state. Given the very
different chemical characteristics of their de-icers Verbeck and Klieger claimed that the salt
                                                 54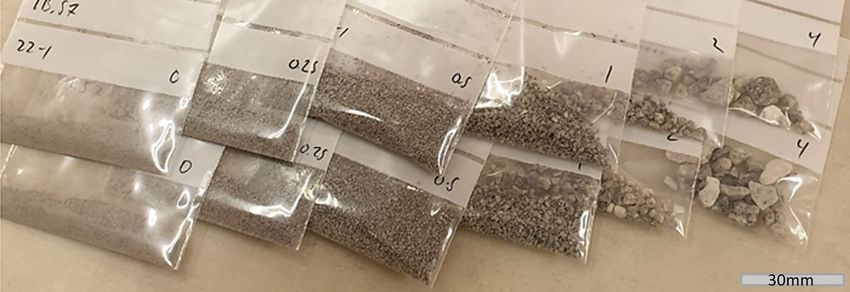
Nordic Concrete Research – Publ. No. NCR 64 – ISSUE 1 / 2021 – Article 4, pp. 53-68

scaling mechanism was physical rather than chemical. The pessimum effect of the concentration
of the outer salt solution has since been verified by several [14-18]. It seems that today we are left
with 2-3 explanations for the amplifying effect of salt. The glue spall mechanism by Valenza and
Scherer [19,20] explains quantitatively the damage by differential thermal contraction ice-
concrete and fracture of the outer ice layer with pockets of brine. The concrete surface then cannot
arrest cracks propagating from the ice and particles spall or scale off. It has been supported by
other studies [18, 21, 22], particularly the effect of ice thickness has been taken as evidence, and
glue spall is recognized widely. However, several studies have related damage to transport and to
osmotic type pressure due to internal freezing causing cryosuction [23-28]. Fagerlund [23] linked
the pessimum to a superposition of a hydraulic pressure (reduced by increasing salt) and an
osmotic pressure (increased by increasing salt concentration until reaching a constant value above
a quite low concentration), though not very quantitatively. Slow freezing with more time for
transport while there is still liquid on the surface [14, 16, 24, 25] was found to relate to and
promote scaling. Liu and Hansen [26, 27] observed salt scaling without internal cracking in their
dried and resaturated well-air entrained specimens. They related the scaling damage to
cryosuction causing swelling of the cement paste around aggregate particles producing very thin
flakes (≈0.1 – 0.3 mm) of scaled cement paste. They also correlated scaling to the sorptivity of
the surface concrete. Hence, they concluded that the increased scaling damage with de-icer salt is
due to increased transport and ice formation in the pore system while the salt solution keeps the
concrete surface ice free for a longer period than pure water does [26,27].

Valenza and Scherers [19] glue spall damage mechanism hence links the damage to the pessimum
effect while Sun and Scherer [20] quantified the protective effect of air voids by cryosuction
which offsets the thermal mismatch between ice and concrete during freezing. However, the glue
spall mechanism offers no explanation for the relation between sorptivity and scaling seen in dried
– resaturated air entrained specimens that scale without simultaneous internal cracking [26, 27].
Furthermore, glue spall cannot explain why scaling can be so severe even in air entrained concrete
after the concrete has been subjected to even rather mild drying and resaturation as seen in [14].

Reviewing the depth of the damage itself caused by each freezing event is important. Valenza and
Scherer [19] predicted that the thickness of the scaled concrete layer will be maximum ¾ of the
thickness of the ice. Hence thickness should be maximum 3 mm x 1.09 x ¾ ≈ 2.5 mm for a 3 mm
de-icer salt layer on a non-durable surface. Liu, Kang and Hansen [26] measured their thin layers
of scaled material by calliper to 0.1 – 0.3 mm. Fagerlund [23,28] related the increased scaling
with 3 % salt to high degree of saturation at the surface, presumably due to more time for water
uptake. In [28] the damage itself was ascribed to a hydraulic pressure type mechanism causing
flakes with a critical thickness in the order of three times the critical air void spacing factor, i.e.
in the order of 0.75 mm. Experimentally thickness was found to be ≈1 - 4 mm by particle size
analysis of cement paste fragmented by freeze/thaw in water and 3% NaCl. There was however
no clear effect on size of salt which was attributed to uncertainties about degree of air void filling
and the effect of drying and resaturation on freezeable pore water. Lindmark [16] was freezing
water saturated ≈5 mm thick OPC mortar discs of varying w/c and air content while submerged
in temperature-controlled sub-zero temperature, liquid, salt solutions. He observed that 2-3 of his
discs split in two ≈ 2.5 mm thin discs during freezing, possibly indicating critical thickness ≈ 2.5
mm. The studies [21,22] showed that the amount of scaling depends on the thickness of the ice
layer though without characterizing the shape and thickness of the scaled flakes. Hence there are
no systematic studies of size of scaled-off flakes beyond the study of Fagerlund on paste [28] and
by Liu, Kang and Hansen [26].

                                                  55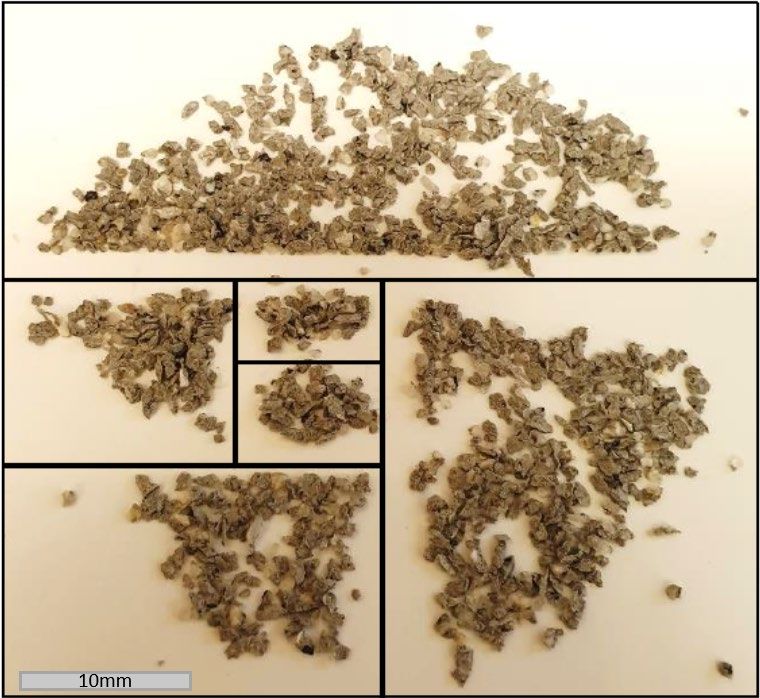
Nordic Concrete Research – Publ. No. NCR 64 – ISSUE 1 / 2021 – Article 4, pp. 53-68

Based on the above it appears that scaling in fresh and salt water may not be explained by the
same mechanism(s) and that scaling might perhaps occur without ice on the surface. Furthermore,
there is no general explanation that fits both for scaling from a concrete surface during freeze/thaw
in water and in de-icer salt solution. Scaling is normally considered to happen with salt solution
on the surface whereas scaling with fresh water is associated with internal cracking. (The term
“external cracking” has even been used [29] for fresh water scaling). The freshwater surface
damage seen on concrete dams is however concentrated in the ice-covered zone between reservoir
and air [13] and thus has at least one important similarity with salt scaling in that ice has covered
the damaged surface. At present we do not know the shape of the scaled concrete material in the
freshwater test [6] and the material scaled off in the salt frost test [5]. Are they different and do
they resemble the predictions [19, 28]?

The scope here is to investigate the size and shape of the scaled material from the concrete surface
of different air- and non-air entrained fly ash concretes exposed in two very different freeze/thaw
tests; rapid freeze/thaw in water [6] and salt scaling testing [5]. The two tests are similar in that
the surfaces are always ice covered or wet during freezing and thawing, yet also very different. In
[6] moulded, paste rich, surfaces that have never been dried are exposed to rapid cycles in water,
and in [5] sawn surfaces are pre-dried and re-saturated with water and then exposed to 3 % NaCl
during freeze/thaw. The concretes and scaled material were selected from the study [11].

2.            EXPERIMENTS

Four different concrete mixes from the major study [11] were selected for investigation. Concrete
specimens of the four mixes were run in two different freeze/thaw tests: rapid freeze/thaw in water
[6] and salt frost scaling testing with 3 % NaCl [5]. Scaled material was then collected during
early and later freeze/thaw cycles and analyzed.

2.1           Concrete and freeze/thaw testing

The four concrete mixes were made with w/b = 0.40 and 0.293, respectively. Both contained 33
% low lime fly ash and 4 % condensed silica fume of total binder. The paste volume fractions
were practically constant: 262 – 266 liters/m3 and normal density granitic aggregate with
maximum aggregate size = 16 mm was used. Non-air entrained and air entrained mixes of each
binder quality were produced with highly flowable consistency of 190 – 220 mm slump in the
concrete laboratory at SINTEF in Trondheim [11].

Rapid freeze/thaw testing in water was performed according to [6] on two parallel cylindrical
specimens of Ø 100 h 300 mm for each mix. The cylinders were cured sealed in steel molds for 1
day and then 13 days curing in 20 C water according to [6]. The specimens had cast surfaces. On
day 14 they were run through 6 cycles per day standing in PVC tube shaped forms giving a 3 mm
water layer around each concrete cylinder. The cycles were produced in a powerful freeze/thaw
chamber thawing the cylinders by flooding with water according to the specifications [6]. Scaled
material was rinsed from the specimen surfaces and collected from the PVC tubes approximately
each 30 cycles.

Salt frost testing was done on sawn surfaces of 150 by 150 by 50 mm slabs cut from 150 mm
cubes following 1 week of water curing. The sawn slabs were stored in 65 % RH/45 g/(m2.h)
evaporation capacity/20°C climate chamber while sawing and preparing the specimens with
                                                 56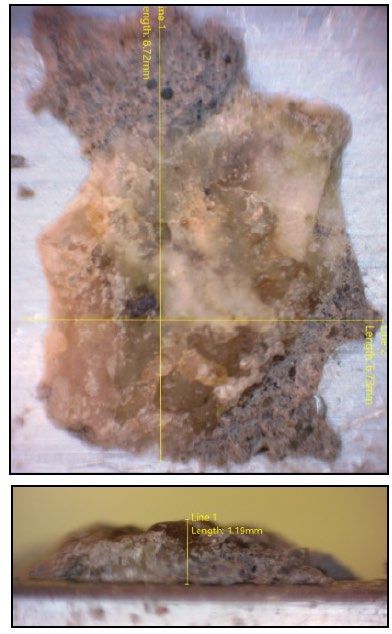
Nordic Concrete Research – Publ. No. NCR 64 – ISSUE 1 / 2021 – Article 4, pp. 53-68

rubber dam, insulation etc according to [5]. Before start of freeze/thaw the surfaces were
resaturated with pure water for 3 days and freeze/thaw then started with a 3 mm layer of 3 % NaCl
solution with temperature cycle in the salt solution according to [5] 31 days after casting. Scaled
material was collected according to the standard after each 7 or 14 cycles. Scaled material from
both tests was brushed and rinsed off, collected in filter papers, dried and calculated as scaled
concrete mass per unit surface of concrete specimen before representative samples for size- and
shape analysis were taken.

Table 1 shows a brief overview of the concrete mixes, air void characteristics according to ASTM
C457, cube compressive strength, frost exposure and sampling for shape analysis.

Table 1 - Overview of concrete mixes and frost exposure before sampling scaled material
              (fa/b: fly ash/binder mass ratio, A: air entrained, L: spacing factor)
 Mix                                     Rapid F/T [6]                       Borås [5]
 w/b-fa/b air(%)-L(mm) -fcc28 (MPa) ~30 cycles      ~160 cycles      ~7 cycles        ~56 cycles
 0.40- 33A -4.7 -0.24mm- 59               x                x                x              x
 0.40- 330 -2.8 -0.79mm- 73               x         (not studied)           x              x
 0.293-33A-5.9-0.20mm- 82                 x                x          (not studied) (not studied)
 0.293-330-1.8-0.63mm- 99                 x                x          (not studied) (not studied)

Table 2 shows rating of the four concrete mixes in the two different frost tests and samples used
for particle size- and -shape analysis. Scaling was measured on the four concrete mixes during
both 300 rapid freeze/thaw cycles in water and during 56 salt frost cycles, and Durability Factors
(DF – see footnote Table 2) and acceleration rate of scaling were determined. The amount of
material for analysis of size and shape for salt scaling came from three and two specimens for 0-
7 cy and 42-56 cy, respectively.
Table 2 - Rating in frost tests: scaling m (kg/m2) ≈80 and 300 cy. in water, 56 cy. in 3%NaCl,
cracking (DF), acceleration (m56/m28)) and mass (g) of material examined for size & shape

                                     Rapid F/T in water [6]                            Salt Scaling 3% NaCl [5]
                 m         m                                                 m            m56
    Mix           ≈80       300                 ~0-30 cy        ~130-160cy    56                  ~0-7 cy      ~42-56 cy
                      2         2     DF        (g)             (g)               2        /      (g)          (g)
                 (kg/m )   (kg/m )                                           (kg/m )
                                                                                          m28
    0.40- 33A      0.1      1.22       104      14.12            32.38        0.08        1.3          ≈1         ≈0.3
    0.40- 330    0.66 1      - 1       51       14.56               -         4.25        2.0          ≈10        ≈40
    0.293-33A    0.09 2     0.62        98       7.43            15.22        0.04        2.4           -          -
    0.293-330     0.17     0.35 3     ≈40 3     14.23             7.28        0.25        3.5           -          -
1
  : stop at 87 cy, severe damage/acc., Rel.Dyn.Mod. = 60 % at 23 cy so DF = 60 x (23/300)          2
                                                                                                    :0.09 kg/m2 at 89 cy
3
  : scaling measured to 214 cy and RDM to 162 cy so DF extrapolated to ≈60 x (200/300)

Table 2 shows that the air entrained mixes perform very well according to the criteria of both
standard tests. In the salt scaling test [5] both 040-33A and 0293-33A have scaling < 0.1 kg/m2
after 56 cycles though a slight passing of the acceleration criterion for the 0293-33A. The
acceleration > 2 can perhaps be due to scatter between the five parallel samples. It can be quite
high between the four parallel slabs when scaling is very low, like on 0293-33A and 040-33A.
For the non-air entrained mixes scaling was severe in 040-330 and moderate in 0293-330. Highest
acceleration was seen in the non-air entrained high strength mix 0293-330. In the rapid freeze
thaw test [6] Durability Factors are around 100 % for both air entrained mixes whereas the non-
air entrained concretes do not pass the test due to steady degradation and Durability Factors of 5-
                                                           57
Nordic Concrete Research – Publ. No. NCR 64 – ISSUE 1 / 2021 – Article 4, pp. 53-68
40 %. However, it is interesting to note that air entrainment does not protect as clearly against
scaling in the rapid freeze/thaw test in water as air entrainment protects against salt scaling
damage. Table 2 indicates that the scaling is not that much lower in the air entrained mixers than
in the non-air entrained companions at comparable number of cycles. In fact, the protective effect
of air voids against scaling is moderate at freeze/thaw in water compared to the very clear
reduction of scaling by air entrainment seen in the salt frost test for both mixes. This is in line
with the observations of Gagné [10] who performed a large study of cracking and scaling of high
performance concrete in both scaling- testing according to ASTM C672 and cracking testing
according to ASTM C666 ProcA. Gagné even noted higher scaling with air than without air for
several of his high performance concrete specimens when exposed to rapid freeze/thaw in water.
Hence the scaled particles from [11] should be interesting to study within our scope.
2.2 Particle size
Fragments collected after the two frost tests and numbers of cycles shown in Table 2 were
carefully sieved by hand on ISO sieves (brass, square openings) of 0.25, 0.5, 1, 2 and 4 mm and
the particle size distribution determined with a weight with 0.001 g accuracy. To avoid fracture
of the thin flakes they were passed through the sieve openings with careful hand shaking on a
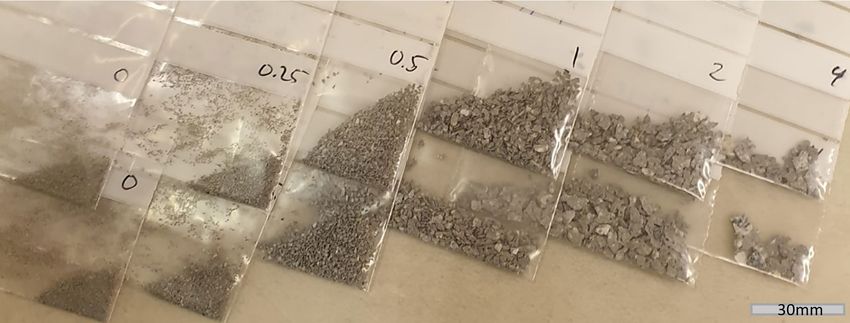
single sieve at a time. Figure 1 shows examples of particles stored in plastic bags after sieving.
Figure 1 – Scaled particles of concrete 040-330 after sieving, top: freeze/thaw in water 0-23 cy,
centre: salt frost 0-5 cy, lower: salt frost 43-57 cycles.
58
Nordic Concrete Research – Publ. No. NCR 64 – ISSUE 1 / 2021 – Article 4, pp. 53-68

2.3 Particle shape and -aggregate content

After sieving and storing in plastic bags as shown in Figure 1 the samples were subdivided by
halving until ten particles were left, see Figure 2.

Figure 2 – Subdivision of scaled particles after sieving (salt frost test 040-330, 0-5 cy).

The smallest orthogonal particle Length (L), Width (W) and Thickness (T) where then measured
using a digital microscope with digital calliper. The calibration and measurements were done
using a very thin double-sided tape on a square metal profile and placing the thickest part of the
fragments close to the edge of the metal profile, see Figure 3 below.

Figure 3 – Fixing of particles on 40 x 40 mm metal profile with double-sided tape for digital
calliper calibration and measurement of Length (L), Width (W) and Thickness (T)

                                                 59
Nordic Concrete Research – Publ. No. NCR 64 – ISSUE 1 / 2021 – Article 4, pp. 53-68

The digital calliper was used to determine Length and Width with a normal-line function in the
calliper. Normal and parallel lines and lengths were accurately placed and read once calibrated
and the positions of W, L and T are determined, though the work is quite time consuming. The
proportions are always in the order of L>W>T and represent the smallest hypothetical box a
particle can fit into. Approximate aggregate content of the particles was also quantified and
qualitative assessment of fracture (ITZ, in aggregate, in paste) made, see Figure 4.

                                                                   L

                                                                   T

                                               W

Figure 4 – Digital calliper measurement of Length, Width and Thickness on 8.72 mm Long, 6.73
mm Wide and 1.19 mm Thick particle scaled off in the salt frost test showing fracture in the ITZ
between paste and aggregate particle

2.4          2D Image analysis to verify the LWT measurements

Measurements were repeated in 2D with an Image Analysis software [30] to verify the manual
measurements done with the optical microscope. The number of particles per fraction varied
depending on how much was sieved for the different fractions: from max 93 to 10. The particles
were placed on a white surface with a ruler for calibration and with good lightning without
touching each other or overlapping and photo taken. Then each selection of fragments was
weighed. The images were then imported for image analysis of L and W in 2D. The sizes of the
images were calibrated, and colour threshold determined to locate and analyze Length, Width,
area, and number of fragments. Finally, average Thickness was calculated from mass, assumed
density and area in the L-W plane recorded with the image analysis software.

                                                60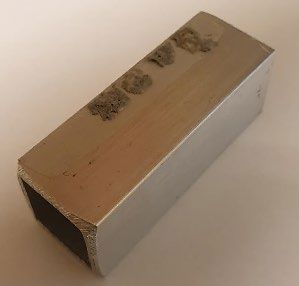
Nordic Concrete Research – Publ. No. NCR 64 – ISSUE 1 / 2021 – Article 4, pp. 53-68

3.            RESULTS AND DISCUSSION

3.1           Thickness vs particle size

Absolute thickness
Figure 5 a)-f) shows that absolute Thickness, T (mm) is an increasing function of particle size for
all data from all tests in both 3 % NaCl and water. Particle size has been plotted as average size
(L+W)/2. Hence Figure 5 shows the results of all T, L and W measurements. The retaining sieves
of the particles are indicated with legends whereas the type of concrete is indicated by the colour
of the legend. Plots of relative thickness, 2T/(L+W), against the sieve size that the particles were
retained on are shown in Figure 6.

 a)                                             b)

c)                                              d)

e)                                                f)

Figure 5 – Thickness T (mm) vs particle size (L+W)/2 (mm), a) and b) Salt frost test 040-33A
(air) and 040-330 (no air), c) -f) Rapid freeze/thaw in water on c) 040-33A (air) and d) 040-
330 (no air), e) 293-33A (air) and f) 293-330 (no air)
                                                61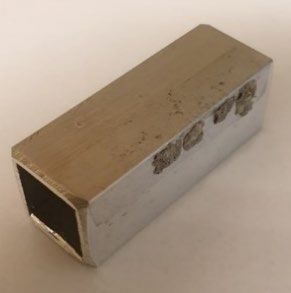
Nordic Concrete Research – Publ. No. NCR 64 – ISSUE 1 / 2021 – Article 4, pp. 53-68

Figure 5 shows, in addition to that thickness depends on size, that the size dependant thickness
varies somewhat with test method, concrete quality and degree of damage. There are, however,
similarities between very different concretes and tests, like between Figure 5a) - d) and between
5b), c) and e). For Figure 5a) - d), the non-air entrained 040-330 had severe internal damage at
only 23 cycles and severe salt scaling at 56 cy, see Table 2. Figure 5b) shows more large particles
at large damage at 56 cycles (grey points). For Figure 5 b), c) and e) there are also similarities
between the very different concretes and tests.

Figure 5 c) – f) shows that there is sometimes a tendency for large particles to come off more at
high number of cycles for the concretes exposed to rapid freeze/thaw in water. The grey points
(highest number of cycles) for the larger particles in Figures 5 c)-f) seem in fact to be more
common for the two air entrained concretes in Figure 5 c) and e). This is different from the salt
frost test where most coarse particles scale at high number of cycles for the non-air entrained
concrete, see Figures 5 a) and b). Large particles from the moulded surfaces in the ASTM C666
test are presumably “pop-outs”, maybe at air voids that become filled near the surface.

Looking back at Figure 1 – lower right corner, the coarser fraction of particles from 42-56 cy of
salt frost testing of the non-air entrained 040-330 consists practically of only coarse aggregate.
This is in line with the results of particle aggregate content registration made during shape
registration. This can also be seen from Figure 1 – centre, showing little/no aggregate content in
the coarser fractions of the concrete 040-330 with low damage from 0-5 cy of salt frost testing.

There is less difference in scaling between the air entrained and the non-air entrained concrete
during rapid freeze/thaw in water compared to in the salt scaling test, see Table 2. The lower
protective effect of air entrainment against scaling in water is interesting since the same air voids
are protecting so efficiently against both internal damage in rapid freeze/thaw and against salt
frost scaling. It points, again, to that the scaling in fresh water is caused by a different mechanism
than scaling in 3 % salt.

Closer inspection of the surfaces of the larger scaled-off particles in the salt scaling test like the
one shown in Figure 4 revealed that fracture in the ITZ is sometimes seen on the horizontal,
surface parallel to the exposed completely flat, sawn surface. This was, however, no rule as the
scaled particles were sometimes fractured through both paste and aggregate, possibly
predominantly for fractures occurring perpendicularly to the sawn surface.

Due to the large span of observed thicknesses seen in Figure 5 a)-f) it is hard to compare them
directly to the model predictions. Fagerlund’s concrete material dependant model [28] predicts ≈
0.75 mm critical thickness and Valenza and Scherer’s ice thickness dependant glue-spall model
[19] predicts maximum ≈ 2.5 mm thick spalling. To narrow the comparison, we can as a first
rough approximation assume that both models are more valid at early cycling (0-7 cy in salt frost,
0-30 in freeze/thaw in water (blue and yellow legends)). At this early cycling there is less
volumetric damage in the body of the concrete specimens compared to after higher number of
cycles. This means we should look at the air entrained concretes (Figure 5 a), c) and e)) and at
early cycling of Figure 5 b), d) and f). Then we see that the particles from air entrained specimens
have mostly Thickness < 0.75 mm and, of course, Thickness < than the max 2.5 mm. If we include
non-air entrained specimens then only the aggregate particles that came off at high number of
cycles have Thickness ≥ 2.5 mm, mostly due to the aggregate particles in the salt frost test.

For the smallest particles in both tests a large portion are in the size-range reported by Liu, Kang
and Hansen [26] of 0.1 – 0.3 mm. However, due to the wide size distribution seen even at early
                                                 62
Nordic Concrete Research – Publ. No. NCR 64 – ISSUE 1 / 2021 – Article 4, pp. 53-68
cycling we cannot say that a specific range of thickness predominates. We will therefore have a
look at size distributions in Figure 7.
Relative thickness
Figure 6 shows relative thickness calculated as 2T/(L+W) based on all the data in figure 5. Size
has now been plotted as actual square grid opening sieve size.
a) b)
c) d)
e) f)
Figure 6 –Relative thickness = 2T/(L+W) based on all data in Figure 5 and plotted for actual
sieve size, a) and b) Salt frost test 040-33A (air) and 040-330 (no air), c) -f) Rapid freeze/thaw
in water on c) 040-33A and d) 040-330 (Air, no air), e) 293-33A and f) 293-330 (Air,no air)
From Figures 6 a) and b) there is a tendency in the first cycles of the salt frost test that relative
thickness reduces at increasing size and that the particles become relatively thicker at higher
number of cycles. Particularly Figure 6b) shows that the non-air entrained 040-330 with very high
damage after 56 cycles has the least flaky shape of all the large aggregate particles that came off,
63Nordic Concrete Research – Publ. No. NCR 64 – ISSUE 1 / 2021 – Article 4, pp. 53-68
again see also Figure 1, centre and lower right corner. Figures 6 c) and d) show that the two
concretes with the same binder (040-33A and 040-330) have similar development of shape during
freeze/thaw whether air entrained or not. Figures 6 e) and f) show higher relative thickness for the
high strength concrete at larger sizes but also partly higher scatter than the other measurements.
Possibly all the results of the two 040-33 concretes can be interpreted as less volumetric damage
and a situation with a sort of “pure surface attack” at early cycling. As pointed to already, it is
interesting that the features of the plots in Figure 6 are so similar despite the different types of
concrete, specimens, surfaces and freeze/thaw exposure and more research work on this is needed.
3.2 Particle size distribution
Figures 7 a) – c) show particle size distributions of the scaled-off particles. Figure 7 a) shows that
for the salt scaling test there is a clear peak in the distribution with ≈55-85 % of particles in the
size range 0.5-4 mm and ≈10-30 % < 0.5mm and > 4mm for both tested material qualities and
number of cycles. There is a peak frequency of two of the four fractions 1-2 mm whereas 040-
330 56 cy peaks for 0.5-1 mm and 040-330 5 cy peaks for 2-4 mm. Figures 7 b) and c), on the
other hand, show that in the freeze/thaw test in pure water there is a much more even distribution
of the different sizes for all four concrete qualities.
a)
b) c)
Figure 7 – Particle size distributions a) Salt Scaling 040-33, b) Freeze/thaw in water 040-33,
c) Freeze/thaw in water 0293-33, individual specimens
Figure 7 is pointing to at least two clear differences between the two types of test. Firstly, the high
amount of fine material in freeze/thaw in water seen in Figures 7 b) and c) from the paste rich
moulded surfaces in the rapid freeze/thaw test. Plotting the individual specimens of 0293-33 both
with and without air voids as seen in Figure 7 c) shows the same tendency as the average values
of the 040-33 specimens in Figure 7 b). Compared to the discussion about similar shape vs size
64Nordic Concrete Research – Publ. No. NCR 64 – ISSUE 1 / 2021 – Article 4, pp. 53-68
relations of Figure 5a) vs 5d) and 5b) vs 5c vs 5f) above one often also gets more large particles
at higher cycles. The registration of fraction of aggregate in the scaled material showed that there
was higher aggregate content in the scaled material from the salt scaling test than in the
freeze/thaw in water, particularly at high number of cycles, which is expected due to the sawn
surfaces. The number of coarse particles was hence moderate remembering that the volume and
hence mass of the particles increases approximately as function of their size to the third power.
Figure 7 gives however no reason to think that the material was more fragmented into smaller
pieces after high number of cycles (56 or 160) as compared to after low number of cycles (7 or
30). That is: subdivision of particles did not increase neither by cracking before they scaled off,
nor by subdivision after scaling off during the prolonged freeze/thaw in the two methods.
Secondly, the peak in the distribution of Figure 7 a) at 1-2 mm or 0.5-4 mm and the thickness
ratio from Figure 6 mostly in the range 0.15 – 0.5 shows larger and flakier particles from the sawn
surfaces in the salt scaling test. Further studies of the Thickness (absolute and ratio) and particle
size distribution of scaled particles should therefore be done after freeze/thaw exposure with water
and salt and with different thickness of the liquid-/ice layers. This may clarify the reason for
scaling compared to Valenza and Scherers prediction of a maximum thickness of ¾ of the ice
layer vs Fagerlunds prediction of a material dependant critical scaled particle thickness depending
on the critical air void spacing of the material.
3.3 IMA vs Digital microscope
Figure 8 shows the correlation between measurements by image analysis and manually with
digital microscope and digital calliper. The figure shows satisfactory correlation, particularly
since training sessions were few due to limited number of free downloading of the software.
Figure 8 – Correlation between L, W and T measured by Image Analysis (IMA) and manually by
Digital Microscope and digital calliper, T calculated from area measured in L-W plane on IMA,
mass and assumed density
The very good correlation and correct size prediction for Length and Width are encouraging
whereas the good precision but systematic calculation of too low Thickness is not surprising. The
peak Thickness measured on the profile seen in the lower part of Figure 4 has in the calculated
Thickness been replaced with an average thickness that will of course always be lower than the
peak Thickness, varying somewhat depending on their topography (and density). Both the area in
the L-W plane and the particle mass are determined accurately by image analysis and the precise
balance. Still variable profiles will always have higher peak Thickness. In addition, aggregate
65Nordic Concrete Research – Publ. No. NCR 64 – ISSUE 1 / 2021 – Article 4, pp. 53-68
content, and relative densities (around 2 for paste and around 2.7 for aggregate) will vary
somewhat.
4. CONCLUSIONS
Measurements of particle shape (Thickness T, Length L, Width W) and particle size distribution
on scaled material from four different concrete qualities (w/b = 0.40 and 0.29 with and without
air entrainment) exposed to two different freeze thaw tests (salt frost and rapid freeze thaw in
water) showed:
Absolute T (mm) is an increasing function of particle size rather than dominated by one size.
In general, the size-dependant Thicknesses are similar for very different concrete qualities and
frost test methods.
2T/(L+W) is reducing as function of particle size and is lowest for the largest particles of the salt
scaling test, ≈ 0.1 – 0.15 before aggregate particles start to come off in the non-air entrained
concrete which scaled the most. If large aggregate particles come off, they dominate the shape
with larger Thickness of larger scaled material.
For freeze/thaw in water amount of scaling is not so efficiently reduced by air voids despite
protecting efficiently against internal damage in fresh water and scaling in salt frost testing.
Particle size distributions in the salt scaling test have a clear peak for particles of 1-2 mm size for
all 4 concretes, whereas in rapid freeze/thaw in water a rather even distribution of particle sizes is
created without any peak size.
The particles from the freeze/thaw in water are more variable both in size and shape no matter
type of concrete or degree of damage.
Comparison with the theoretical concrete flake Thicknesses predicted by the glue spall model
(≈3/4 x ice thickness) and the air void dependent concrete flake thickness (≈3x critical air void
spacing factor) are difficult due to the observed size dependency of concrete flake Thickness.
Further studies of concrete flake Thickness at varying thickness of ice layers are proposed.
Image Analysis of Length and Width with a commercial software on selected series (> 100
particles) showed good correlation to measurements with digital microscope and -calipers and
also gave correct prediction. Calculated average Thickness from scanned particle area, mass and
density also correlated well to measured Thickness but was systematically too low as expected
due to the variable topography of the particle surfaces.
5. REFERENCES
1. Shpak A & Jacobsen S: “Requirements and recommendations for frost durable concrete.
Test methods. Overview of national and international standards, codes, committees,
representative projects”, DACS Report 06, NTNU and SINTEF, Trondheim, Norway.
ISBN 978-82-7482-116-3, 2019, 59 pp.
66Nordic Concrete Research – Publ. No. NCR 64 – ISSUE 1 / 2021 – Article 4, pp. 53-68
2. NS-EN 206 “Concrete: specification, performance, production and conformity”, NS-EN
206:2013+NA:2014 (NO) National annex NA (informative), 111 pp.
3. Zhou Y, Cohen M D & Dolch W: “Effect of External Loads on the Frost-Resistant
Properties of Mortar with and Without Silica Fume”, ACI Mat .J., Vol. 91 No.6. 1994, pp.
595-601.
4. Jacobsen S & Scherer G W: “Freezing induced stresses in concrete-steel composite beams
and effect of air voids.” I: Proceedings of the International RILEM Conference Materials,
Systems and Structures in Civil Engineering 2016 Segment on Frost Action in Concrete.
Rilem publications, ISBN 978-2-35158-182-7. 2016, pp. 71-80.
5. FprCEN-TS 12390-9: 2015 “Testing hardened concrete - Part 9: Freeze-thaw resistance –
Scaling”, 30 pp.
6. ASTM C666 Proc A, ASTM C666/C666M-15 “Standard Test Method for Resistance of
Concrete to Rapid Freezing and Thawing”, ASTM International, West Conshohocken, PA,
2015.
7. GOST 10060-2012 “Freeze-thaw resistance”. 2012. (In Russian).
8. Verbeck G., Klieger P. (1956) "Studies of salt scaling of concrete", Highway Research
Board Bulletin No. 150 / Res. & Dev. Lab of the PCA Bulletin 83, 1956, 13 pp.
9. Pigeon M : « Microstructure et resistance au gel des ciments et betons», Thése de Docteur-
Ingenieur, Université Pierre et Marie Curie, 1984, (In French) 311 p.
10. Gagné R : «Durabilité au gel des bétons à hautes performances», Ph.D.Thesis Université
Laval, 1992, 433 pp. (In French).
11. Shpak A: “Production and documentation of frost durable high-volume fly ash concrete: air
entrainment, cracking and scaling in performance testing”, PhD Thesis 2020:366 NTNU,
Department of Structural Engineering, Trondheim, Norway, 2020, 268 pp.
12. Janssen D J & Snyder M B: “Mass loss experience with ASTM C666: with and without
deicing salt”, Proceedings. The International Workshop on Freeze-Thaw and Deicing Salt
Scaling Resistance of Concrete, Université Laval - CRIB, Québec, Canada, 1993, pp.137-
151.
13. Rosenquist M: ”Frost-induced deterioration of concrete in hydraulic structures: Interactions
between water absorption, leaching and frost action”. Ph.D. thesis, Faculty
of Engineering, LTH at Lund University, Lund, Sweden, 2016.
14. Sellevold E J & Farstad T: “Frost/salt testing of concrete: effect of test parameters and
concrete moisture history”. Nordic Concrete Research, Publ. No. 10, 1991, pp. 121-138
15. Marchand J: «Contribution à l'etude de la détérioration par ecaillage du beton». PhD-thesis,
École Nationale des Ponts et Chaussées, France, 1993, 326 pp. (In French).
16. Lindmark S: “Mechanisms of Salt Frost Scaling of Portland Cement Bound materials”, PhD
thesis (Report TVBM 1017), LTH at Lund University, LTH at Lund University, Lund,
Sweden, 1998, 266 pp.
17. Tange Hasholt M: “Salt Frost Scaling – interaction of transport mechanisms and ice
formation in concrete”, PhD Thesis, Danish Technological Institute, Aalborg University,
Aalborg, Denmark, 2002.
18. Copuroglu O & Schlangen E: “Modeling frost salt scaling”, Cement and Concrete Research,
Vol. 38, 2008, pp. 27-39.
19. Valenza J & Scherer G: “Mechanism for Salt Scaling”. J. Am Cer Soc., Vol. 89, 2006, pp.
1161-1179.
20. Sun Z & Scherer G: “Effect of Air Voids on Salt Scaling”, Cement and Concrete Research,
Vol. 40, 2010, pp. 260-270,
21. Tremblay M-H, Lory F, Marchand J, Scherer G W & Valenza J J: “Ability of the Glue-Spall
Model to Account for the De-Icer Salt Scaling Deterioration of Concrete”, Paper W4-07.3
67Nordic Concrete Research – Publ. No. NCR 64 – ISSUE 1 / 2021 – Article 4, pp. 53-68
Proceedings. 12th ICCC, (eds J.J.Beaudoin, J.M.Makar, L.Raki; National Research Council
of Canada, Montreal, Canada) ISBN 978-0-660-19695-4, 2007, 12 pp
22. Mueller Matthias & Ludwig H-M: “Salt Frost Scaling – effect of glue spalling”,
Proceedings. Concrete 2017- 28th Biennial Conference of the Concrete Institute of
Australia-3rd International Congress on Durability of Concrete (ICDC), 3017, 10 pp.
23. Fagerlund G: “Studies of the destruction mechanism at freezing of porous materials”.
Proceedings, 6th international congress on problems raised by frost action. Le Havre,
France, April 23-25, 1975. (Report 1:76, Swedish Cement and Concrete Research Inst.,
Stockholm, Sweden), 28 pp.
24. Jacobsen S & Sellevold E J: “Frost/salt scaling testing of concrete - importance of
absorption during test”, Nordic Concrete Research, Vol. 14, No. 1/1994, 1994, pp. 26-44.
25. Jacobsen S & Sæther D H & Sellevold E J: “Frost testing of high strength concrete:
frost/salt scaling at different cooling rates”. Materials and Structures, Vol. 30, 1997, pp.
33-42
26. Liu Z, Kang Y & Hansen W: “Cryogenic suction pump: a major mechanism of salt frost
deterioration”, Proceedings – Understanding the fundamental properties of concrete,
Celebrating Prof. Erik J Sellevolds 75th birthday, Trondheim April 25-26, 2012. (Mindess
S & Hornbostel K, Editors). ISBN 82-7482-101-7, 2013, pp. 103-118
27. Liu Z & Hansen W: “Freezing characteristics of air-entrained concrete in the presence of
deicing salt”, Cement and Concrete Research, Vpl. 74, 2015, pp. 10-18.
28. Fagerlund G: “Principles for concrete frost durability”. Nordisk betong, No. 2-1981, 1981,
pp. 5 – 13. (In Swedish with English summary).
29. Matthias Mueller. Personal communication, 18th of June 2019.
30. www.mediacy.com/imageproplus
ACKNOWLEDGEMENT
This paper is based on the MSc thesis by Marte B Brun «Thickness measurements of Scaled Fly
Ash Concrete particles from Frost Testing methods ASTM C666 and CENTS12390-9: Critical
thickness in pure water and 3% salt solution» NTNU Dept of Structural Engineering June 2020.
The research reported here forms part of the DACS project (Durable Advanced Concrete
Solutions). The DACS partners are Kværner AS (project owner), Mapei AS, Multiconsult AS,
NorBetong AS, NPRA (Statens vegvesen), the Norwegian University of Science and
Technology (NTNU), and SINTEF Byggforsk. The project gratefully acknowledges the
financial support of the Norwegian Research Council contract no. 245645.
68You can also read