Thames Water Revised Draft Water Resources Management Plan 2019 - Technical Appendices Appendix J: Outage
←
→
Page content transcription
If your browser does not render page correctly, please read the page content below
Thames Water
Revised Draft Water Resources
   Management Plan 2019

     Technical Appendices

      Appendix J: Outage
Revised draft Water Resources Management Plan 2019
Appendix J: Outage – October 2018
Table of contents
A. Introduction 1
B. Outage definition and methodology 2
Definition of outage ..................................................................................................................... 2
Definition of Outage Allowance ................................................................................................... 2
Background to outage methodology ........................................................................................... 3
When to assess outage uncertainty ............................................................................................ 3
Actual Outage.............................................................................................................................. 4
C. Outage Allowance 4
Outage Allowance methodology ................................................................................................. 4
Principles of the approach ........................................................................................................... 6
D. Our approach to Outage Allowance 8
Outage records............................................................................................................................ 8
Modelling Outage Allowance ....................................................................................................... 9
Interpretation of risk .................................................................................................................. 12
Base year Outage Allowance .................................................................................................... 14
Figures
Figure J-1: Overview of outage methodology ......................................................................................... 5
Figure J-2: Example of outage probability distributions .......................................................................... 7
Figure J-3: Summing outage issues ....................................................................................................... 8
Figure J-4: Annual review 2017+ Outage Allowance and Actual Outage ............................................. 13
Tables
Table J-1: Recording outages for London ............................................................................................... 9
Table J-2: Outage for the critical month – example 2 ........................................................................... 11
Table J-3: Outage for the critical month – example 3 ........................................................................... 11
Table J-4: Outage for the critical month – example 4 ........................................................................... 11
Table J-5: Outage Allowance using different length of records ............................................................ 12
Table J-6: Outage Allowance by WRZ .................................................................................................. 14
Table J-7: Outage assessment Annual review 2017+ .......................................................................... 17
Table J-8: London sources with outage of lengthy duration ................................................................. 18
Table J-9: Thames Valley sources with outage of lengthy duration ..................................................... 19Revised draft Water Resources Management Plan 2019
Appendix J: Outage – October 2018
Appendix J.
Outage
In response to feedback as part of the public consultation on the draft Water Resources
Management Plan 2019 (WRMP19) and new information, the following changes to Appendix J
have been made:
Additional information provided on changes to the period of record used and its impact on
outage, use of residual outages, outage throughout the planning period, the reason for
annual average being the same as critical period, consideration of longer outages >90 days
and options to reduce outage.
In addition there have been further changes to this section including:
AR17 2016/17 figures for Outage Allowance updated between draft and revised draft
WRMP19 with the best available information; these figures are referred to as AR17+ figures
and compared to AR18 figures.
A. Introduction
J.1 This section of our revised draft WRMP19 describes how the temporary loss of resources is
allowed for in the supply demand balance. Known as the “Outage Allowance” or more
commonly as “outage”, the methodology of how this is calculated is explained and the
baseline figure is presented
J.2 Outage Allowance is defined and the methodology explained
J.3 This appendix is structured as follows:
The definition of outage is presented
The background to the methodology and when to assess outage uncertainty is
explained
The Outage Allowance methodology is explained together with the principles of the
approach
We describe how we approach Outage Allowance assessments
With the aid of examples the potential variance in outages is explained
The interpretation of risk is discussed
The base year outage figures are presented
1Revised draft Water Resources Management Plan 2019
Appendix J: Outage – October 2018
B. Outage definition and methodology
Definition of outage
J.4 Outage is a temporary short-term loss in supply known as Deployable Output (DO - see
Appendix I: Deployable Output). For the purposes of producing our revised draft WRMP19,
we’ve examined the updated guidance, including Section 4.10 of the Final Water Resources
1
Planning Guideline (WRPG) and further Environment Agency WRPG supporting documents
2
on outage from July 2016 . We have also used the UKWIR reports Outage Allowances for
3 4
Water Resources Planning and WRMP 2019 Methods – Risk Based Planning , the latter
stating that the 1995 methodology remains acceptable.
J.5 Note the Environment Agency’s 2018 WRPG states that an outage is temporary in the sense
that it is retrievable, and therefore the DO lost can be recovered. The period of time for
recovery is subject to audit and agreement. If an outage lasts longer than three months,
analysis of the cause of the problem would be required in order to determine the legitimacy of
the outage. The 2018 WRPG indicates that a water company must determine if it will
incorporate an “Outage Allowance” within its WRMP. It also states that the Outage Allowance
that a company can use within its WRMP can be developed by following the principles within
the Outage Allowances for Water Resources Planning Report.
Definition of Outage Allowance
J.6 We need to incorporate an Outage Allowance in our water supply demand planning in order to
account for the planned and unplanned loss of water resources over the plan period. The
allowable outage collectively describes the combined risks of the legitimate unplanned and
legitimate planned outages. The Outage Allowance being the value of allowable outage
expressed in mega litres per day (Ml/d). In responding to Environment Agency comments
raised in the consultation on our draft WRMP19 regarding the nature of outages, our outage
reporting has not focussed on distinguishing between planned and unplanned outages. As a
result it is not possible to use this data to determine with confidence the proportions of
unplanned and planned outage. It was, however, possible to retrospectively make a
distinction between actual planned and unplanned outage for 2017/18. This shows that the
Actual Outages are predominantly unplanned, with just over 15% of the outage impact on DO
being planned. It is important to note that this approximately 85:15 split between unplanned
and planned outages is dominated by the London water resource zone (WRZ); and in
2017/18, the Actual Outage volume was influenced significantly by the outages of the
Gateway water treatment works (WTW) resulting from poor water quality and failures related
to asset malfunctions. Accordingly, this split between unplanned and planned outages is
unlikely to be representative of the long term record.
1
Environment Agency and Natural Resources Wales and also produced in collaboration with Defra, the Welsh
Government, and Ofwat, Final Water Resources Planning Guideline, April 2017July 2018
2
Environment Agency, WRMP19 methods: Outage Allowance, July 2016
3
UKWIR, Outage Allowances for Water Resources Planning, 1995
4
UKWIR, WRMP 2019 Methods – Risk Based Planning, May 2016
2Revised draft Water Resources Management Plan 2019
Appendix J: Outage – October 2018
Background to outage methodology
J.7 Prior to AMP4 we commissioned consultants to assess industry best practice and develop an
outage assessment methodology based upon the UKWIR approach. Their review identified
several shortcomings in the earlier methodology and how these could be overcome. The
resulting methodology to overcome these shortcomings follows the philosophy behind the
UKWIR report referenced by the Environment Agency. It is built around commercially
available risk analysis software (@Risk) and it is compatible with the updated methodologies
developed by UKWIR for other elements of the supply demand balance. In particular, it is
compatible with the headroom methodology outlined in Appendix V: Risk and uncertainty
except that it is run on a monthly rather than annual time period.
J.8 The methodology is a pragmatic but conceptually robust method of quantifying the
uncertainties in the supply demand balance. The methodology:
Carries out a full analysis of outage uncertainty in the supply demand balance, giving
a range of outputs across the planning period with probabilities and confidence limits
Is sufficiently robust, in conjunction with a wider economic framework, to justify
significant investment decisions in new resources or demand management
programmes
Provides a reliable measure of outage uncertainty that is not constrained within
particular limits by the methodology itself
Enables the uncertainty associated with rare but high consequence events to be
evaluated, such as the complete loss of a source due to an infrequent flooding
incident
J.9 In common with the headroom methodology, it does not provide a fixed Outage Allowance.
Instead, it provides a range of numbers with probabilities and these must be interpreted in
conjunction with the other components of the supply demand balance and assessed against a
level of risk that is acceptable to the water company and its regulators.
When to assess outage uncertainty
J.10 In general the outage uncertainty is not expected to vary over the planning period, unless
issues such as maintenance are identified as either commencing or being resolved at different
stages in the planning period, or if a current outage issue is resolved, such as a pump
replacement which enables the full DO of the site to be abstracted.
J.11 If the outage is likely to vary, and it is predicted that some action will be taken to remove the
risk of a particular outage occurring, then further assessments can be carried out to determine
the impact of removing an outage issue on outage uncertainty.
J.12 In some instances it may not be necessary to carry out a complete and detailed analysis of
outage uncertainty. In the situation where DO exceeds demand by at least 25% (the same
percentage as in the headroom methodology) then an alternative, simpler methodology can
be implemented. An example could be either a blanket estimation (sayRevised draft Water Resources Management Plan 2019
Appendix J: Outage – October 2018
J.13 In most cases, outage uncertainty should be assessed each month during the critical years of
the planning period in order to identify the critical month when outage uncertainty is greatest.
As a result, 'residual outages' could be considered to exist outside the ‘critical month’ but they
do not contribute to the Outage Allowance unless the month they occur in later becomes the
'critical month'. As the existing outage methodology is conservative, insofar as the 'worst'
month for outage is selected to reflect the Outage Allowance for each WRZ, exclusion of any
‘residual outages’ would not underestimate outage.
Actual Outage
J.14 A requirement of the annual regulatory submissions is to report on “Actual Outage”. As there
is no formal definition of “Actual Outage” from regulators or the Water Industry, we have
derived a means by which Actual Outage is measured.
J.15 Actual Outage is the temporary loss of DO in the reporting year weighted by the duration of
the loss (in days).
Example: a source DO loss of 10 Ml/d lasts 45 days thus
Weighted outage = 10 * (45 / 365) = 1.23 Ml/d
J.16 Each weighted outage is then summed over the reporting year to give a total Actual Outage
for the WRZ. This measurement of outage is fundamentally different to the Outage Allowance
which is based on risk.
C. Outage Allowance
Outage Allowance methodology
J.17 The methodology starts with an optional screening process to identify whether DO in the
resource zone is at least 25% greater than demand. This percentage is the same as that
applied to the filter in the headroom methodology. This screening process will determine
whether a probabilistic analysis of outage uncertainty is appropriate. A simpler method could
be applied if there is evidence that any failures are unlikely to affect supply or the DO. An
example of this more simplistic assessment of outage may be a fixed percentage allowance
for the resource zone. However, even if there is a significant resource surplus, a full outage
assessment may be advisable to provide the level of understanding required within the
resource zone.
4Revised draft Water Resources Management Plan 2019
Appendix J: Outage – October 2018
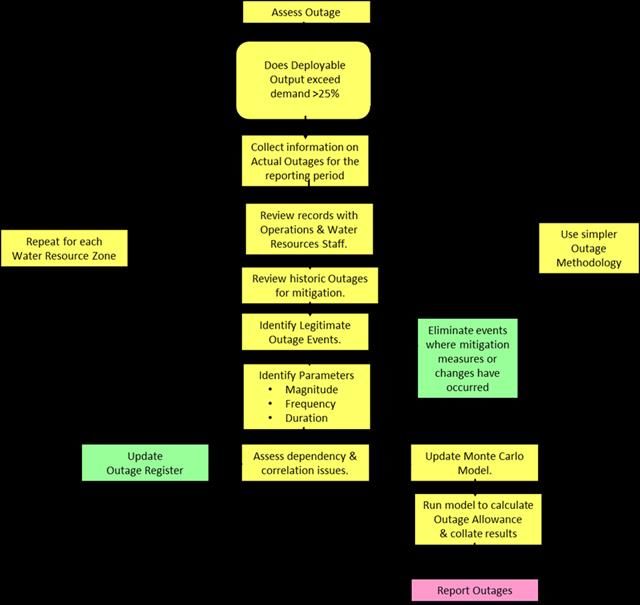
Figure J-1: Overview of outage methodology
J.18 Having decided to apply the methodology the first stage is to identify, by WRZ, any historical
failures of supply. Interviews with relevant staff and interrogation of operational data systems
have been used to collect this failure information. Failures generally fall within the following
categories:
power failure (mains or standby)
algae
flooding
turbidity
pollution of source
system failure
raw water transmission
treatment
delivery through service reservoirs and treated water pumping
Supervisory Control and Data Acquisition (SCADA) failures
statutory Inspections
engineering upgrades
5Revised draft Water Resources Management Plan 2019
Appendix J: Outage – October 2018
J.19 A failure to supply, due to the incidence of one of the categories above, may not always be
classified as a legitimate outage, and further assessment is required to identify which of these
failures are legitimate outages.
J.20 In order to assess which of these failures are legitimate outages under the methodology, the
mitigation measures that would be employed, should the failure occur, have been reviewed.
This provides a means of addressing whether other resources can cover a failure causing an
outage event and whether the resources used can be replaced within a short (seven day)
period without impacting on the DO. If this is the case or the failure is for less than 24 hours,
then it is not considered as a legitimate outage.
J.21 Once the legitimate outage events have been identified, then the outage issues data can be
recorded. The information recorded covers the frequency, magnitude and duration of the
events. In general, the outage events will be independent of one another, but sometimes one
event will be the result of another, therefore they may be correlated or interdependent ,or they
may be mutually exclusive (i.e. one or the other will apply at any one time, but not both).
Listing this information effectively in the outage issues log helps define the problem to be
assessed.
J.22 This process is repeated for each of the WRZs within the region.
J.23 A Monte Carlo model has been constructed in @Risk to combine the estimates of frequency,
duration and magnitude for each of the events to determine the overall distribution of
legitimate outage. The outage model sets out a series of spreadsheets in a way that is
auditable and easily combined to calculate this distribution. Each outage component in the
model is cross-referenced to the outage issues register so that the origin of the data is clear.
J.24 The Monte Carlo model is run to derive the distribution of legitimate outage and the output is
presented in tabular and graphical form. The outage model has established formats for the
graphical and tabular output.
Principles of the approach
J.25 This methodology requires the uncertainty surrounding the frequency, magnitude and duration
of each outage issue to be defined as a probability distribution. All the issues are then
combined using Monte Carlo simulation to give an overall outage uncertainty.
J.26 First of all, each outage issue is broken down into three probability distributions. This might
take the form of a triangular distribution (or a fixed value) for frequency, a triangular or
discrete distribution for magnitude, and a triangular distribution for duration that best fits the
available data. An example is given in Figure J-2. The basis for defining these probability
distributions is described in subsequent sections.
J.27 Outage events are summed for each month to determine the overall outage uncertainty for
the WRZ. This is shown in Figure J-3.
J.28 An inherent assumption in this methodology is that the outage issues are independent.
Generally this is the case, but some can be inter-related. Two issues may affect the same
source but only result in one outage. In this instance it is necessary to modify the Monte
Carlo analysis to allow for these inter-relationships.
6Revised draft Water Resources Management Plan 2019
Appendix J: Outage – October 2018
J.29 A number of software packages are available for performing Monte Carlo analysis. This
methodology has been developed using @RISK, which operates within a spreadsheet
environment. When a Monte Carlo simulation is run, it randomly selects numbers from each
probability distribution assigned to each outage component. Each set of random numbers
effectively simulates a single ‘what-if’ scenario for the spreadsheet model. As the simulation
runs, the model is recalculated for each scenario and the results are presented as a series of
forecast charts for outage uncertainty. The simulation stops according to criteria set by the
user, which is normally a number of scenarios or trials. The number of trials must be set to
give an acceptable mean standard error for the simulation results, whilst controlling the
processing time to workable limits. A typical number of trials might be 1,000 to 5,000. If the
mean standard error is too high, then it will be impossible to obtain repeatable results for the
same set of data. We use 4,000 iterations determined by sensitivity analysis.
Figure J-2: Example of outage probability distributions
7Revised draft Water Resources Management Plan 2019
Appendix J: Outage – October 2018
Figure J-3: Summing outage issues
D. Our approach to Outage Allowance
Outage records
J.30 A schedule of potential outages is provided by Operations for each WRZ for each fiscal year.
The details of each outage event are recorded in terms of the nature of the event, when it
occurred, for how long and the impact on DO. Table J-1 is an example from the reporting year
2016/17 of outage records available and includes:
source name
outage issue
source DO and impact on DO
start and end date of the outage issue
J.31 There may be a total loss or a partial loss of DO depending on the nature of the outage; e.g.
the loss of a borehole pump may mean just a partial reduction as water can be put into supply
from other boreholes on site. The impact on DO is assessed from the nature of the outage
event.
J.32 With regard to potential outages at the London major WTWs a record is made in just the
same way, however, the impact of these WTWs outages on London’s DO is assessed by
modelling the reduced output capabilities using the Water Resources Management System
(WARMS2) and noting the impact (if any) on the DO.
8Revised draft Water Resources Management Plan 2019
Appendix J: Outage – October 2018
J.33 Each record of potential outages is assessed to see if this is a legitimate outage that can be
included in Outage Allowance. These are then assessed to see that they last longer than 24
hours and if during a drought event mitigation measures could be taken to ensure availability
of water going into supply. If, for example, engineering work is planned to be undertaken,
could this be postponed until a more suitable time with regard to the maintenance of DO?
J.34 The Actual Outage is calculated from the loss in DO weighted by the duration of the outage.
For the Broadmead example in Table J-1 this is 6.8 * 92 / 365 = 1.71 Ml/d.
Table J-1: Recording outages for London
Total Output
Outage Deployable Actual
Lee Valley Reason Outage no. of capacity
start output Outage
WRZ for outage end date days reduced
date (Ml/d) (Ml/d)
outage to Ml/d
Operational
Barrow Hill 01/04/16 31/03/17 365 0 1.72 1.72
issues
Broadmead Pump failure 01/06/16 31/08/16 92 0 6.80 1.71
ELReD (East Treatment
13/05/16 15/05/16 3 0 13.20 0.11
Ham) issues
Wanstead Pump failure 02/01/17 08/01/17 7 0 5.38 0.10
Treatment
Wanstead 21/11/16 30/11/16 10 0 5.38 0.15
issues
Total 3.79
Modelling Outage Allowance
J.35 Once a probability distribution for each of the risks around magnitude, duration and frequency
has been decided, then the outage model requires the probability distribution parameters to
be input to the model for each outage issue identified.
J.36 For each outage accepted as legitimate the input to the model includes:
A unique outage issue reference number
If event frequency is included in the analysis, the number of events per year and the
distribution type
Minimum, most likely and maximum magnitude of the outage issue, including
distribution type
Minimum, most likely and maximum duration of the outage issue, including
distribution type if appropriate
Any specific comments relating to the outage issue
J.37 The following examples have been compiled to assist the understanding of how an Outage
Allowance is calculated using the outage model. To simplify matters single values have been
used for magnitude, frequency and duration although often these would be the parameters of
the assigned probability distributions e.g. min, max and most likely of a triangular distribution.
J.38 Example 1: Assume that a small source has been out of supply due to a treatment problem
and it is the first time this has happened in ten years (NYRS).
9Revised draft Water Resources Management Plan 2019
Appendix J: Outage – October 2018
The magnitude (m) is the loss of DO which is its total DO of 5 Ml/d and a fixed
distribution is used as there has been only one incident by which to define magnitude
The duration (d) of the event is 15 days and impacts on one month of the year,
which has to be reflected in the frequency. Only one figure is available from the
information sourced for event frequency, so it is not plausible to apply any
distributions. Therefore a single value is used in event frequency
The frequency (f) should reflect the likely chance of occurrence of a given outage in
any one year, and is not simply the number of events divided by the period of record.
The likely frequency of occurrence of an outage can be subjective, given the nature of
the risks posed and steps taken to mitigate such events. However, for this source the
frequency applied is 1 year multiplied by the 1 month divided by the number of years
of record:
(N*NM) / NYRS = 1*1/10 = 0.1
J.39 Thus the probability of the event for that month of the year is 0.10
J.40 And hence the outage risk assigned (magnitude*frequency*duration) / no. days in the month
is (5 * 0.1 * 15) / 31 = 0.24 Ml/d in the month that it occurred and zero for all other months.
J.41 If however, the event were to last for more than one month the calculation is the same but
needs to account for those months where the outage has occurred. If say the event lasts all
year then;
The duration (d) of the event is 365 days and thus impacts on each month of the
year; so this also has to be reflected in the frequency. Only one figure is available
from the information sourced for event frequency, so it is not plausible to apply any
distributions. Therefore a single value is used in event frequency
Again, the frequency (f) should reflect the likely chance of occurrence of a given
outage in any one year and is not simply the number of events divided by the period
of record. The likely frequency of occurrence of an outage can also be subjective,
given the nature of the risks posed and steps taken to mitigate such events. In this
example, the frequency is now multiplied by the number of months affected (NM), as
determined by the length of the outage event. For this source the frequency applied is
one year multiplied by the 12 months divided by the number of years of record:
(N*NM) / NYRS = 1*12/10 = 1.2
J.42 Thus the probability in any month of the year is 1.2/12 (number of months affected) = 0.10
J.43 Hence the outage risk in each month is (5 * 0.1 * 31) / 31 = 0.5 Ml/d
J.44 The inputs can be far more complicated however, depending on the nature of the events and
frequency is particularly open to interpretation.
J.45 The duration and timing of an event within the year is also important as Outage Allowance is
based on outages that occur in the critical month.
J.46 Example 2: If there were three sources that experienced outages each of 15 days duration
but in different months and had been assigned different frequencies to reflect the ten year
record of such events previously then the outage risk would be as in Table J-2. Note if the
duration is less than a complete month the m*f*d is divided by the number of days in the
10Revised draft Water Resources Management Plan 2019
Appendix J: Outage – October 2018
month to give a value in Ml/d for the month. The Actual Outage during the period is shown in,
with a total of 1.24 Ml/d.
Table J-2: Outage for the critical month – example 2
Magnitude Duration Outage risk (Ml/d) Actual
Frequency
(Ml/d) days Jan Feb Mar outage
Outage 1 5 0.3 15 0.73 0.21
Outage 2 10 0.2 15 1.07 0.41
Outage 3 15 0.1 15 0.73 0.62
Total 0.73 1.07 0.73 1.24
J.47 Thus February would be the critical month with the largest outage to which a risk of 5% would
be applied giving an Outage Allowance of around 1 Ml/d. The other two outages would
therefore not feature as part of the Outage Allowance. Thus only 42%
(1.07/(1.07+0.73+0.73)) of the outage risk occurs in the critical month.
J.48 Example 3: If however, Outage 1 actually occurred in February and not January the story
would be different as shown in Table J-3.
Table J-3: Outage for the critical month – example 3
Magnitude Duration Outage risk (Ml/d) Actual
Frequency
(Ml/d) days Jan Feb Mar outage
Outage 1 5 0.3 15 0.80 0.21
Outage 2 10 0.2 15 1.07 0.41
Outage 3 15 0.1 15 0.73 0.62
Total 0.00 1.87 0.73 1.24
J.49 Here the outage risk is increased to 1.87 Ml/d from which the Outage Allowance is determined
with a 5% risk and February remains the critical month. The outage in March would not
contribute to the outage risk and thus only 72% (1.87/(1.87+0.73)) of the outage risk
experienced in that year occurs in the critical month.
J.50 Example 4: If however, Outage 1 actually occurred in March the story would be different
again as shown in Table J-4.
Table J-4: Outage for the critical month – example 4
Magnitude Duration Outage risk (Ml/d) Actual
Frequency
(Ml/d) days Jan Feb Mar outage
Outage 1 5 0.3 15 0.73 0.21
Outage 2 10 0.2 15 1.07 0.41
Outage 3 15 0.1 15 0.73 0.62
Total 0.00 1.07 1.46 1.24
11Revised draft Water Resources Management Plan 2019
Appendix J: Outage – October 2018
J.51 Here the outage risk becomes 1.46 Ml/d from which the Outage Allowance is determined with
a 5% risk however, March becomes the critical month. Hence only 58% (1.46/(1.46+1.07)) of
the outage risk experienced in that year occurs in the critical month.
J.52 Thus the timing of any outages are critical in determining Outage Allowance and whilst just
three months are shown here the same would apply throughout the year. The examples also
show that Actual Outage can be larger or smaller than outage risk depending on the timing of
the outage events in any year.
Interpretation of risk
Impact of record length on Outage Allowance
J.53 From an assessment of the historic outage record we noted that the Thames Water Outage
Allowance was biased by the earlier record from which it had been calculated; an important
element in the calculation of the frequency of events. On reviewing the results for the
reporting period 2015/16 they indicate that using the more recent record gives a better
reflection of recent events and the level of Actual Outage. Thus on comparing the London
results (seen in Table J-5) the Outage Allowance is greater using the more recent AR08 to
AR16 data compared to that using the AR02 to AR16 data, the full record. It is also noted that
the Outage Allowance is now more in line with the Actual Outage.
J.54 Figure J-4 shows for London the difference between Actual Outage and Outage Allowance.
AR17+ Actual Outage during the reporting year 2017/18 has been much larger than any
reporting year to date, principally due to a large outage at our London Gateway WTW. So our
Actual Outage for this year is much larger than our Outage Allowance. Investment has been
made at Gateway WTW and this works has been returned to supply (see Table J-8).
J.55 Following detailed discussions with the Environment Agency and after reviewing our approach
and datasets against that of other water companies we concluded that our Outage Allowance
would be more representative of the current day if we were to reduce the length of historical
data used in the assessment. Therefore, in reporting our Outage Allowance for the Annual
Return, from 2016 we started to use the more recent record of outages in our reporting, the
data for which started from the period 2007/08. We are now also taking into account outages
from 2016/17 as well as 2017/18.
Table J-5: Outage Allowance using different length of records
n=15 years n=9 years
Outage Allowance – (Ml/d)
AR02 to AR16 AR08 to AR16
Outage Allowance - data and frequency
for specified period n (Ml/d) 51.2 81.7
12Revised draft Water Resources Management Plan 2019
Appendix J: Outage – October 2018
Figure J-4: Annual review 2017+ Outage Allowance and Actual Outage
J.56 In addition, where measures have been taken to mitigate the risk of an outage being
repeated, this is also taken into consideration. For example, where a site has been re-
commissioned following engineering work to resolve water quality constraints on supply
through installation of new or modified treatment processes, the outages previously
experienced that drove the need for investment will be removed from the historical record.
Indeed if the risk is deemed remote then professional judgement may be relied on to assign
frequency.
J.57 Although shortening the historical outage record has in increased confidence in the calculated
Outage Allowance, in order to avoid the calculated value to be overly skewed to very recent
outages, particular attention was given to reservoir and raw water tunnel outages. This
relates to a number of London reservoir outages that occurred recently following the failure of
a raw water tunnel connected to a storage reservoir which, if viewed in isolation, would be
seen as a frequent occurrence. Several other tunnels were of similar design, and so these
were relined, resulting in outages during construction works. This resulted in the reservoir
Outage Allowance being skewed towards very recent outages when there had been no other
such outages over the previous 30 years.
J.58 To reflect this historical position and mitigate an overly skewed Outage Allowance the outage
record was lengthened from 10 to 30 years, as it was felt appropriate to limit the impact on
outage of this type of event. If this decision was reversed and only the ten year record were
considered then the outage would increase. The programme of raw water tunnel relining is
coming to an end and will be complete in the next few years. Accordingly, we have removed
some of the reservoir and raw water tunnel outages from the historical record and will remove
all of these outages when the relining programme is finished to reflect the reduction in risk as
a result of asset investment.
13Revised draft Water Resources Management Plan 2019
Appendix J: Outage – October 2018
Base year Outage Allowance
J.59 Each year, as part of our reporting for the Annual Review, we review our Outage Allowance
and examine any changes to the information on which the Outage Allowance is assessed.
The methodology used for evaluating outage is compatible with the latest UKWIR
methodology used for assessing headroom uncertainty (see Appendix V: Risk and
uncertainty). The method provides an assessment of the uncertainty surrounding outage
within the supply demand balance, with a range of probabilities and confidence limits.
J.60 Table J-6 summarises the Outage Allowances used for strategic planning purposes by WRZ
for the years 2015/16 (AR16), 2016/17 (AR17) and the values at WRMP14 based on AR13
data, as well as the baseline for the revised draft WRMP19, i.e. AR17+.
Table J-6: Outage Allowance by WRZ
Outage (Ml/d)*
WRZ
WRMP14 AR16 AR17 AR17+**
London 46.27 81.72 84.55 99.76
SWOX 14.88 16.73 17.50 17.23
Kennet Valley 1.85 2.80 2.59 2.49
Henley 1.05 0.44 0.40 0.36
SWA 12.53 10.75 9.99 9.46
Guildford 0.81 1.25 1.33 1.40
Total 77.39 113.69 116.36 130.7
Note:
* Figures are consistent for Dry Year Annual Average (DYAA) and Dry Year Critical Peak (DYCP)
** A17+ figures have been used in the revised draft WRMP19. These are AR17 figures updated with the
best available outage information at the time of producing the revised draft WRMP19
J.61 The Outage Allowance is currently considered to be same for both the DYAA and DYCP
conditions. Historically, we have not recorded outages against peak Dos. One of the key
reasons is that a peak DO is not needed for the majority of the time, only at times of peak
demand, so our WTWs do not need to be available to deliver peak DO at all times. As such,
simply altering the 'outage against average DO' model to measure outage against peak DO at
times of peak demand would not necessarily give an accurate reflection of peak period
outage. To ensure that our outage modelling provides an appropriate assessment of peak
supply impact, specifically in those WRZs where DYCP is the supply demand driver, we will
be reviewing and updating our methodology as necessary. We aim to build on our outage
reporting approaches to include recording and analysis of WTW capability to meet peak
demands when required, and include an assessment of 'peak period outage' for WRMP24.
J.62 Table J-6 shows that since WRMP14 the allowances have increased in some WRZs and
reduced in others. Given that we are reporting Actual Outage on an annual basis in the
14Revised draft Water Resources Management Plan 2019
Appendix J: Outage – October 2018
Annual Review it was felt appropriate to simultaneously update the view of the Outage
Allowance in the WRMP14, as events in any year influence the risk perceived. For the
revised draft WRMP19 we take a snapshot in time as to the baseline Outage Allowance and
assume this applies over the planning period, i.e. the Outage Allowance used in the baseline
forecast is considered to remain constant across the planning period. As regards future
Outage Allowances and the final preferred programme, none of the options have any implicit
bias towards greater or smaller outages and so it is not practical to estimate with confidence
the Outage Allowance for new schemes. Accordingly, we consider it is appropriate to use the
base year Outage Allowance throughout the planning period, recognising that this generally
implies an effective change in Outage Allowance as a proportion of WRZ supply capability.
J.63 The Outage Allowance for the revised draft WRMP19 is as described as AR17+ in Table J-6.
The change in Outage Allowance between WRMP14 (77.39 Ml/d) and draft WRMP19
(130.7 Ml/d) is largely driven by changes in the London WRZ and the methodology change
noted above. This resulted in an increase in Outage Allowance from 46.27 Ml/d in WRMP14
to 81.72 Ml/d in AR16. In the draft WRMP19, the Outage Allowance was very similar at
84.55 Ml/d, increasing to 99.76 Ml/d in London for the revised draft WRMP19 as shown in
Table J-6. As part of a continual data improvement process, our reported AR18 Outage
Allowance has now decreased from the revised draft WRMP19 baseline figure of 99.76 Ml/d
to around 93 Ml/d in the London WRZ.
J.64 The Outage Allowance is different to the Actual Outage which will occur in any one particular
reporting year. There is no standard industry methodology for calculating Actual Outage and
we have derived a means by which it can be measured, as summarised in the equation
below.
J.65 Actual Outage is the temporary loss of DO in the reporting year weighted by the duration of
the loss (in days).
Example: a source DO loss of 10 Ml/d lasts 45 days thus
Weighted outage = 10 * (45 / 365 ) = 1.23 Ml/d
J.66 Each weighted outage is then summed over the reporting year to give a total Actual Outage
for the WRZ, as reported in the Annual Review. This is fundamentally different to the Outage
Allowance in the revised draft WRMP19, the calculation of which is based on risk and
therefore reflects the probability of an outage event happening again in the future.
J.67 Details of the individual sites which comprise the Actual Outages are reported in the Annual
Review to the Environment Agency together with the Outage Allowance and, therefore, are
not set out here. The information allows Actual Outage to be compared with the Outage
Allowance, i.e. the figure used for planning purposes in the revised draft WRMP19.
Information was collated for the period from April 2016 to the end of March 2017 for the draft
WRMP19, and updated in the revised draft WRMP19 to include the most recently available
information from 2017/18. This information has been used to update the baseline Outage
Allowance for each WRZ, reported in Table J-6 as the AR17+ Outage Allowances.
J.68 The level of risk of an outage occurring depends at least in part on the length of record
available over which to assess the risk; currently we have eleven years of records from
2007/08. This is a relatively short period of record and it is inevitable that not all sources of
outages will have been experienced in this period. As our documented experience of different
15Revised draft Water Resources Management Plan 2019
Appendix J: Outage – October 2018
causes of outage increases it follows that our Outage Allowances can be expected to
increase. This is despite the delivery of investment to address outages experienced earlier in
the period of record.
J.69 The risk of outage for each month of the year is calculated by sampling the probability density
functions of magnitude, frequency of occurrence and duration for each month of the year and
multiplying them together. Thus the annual Outage Allowance is the highest monthly value in
the year derived from the sample statistics.
J.70 The difference between the Outage Allowance and the Actual Outage that has occurred over
the period 2007/08 to 2017/18 across all WRZs is shown in Table J-7 and Figure J-4. An
update of the Outage Allowance assessment is also presented, which shows an increase in
Outage Allowance primarily as a result of length of record now being used to calculate Outage
Allowance and a number of recent, large outages. The Outage Allowance considered for
revised draft WRMP19 for the whole Thames Water area is 130.7. A summary of the changes
in outage at WRZ as reported in the Annual Review 2017 is given in Table J-7.
J.71 As we collect more data on outage events our understanding of the risk to water supply
improves and simultaneously so does our understanding of the actions that can be taken to
reduce the risk. The improved records on outage and the period of time over which these data
have been collected means that the total Outage Allowance in the revised draft WRMP19 has
increased. We anticipate that the Outage Allowance will level out with time although there will
inevitably be some variance as this is the nature with such “unplanned events”. We consider
that the current level of Outage Allowance is reasonable given the complex nature of
London’s water resources.
J.72 In addition, progress has been made on restoring many of the London outages of long
duration. An update on progress with ongoing activities and investigations in London is
shown in Table J-8, with Table J-9 showing an update on progress for Thames Valley.
16Revised draft Water Resources Management Plan 2019
Appendix J: Outage – October 2018
Table J-7: Outage assessment Annual review 2017+
Outage Assessments forecast for Inclusion in AR18 (Ml/d) -- Outage Allowance @ 5% Risk
Resource Zone SWOX KV HEN SWA GUI London Total
Outage Allowance dWRMP08 10.61 1.60 1.07 3.00 0.38 11.53 28.22
Outage Allowance WRMP09/JR08 10.62 1.68 1.05 3.06 0.38 14.76 31.57
Outage Allowance Update 2009 13.33 2.18 1.06 9.53 0.64 17.97 44.70
Outage Allowance JR10 13.14 1.79 1.06 9.71 0.65 24.47 50.82
Outage Allowance JR11 15.28 1.78 1.06 10.84 0.62 34.57 64.15
Outage Allowance AR12 15.04 1.77 1.08 11.97 0.78 36.04 66.67
Outage Allowance AR13 (WRMP14) 14.88 1.85 1.05 12.53 0.81 46.27 77.39
Outage Allowance AR14 15.34 2.14 1.04 12.27 0.77 39.32 70.88
Outage Allowance AR15 16.76 2.01 0.93 13.73 0.85 46.44 80.72
Outage Allowance AR16 16.73 2.80 0.44 10.75 1.25 81.72 113.69
Outage Allowance AR17 17.50 2.59 0.40 9.99 1.33 84.55 116.36
2007-8 Actual Outage 4.27 4.50 0.00 0.00 0.00 18.7 27.4
2008-9 Actual Outage 11.92 4.55 0.61 10.65 1.13 54.8 83.7
2009-10 Actual Outage 4.86 0.02 0.00 5.52 0.00 58.8 69.2
2010-11 Actual Outage 11.59 0.00 0.00 10.97 0.00 113.3 135.9
2011-12 Actual Outage 2.73 0.00 0.01 9.95 1.06 90.4 104.1
2012-13 Actual Outage 3.83 0.02 0.00 18.30 2.08 120.3 144.5
2013-14 Actual Outage 4.18 1.81 0.00 13.84 0.81 65.8 86.4
2014-15 Actual Outage 7.63 1.73 0.00 11.12 2.98 81.5 105.0
2015-16 Actual Outage 3.77 0.00 0.05 1.68 4.14 77.6 87.2
2016-17 Actual Outage 4.72 0.01 0.00 4.84 2.07 80.5 92.2
AR17+ Actual Outage 6.09 0.28 0.04 9.95 1.57 226.5 244.4
Outage Allowance AR17+ 17.23 2.49 0.36 9.46 1.40 99.76 130.7
17Revised draft Water Resources Management Plan 2019
Appendix J: Outage – October 2018
Table J-8: London sources with outage of lengthy duration
Source Reason for outage Comments
Queen Mary and Pump outages and
Pumps repaired.
Mother Reservoirs restrictions
Staines North Essential work completed on the inlet/outlet
Maintenance tower.
Reservoir
Ground condition investigations being
Sand ingress to planned.
New River Head
borehole SDO reduced to 0 Ml/d for AR17 therefore no
longer included as outage.
Treatment process Recommissioning of WTW completed.
Brixton
issues Source returned to supply in April 2018.
Recommissioning of WTW continuing.
Treatment process
Battersea Source expected to be available during
issues
summer 2018.
Railway Borehole available and pumped to
Epsom (Railway
Turbidity WTW for supply. SDO reduced to reflect
Borehole) water quality restrictions.
Ultrafiltration (UF) & Reverse Osmosis (RO)
Water quality & membranes replaced, microbiological
Gateway treatment process contamination investigation completed &
issues chemical dosing lines replaced. Source
returned to supply in January 2018.
Water quality investigation in progress, status
of pumping station investigated. Capacity of
Water quality & asset
Hoddesdon Transfer Rye Meads STW to be increased as part of
operational issues growth investment, with completion in
2018/19.
Water quality investigation completed. New
ultraviolet (UV) process for Cryptosporidium
Hornsey Water quality treatment being constructed. Source planned
for return to supply in summer 2018.
Water quality investigation completed.
Installation of Cryptosporidium filtration
Langley Vale Water quality planned. Source planned for return to supply
in summer 2018.
Fibre optic communication connection with
Ladywell Fields Operational issue site resolved. Source returned to supply in
April 2018.
Electrical supply issues, which have now
Turbidity & operational
Nonsuch been resolved, also restricted output due to
issues turbidity.
Water treatment disinfection process
improvement undertaken & site
Streatham Planned work recommissioned. Source returned to supply in
spring 2018.
Water quality investigation completed. New
filtration process for Cryptosporidium
Waddon Water quality treatment being constructed. Source planned
for return to supply in summer 2018.
18Revised draft Water Resources Management Plan 2019
Appendix J: Outage – October 2018
Table J-9: Thames Valley sources with outage of lengthy duration
Source Reason for outage Comments
Increased capability of filtration process
Eton Plant availability for Cryptosporidium treatment
constructed.
New run to waste pipeline & borehole
soakaway in construction.
Hawridge Operational issue
Increase in source output planned for
summer 2018.
Site run to waste recommissioned, water
Turbidity/operational quality sampled & site recommissioned
Witheridge Hill
issues into supply. Source returned to supply in
March 2018.
J.73 We are pro-actively looking to reduce outage events and the length of time sites are out of
service. In response to comments from the Environment Agency raised during the
consultation on our draft WRMP19, we are also considering the significance of outages longer
than 90 days on Outage Allowance and the supply demand balance, as well as the
consequences for our preferred programme. This analysis is presented as a ‘what-if?’
scenario in the revised draft WRMP19, Section 10: Programme appraisal and scenario
testing. The context is that outage events longer than 90 days exist in our historical record
and, in strict adherence to outage guidance, should perhaps have been reported as losses of
DO. There have also been occasions where outages have occurred which were initially
envisaged as being simple issues, but which turned out to be more complex issues, and so
taking longer to return assets to being available. As a result, it was not felt that removing
these longer historical outages from our record would present a fair representation of our
experience of outage.
J.74 On the management of future outages, we are developing plans and programmes for
returning sources to availability, including justifying outages with durations of greater than 90
days. For example, investment in WTWs upgrades may require design, construction and
commissioning programmes longer than 90 days, but should not be considered a loss of DO
as they will often be complete within a given reporting year. In addition, such upgrades may
enable the removal of associated outages from the historical record. However, if on putting a
plan together, it becomes apparent that resolution of the outage will require a more complex
and longer programme of works than originally envisaged, this could result in it being
considered as a loss of DO.
J.75 On our proposed approach to historical outages, we have amended the historical outage
record and the associated outage model to cap all historical outages at 90 days, as discussed
with the Environment Agency. This approach reduces the Outage Allowance for London by
18.9 Ml/d, i.e. a potential improvement to the supply-demand position. It is this alternative
analysis that forms the basis for the supply demand planning scenario presented in Section
10: Programme appraisal and scenario testing to explore the implications that this change in
methodology would have for our preferred programme.
J.76 To ensure future outage risk is managed, we are developing plans and programmes for
returning sources to availability and maintaining that availability into the future. This includes
19Revised draft Water Resources Management Plan 2019
Appendix J: Outage – October 2018
identifying the issues causing the outages, the outage impact on DO, the actions being
undertaken to address the outage as well as the outcomes. This may eventually lead to a
reduction in the number of events being recorded in the database with a knock-on benefit to
the reported Outage Allowance.
20You can also read