Images and Spectra of the 2017 Total Solar Eclipse Corona From Our Oregon Site - Frontiers
←
→
Page content transcription
If your browser does not render page correctly, please read the page content below
ORIGINAL RESEARCH
                                                                                                                                            published: 24 October 2018
                                                                                                                                        doi: 10.3389/fspas.2018.00037

                                            Images and Spectra of the 2017 Total
                                            Solar Eclipse Corona From Our
                                            Oregon Site
                                            Jay M. Pasachoff 1*, Christian Lockwood 2 , Erin Meadors 2 , Ross Yu 2 , Cielo Perez 2 ,
                                            Marcos A. Peñaloza-Murillo 3 , Daniel B. Seaton 4 , Aris Voulgaris 5 , Ron Dantowitz 6 ,
                                            Vojtech Rušin 7 and Thanasis Economou 8
                                            1
                                              Hopkins Observatory, Williams College, Williamstown, MA, United States, 2 Astronomy Department, Williams College,
                                            Williamstown, MA, United States, 3 Astronomy Department, Williams College, University of the Andes-Merida, Mérida,
                                            Venezuela, 4 Cooperative Institute for Research in Environmental Sciences, University of Colorado, NOAA National Centers
                                            for Environmental Information, Boulder, CO, United States, 5 Icarus Optomechanics, Thessaloniki, Greece, 6 Dexter Southfield
                                            School, Brookline, MA, United States, 7 Astronomical Institute, Slovak Academy of Sciences, Tatranská Lomnica, Slovakia,
                                            8
                                              Enrico Fermi Institute, University of Chicago, Chicago, IL, United States

                                            We report on early results from a suite of instruments for imaging and spectra we
                                            deployed to Salem, Oregon, for 2 min of totality at the August 21, 2017, total solar eclipse.
                            Edited by:      Our instruments included refracting telescopes and telephoto lenses for use with CCD
               Scott William McIntosh,      detectors and DSLR cameras, narrow-band filters at the wavelengths of coronal emission
      National Center for Atmospheric
      Research (UCAR), United States
                                            lines ([Fe XIV] 530.3 nm and [Fe X] 637.4 nm), and spectrographs. We also monitored
                          Reviewed by:
                                            the effect of the eclipse penumbra and umbra on the terrestrial atmosphere. The total
                        Harry P. Warren,    solar eclipse of August 21, 2017, was the first whose totality crossed only United States
         United States Naval Research       territory since the origin of the country, and the first to cross the Continental United States
              Laboratory, United States
                       Bidya Bina Karak,    from coast to coast in 99 years. As a result, major campaigns of scientific research and
  Indian Institute of Technology (BHU),     of outreach were carried out.
                                   India
                                            Keywords: corona, eclipse, sun, spectra, sunspot cycle, saros
                   *Correspondence:
                      Jay M. Pasachoff
                  eclipse@williams.edu
                                            INTRODUCTION
                    Specialty section:
                                            The total solar eclipse of August 21, 2017, was the first whose totality crossed only United States
          This article was submitted to
             Stellar and Solar Physics,
                                            territory since the origin of the country, and the first to cross the Continental United States from
                 a section of the journal   coast to coast in 99 years. As a result, major campaigns of scientific research and of outreach were
    Frontiers in Astronomy and Space        carried out.
                               Sciences         Our own expedition team included six scientists, 8 undergraduate students, 3 graduate students,
             Received: 24 July 2018         and several collaborators at our main scientific site on the campus of Willamette University, Salem,
         Accepted: 02 October 2018          Oregon. We took advantage of the unusual-for-us ground access by shipping a variety of telescopes,
         Published: 24 October 2018         spectrographs, Lyot-type filters, cameras and telescope-mounts across the country by truck in
                             Citation:      addition to air shipping of international and other equipment. We coordinated with colleagues
           Pasachoff JM, Lockwood C,        65 min farther along the path of totality, in southern Illinois, in order to be able to calculate
             Meadors E, Yu R, Perez C,      velocities of changing coronal features.
     Peñaloza-Murillo MA, Seaton DB,            We were particularly interested in the shape of the corona as part of a synoptic observation set
Voulgaris A, Dantowitz R, Rušin V and
                                            that began early in the previous solar-activity cycle, and linking to older radial-filter observations
      Economou T (2018) Images and
        Spectra of the 2017 Total Solar
                                            by Newkirk and others (described with a full set of images in Golub and Pasachoff, 2010, 2014). The
Eclipse Corona From Our Oregon Site.        ellipticity is greater at solar minimum, and the flattening index in this 2017 eclipse, as well as those
        Front. Astron. Space Sci. 5:37.     measured for the 2019 and 2020 eclipses, should give indications on the strength of the forthcoming
       doi: 10.3389/fspas.2018.00037        cycle, which follows the declining peak of the recently past cycle and its two predecessors.

Frontiers in Astronomy and Space Sciences | www.frontiersin.org                    1                                               October 2018 | Volume 5 | Article 37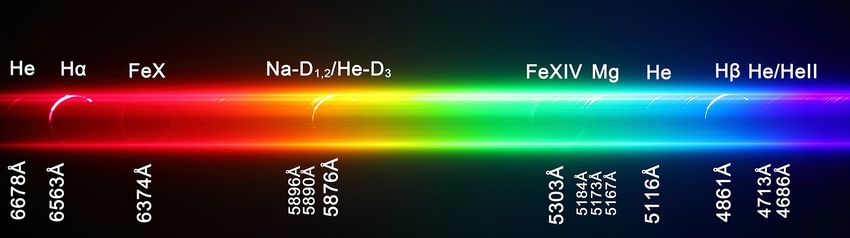
Pasachoff et al.                                                                                                        2017 Eclipse Imaging and Spectra

    Our observations follow earlier high-resolution imaging in
streamers (Pasachoff et al., 2007, 2009) and in polar plumes
(Pasachoff et al., 2008). We discussed dynamics in Pasachoff
et al. (2011) and Pasachoff et al. (2015). We use photographic
techniques upgraded from earlier drawings and paintings
(Pasachoff and Olson, 2014, 2015).
    Pasachoff discussed the range of science carried out at eclipses
(Pasachoff, 2009a,b, 2017a,b, 2018a). Pasachoff and Fraknoi
(2017) provided a Resource Letter about observing solar eclipses
following Pasachoff ’s Resource Letter about solar science and
outreach (Pasachoff, 2010).

OBSERVATIONS AND METHODS
As is well known, the white light corona–the scattered light
of the photosphere on free electrons (Thomson scattering)–
                                                                            FIGURE 1 | High-contrast imaging showing the paucity of equatorial coronal
is a very good indicator of magnetic fields on the Sun,
                                                                            streamers at this solar-minimum phase of the sunspot cycle, incorporating 11
and, these magnetic field lines generate different structures of            individual images taken with a Nikon D-810 DSLR camera and a 800-mm
the solar corona, e.g., helmet streamers, loops, coronal holes,             Nikkor lens and processed by Christian Lockwood.
polar plumes, etc., of a different size and brightness. The
relationship of the individual white-light coronal structures to
the distribution of magnetic fields observed on the surface
of the Sun is sometimes quite problematic, particularly, as
observed from the coronagraphs on the Solar and Heliospheric
Observatory (SOHO) and the Sun Earth Connection Coronal
and Heliospheric Investigation (SECCHI; Howard et al., 2008)
suite of instruments on NASA’s Solar TErrestrial RElations
Observatory (STEREO). (The instrument suite was named after
Fr. Angelo Secchi, director of the Vatican Observatory in the
19th century, whose 200th birth anniversary was celebrated with
a symposium in Rome; Pasachoff, 2018b.) One of the ways to
do this is to observe the white-light corona during total solar
eclipses at high spatial resolution with subsequent computer
data processing, e.g., Koutchmy et al. (1988), Druckmüller
et al. (2006). High-quality pictures of the white-light corona
during the eclipse and their processing with a computer allows
us to distinguish small-scale coronal structures, for example,
around 5 arc seconds or less, whose contrast between them
is very low, and which are lost with standard exposures.
The most recent occasion of this kind was the total solar
eclipse observed on August 21, 2017, in a narrow totality
path throughout the US, from northwest coast to southeast
                                                                            FIGURE 2 | A stack of 3 1/40-s images that is closer to the perception of the
coast.                                                                      eclipse to the unaided eye than the high-contrast composites (Ron Dantowitz).
   We used 20 Nikons, mainly D810s, which lack the moiré-
reducing filter that has been introduced into many camera
models but that slightly degrade the resolution. Our lenses
included Nikkor 800 mm and 400 mm non-mirror lenses as well                   Figure 2 shows the overall structure of the corona. A
as 500 mm mirror lenses and a Tele Vue refractor. Figure 1 shows           composite of our images has been used to successfully
a composite made from 11 originals with the 800 mm lens. Our               compare with the predictions (Mikic et al., 2018) made pre-
in-house techniques can now match the quality and contrast                 eclipse on the basis of the prior month of magnetograms
accessible in the past for our expedition’s and other expeditions’         of the solar disk from the HMI instrument on NASA’s
by the high-contrast data reduction made most famous by                    Solar Dynamics Observatory. Nandy et al. (2018) used a
Druckmüller though now available from several people.                      solar-surface flux-transport model for predicting the coronal
   We see the paucity of coronal streamers at high latitudes,              configuration.
revealing the coronal plumes that we studied at the 2006, 2008,               We also obtained a series of flash chromospheric and coronal
and 2009 eclipses (Pasachoff et al., 2007, 2008, 2009, 2011).              spectra using high-resolution (HiRes) and low-resolution

Frontiers in Astronomy and Space Sciences | www.frontiersin.org        2                                               October 2018 | Volume 5 | Article 37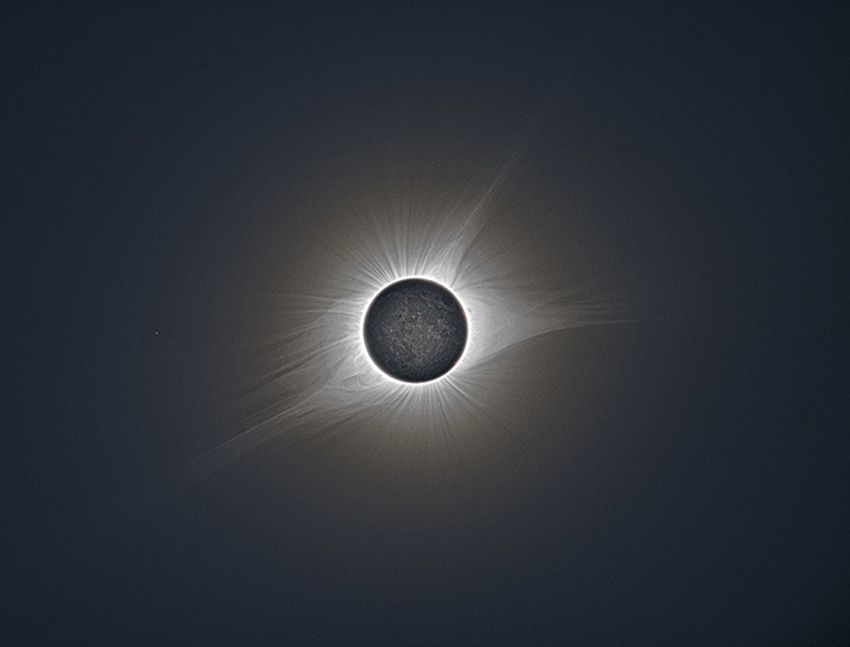
Pasachoff et al.                                                                                                           2017 Eclipse Imaging and Spectra

(LoRes) spectrographs. Two slitless spectrographs were used in                      spectral lines over the last solar-activity cycle, showing that the
different dispersion/resolution. These two spectrographs were                       lower-ionization line, typical of a coronal temperature of 1 MK
adapted on an equatorial mount. The LoRes spectrograph was                          or less, is stronger than the higher-ionization line, typical of a
used for the recording of the visual spectrum from 420 nm up                        coronal temperature of ∼1.5 MK at solar minimum, as we found
to 680 nm. The second spectrograph (HiRes) was used for the                         here. In comparison, at solar maximum, we have found the ratio
capturing a spectral band from the forbidden [Fe XIV] 530.3 nm                      to have been reversed, with the [Fe XIV] line stronger than the [Fe
emission line up to the forbidden [Fe X] 637.4 nm emission                          X] line. Our previous observations include Voulgaris et al. (2010)
line. Our spectrographs correlated with two narrow band                             from the 2006 and 2008 eclipses and Voulgaris et al. (2012) from
Lyot filters tuned to 530.nm (FWHM 0.38 nm) and 637.4 nm                            the 2010 eclipse.
(FWHM 0.5 nm) on a 10 cm Tele Vue refractor with a 220 mm
coelostat.                                                                          DISCUSSION
   We brought a meteorological station to measure air
temperature, atmospheric pressure, solar radiation, relative                        Figure 5 shows the prominent prominence, the innermost
humidity and wind (speed plus direction) at our site, to monitor                    corona, and 3rd-contact chromosphere. Our series of
the effect of first the penumbra and then the umbra, continuing                     observations allowed timing of 1 m 54 s of totality at our
the work described in (Peñaloza-Murillo and Pasachoff, 2015). In                    site (17:17:21-17:19:15 UTC), which we are comparing with the
addition, an array of photo-sensors was used to measure the sky                     predictions that depend on the exact value for the solar diameter
brightness.                                                                         (Pasachoff et al., 2017d), given the 3-D mapping of the moon in
                                                                                    recent years from the Japanese Kaguya spacecraft and the NASA
RESULTS                                                                             Lunar Reconnaissance Orbiter.
                                                                                        Besides the helmet streamer and threadlike rays, the corona
Figure 3 shows a stacked image of the white-light corona as                         shape was dominated by coronal holes with well-developed polar
processed by Roman Vanúr from the 800 mm telephoto lens,                            plumes. The northern coronal hole was located in position angles
using 85 individual pictures of different exposures from 2 to                       (PA) 35–338◦ . There was an interesting intensity break at PA
1/500 s. To show higher contrast that reveals the structure of the                  298–305◦ at the solar surface, even though some faint rays were
underlying magnetic field, we used an especially-high-frequency                     observed in the middle; they expand with height above the
filter. Tian et al. (2017) and Chen et al. (2018) have described the                limb. This intensity break separated two helmet streamers. The
coronal configuration and a coronal cavity over a prominence                        southern coronal hole was located in PA 158–208◦ .
region, which also shows on our images. Hanaoka et al. (2018)                           Preliminary comparison of our coronal observations from
have described changes over an expanse of umbral motion across                      Oregon with those 65 min later along the path from Carbondale,
the United States.                                                                  Illinois, show a strong, narrow edge of a streamer flipping its
    Figure 4 shows a sample slitless spectrum, taken several                        orientation, giving a speed of hundreds of km s−1 , as well as a
seconds before 3rd contact, showing the forbidden [Fe X] coronal                    newly brightened polar plume (Pasachoff, 2017c; Pasachoff et al.,
red line at 637.4 nm and the forbidden [Fe XIV] coronal green                       2017e, 2018a,b).
line at 530.3 nm as well as chromospheric lines at low heights                          After calibrating our spectra, we detected the red coronal line
above the limb. We have been monitoring the ratio of these                          emitting uninterruptedly around the solar limb, even also above
                                                                                    the solar magnetic poles. By contrast, the strongest intensity of
                                                                                    the green coronal line was detected in two areas, in the east
                                                                                    (no sunspots were present) and northeast limbs, caused by the
                                                                                    existing—close to the limb—active sunspots 2672. We have been
                                                                                    monitoring the ratio of these spectral lines over the last solar-
                                                                                    activity cycle. We detected that the ratio of the intensity of these
                                                                                    two lines varies by the area of interest. There are many areas
                                                                                    around the solar limb in which the red coronal line is much
                                                                                    stronger than green line. The lack of homogeneity in the ratio
                                                                                    of two lines means that the coronal temperature strongly varies
                                                                                    according from place to place, following the heterogeneity of
                                                                                    the two emission lines. The absence of the green emission line
                                                                                    signifies a coronal temperature of 1 MK or less. The presence of
                                                                                    the green line, the higher-ionization line, is typical of a coronal
                                                                                    temperature of ∼1.9 MK at solar minimum, as we found over
                                                                                    some active areas. In our results, we did not detect the forbidden
                                                                                    yellow coronal line of Ca XV at 569.4 nm (∼3–5 MK), even above
                                                                                    from the rising sunspots on northeast limb.
 FIGURE 3 | A stack of images taken with an 800-mm f/5.6 lens and displayed
                                                                                        We continued our observations of the terrestrial atmosphere
 at exceedingly high contrast (Jay Pasachoff, Vojtech Rušin, Roman Vanúr, and
 the Williams College Eclipse Expedition team).
                                                                                    and its response to eclipses (Peñaloza-Murillo and Pasachoff,
                                                                                    2015; Pasachoff et al., 2016). The air-temperature measurements

Frontiers in Astronomy and Space Sciences | www.frontiersin.org                 3                                        October 2018 | Volume 5 | Article 37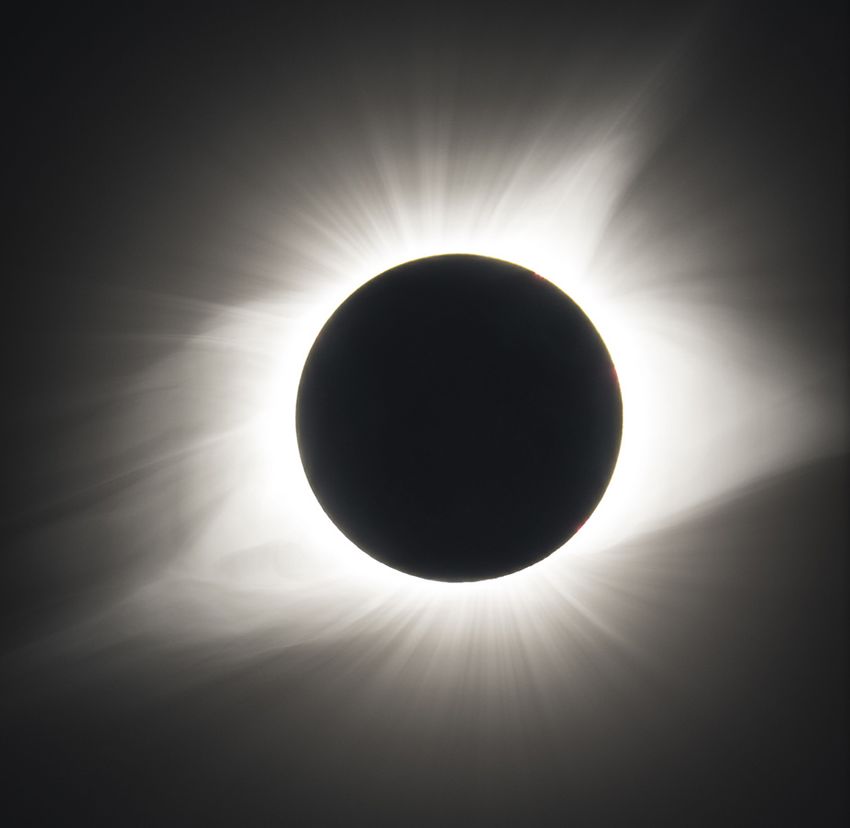
Pasachoff et al. 2017 Eclipse Imaging and Spectra
FIGURE 4 | A sample spectrum showing chromospheric lines at 3rd contact as well as forbidden coronal spectral lines, especially the standard [Fe X] at 637.4 nm
and [Fe XIV] at 530.3 nm (Aris Voulgaris).
from our Oregon site on the top of a building on the campus
of Willamette University show a drop of 3.1◦ C = 5.5◦ F, with a
delay of 4.8 min after central totality, at 0.5 m above the station
base. Other results show that at 1 m and 2 m above the station
base the drops were 2.5◦ C = 4.5◦ F with a delay of 4.8 min, and
1.6◦ C = 2.9◦ F with a delay of 6 min, respectively. These results
were typical for both variables according to those published by
Burt (2018) for this eclipse in sites like Whitman (Nebraska),
Crossville (Tennessee), and McClellanville (South Carolina). We
also detected a slight increase in atmospheric pressure at totality
and a pronounced drop in wind speed along with a reduction
(symmetric) in variability during the eclipse in accordance with
Aplin and Harrison (2003) for the eclipse of August 11, 1999,
in the UK. This drop of wind speed is associated with a
stabilization in wind direction between 264◦ and 312◦ clockwise
from north.
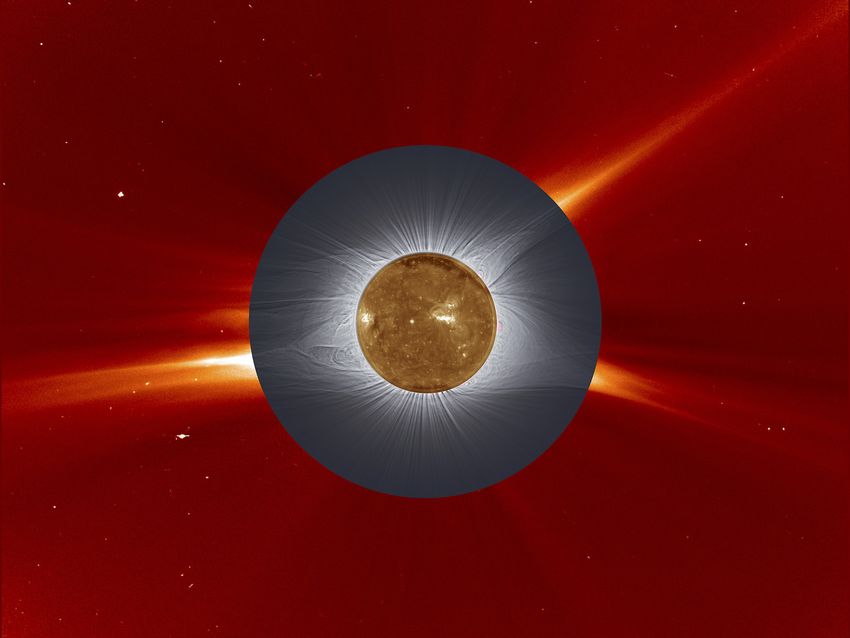
Figure 6 shows a comparison in which one of our processed
eclipse images fills the gap between the on-disk image from the
Solar Ultraviolet Imager (SUVI; Seaton and Darnel, 2018) on
NOAA’s Geostationary Operational Environmental Satellite-16
(GOES-16) spacecraft and a coronagraph image from the Large
Angle Spectrometric Coronagraph (LASCO; Brueckner et al.,
1995) on board SOHO. The combination of these images enables
features to be traced from the disk through our image of the lower
and middle corona to the lower-resolution C2 LASCO image.
The basis for our analysis of the large-scale white light coronal
FIGURE 5 | The chromosphere, the innermost corona, and prominences at
structure is this combined image of the eclipse white-light 3rd contact. Coronal cavities are nicely seen above prominences on the west
corona, the SOHO/LASCO C2 corona and the GOES-16/SUVI solar limb (Ron Dantowitz).
Sun of 30.4 nm. Looking at the SOHO white-light corona, we
see three significant and bright helmet streamers, two of which
are localized above the western limb of the Sun and one above Although the solar activity was relatively low through the first
the southeastern limb of the Sun. Streamers/rays that are less part of the year 2017, it increased in August and September. Then
pronounced are located above the eastern limb (three examples) the activity again diminished. On the day of the eclipse, the large
and above the western edge (one example). Similar polar rays also active area was located in the middle of the solar disk, so it could
show, though they had been hidden for much of the past decade not be responsible for coronal structures that are observed above
by high-latitude streamers typical of solar maximum. Pasachoff the solar limb. However, there was a small sunspot group near the
et al. (2008) had reported on motions and brightness changes in limb on the far side, and became visible the next day as it rotated
polar plumes during the 2006 total eclipse. onto the near side of the disk. Based on our analysis, we come to
In sum, the white-light corona on August 21, 2017, was the following conclusions:
observed on the descending branch of cycle 24, whose magnitude • The shape of the white light corona was a transient type with
according to many features of solar activity–e.g., sunspot three or four distinctive helmet streamers and well-developed
numbers, the 2,800 MHz radio flux, the green-line corona coronal holes above the two poles of the Sun, where polar plumes
intensities, etc.–was the lowest in the last four solar cycles. were observed.
Frontiers in Astronomy and Space Sciences | www.frontiersin.org 4 October 2018 | Volume 5 | Article 37Pasachoff et al. 2017 Eclipse Imaging and Spectra
Given the descent into the delayed solar-activity minimum
and the desirability of predicting and eventually determining
the height and activity of the next solar maximum, we
look forward to carrying out similar observations at the
total solar eclipses of 2 July 2019 from Chile and of 14
December 2020 from the Atlantic Coast of Argentina. See
http://eclipses.info for links and http://totalsolareclipse.org for
additional images and references from not only the 2017 total
solar eclipse but also from the three partial solar eclipses of
2018.
DATA AVAILABILITY STATEMENT
The raw data supporting the conclusions of this manuscript will
be made available by the authors, without undue reservation, to
any qualified researcher.
FIGURE 6 | A combination of one of our composite eclipse images between
an EUV image from GOES-16/SUVI at 19.5 nm (corresponding to Fe XI/XII AUTHOR CONTRIBUTIONS
emission at about 1.5 MK) and an image from the LASCO C2 coronagraph,
occulting up to 2.5 solar radii revealing the connection between structures in JP organized the effort and supplied scientific and logistic
the extended corona and the source regions on the solar disk. It is improved backing. CL operated cameras and composited images. EM
from our Astronomy Picture of the Day image from September 27, 2017 operated and organized cameras and worked with data.
(https://apod.nasa.gov/apod/ap170927.html), with a more detailed eclipse
composite and a GOES-16 image instead of the earlier Solar Dynamics
RY organized and operated the meteorological station. CP
Observatory image (eclipse: Jay Pasachoff, Vojtech Rušin, Roman Vanúr, and programmed cameras, operated them, and worked with spectral
the Williams College Eclipse Expedition team). data. MP-M consulted on the meteorological station and
analyzed the data. DS provided the liaisons to space EUV
observations. AV built and operated imaging and spectral
• At the preliminary phase 0.8 of Cycle 24, the Ludendorff instruments. RD built and operated imaging and spectral
flattening index reached 0.24 and replicates the cyclical variability instruments. VR participated in the observing and provided
as obtained from many observations since 1851. In other words, analysis of the images. TE provided the observations from along
the shape of the white-light corona matched that of similar phase the totality path.
in the previous cycles, in spite of the fact that the peak of this cycle
was much lower. (See, for example, http://sidc.oma.be/silso.) ACKNOWLEDGMENTS
• Just over 1 h following our observations in Oregon,
structural changes occurred in the base of the SE helmet streamer, The Williams College Eclipse Expedition was supported largely
as well as a change in the brightness of some polar plumes, by grants AGS-1602461 from the Solar Terrestrial Program
perhaps showing a change in the flow of particles into the solar of the Atmospheric and Geospace Sciences Division of the
wind. US National Science Foundation and 9876-16 from the
• Above the southeast limb of the Sun, at a height of about 0.85 Committee for Research and Exploration of the National
radius, a dark arc was observed (there are bright arches as well, Geographic Society. Additional student support came from the
but the darker is better visible), whose feet at the solar surface NASA Massachusetts Space Grant, Sigma Xi (the honorary
are 104◦ apart, which is an extraordinary value. Loops or arcs are scientific society), the Slovak Academy of Sciences VEGA
generally seen in helmet-streamer boundaries, which was also the project 2/0003/16, the University of Pennsylvania, and the
case with all the helmet streamers. Freeman Foote Expeditionary Fund at Williams College. We
• Thin coronal rays or loops began to appear in the tops of thank Dr. Roman Vanúr for his work on white-light data
some of the prominences. processing. We thank Dr. Christophoros Mouratidis, Hellenic
STEREO observations show that the streamers are composed Ministry of Education, Research and Religious Affairs, Kos,
of still-finer-resolution features (DeForest et al., 2018), and our Greece for his work on the continuum subtraction of the
highest quality data reduction matches that idea. High-quality spectra. We thank Stephen Thorsett, Rick Watkins and Honey
observations of the white-light solar corona, with its processing, Wilson of Willamette University for their hospitality. We
allow us to separate different coronal structures (in the sense of thank Tom O’Brien, Photo Engineer for National Geographic
their brightness, size, shape, along the line of sight, etc.). Thus, the Magazine of National Geographic Partners, and Jessica Elfadl
corona becomes highly structural in every direction, composed of of the Exploration Technology Lab of the National Geographic
many structures of small dimensions. The white-light corona is Society for the loan of a Nikon camera and extreme Nikkor
also highly dynamic. The coronal structures and their dynamics telephoto. See http://totalsolareclipse.org or http://sites.williams.
are linked to the magnetic field, both local and global. edu/eclipse/2017-usa.
Frontiers in Astronomy and Space Sciences | www.frontiersin.org 5 October 2018 | Volume 5 | Article 37Pasachoff et al. 2017 Eclipse Imaging and Spectra
REFERENCES Pasachoff, J. M., and Fraknoi, A. (2017). Resource letter OSE-1 on observing solar
eclipses. Am. J. Phys. 85, 485–494. doi: 10.1119/1.4985062
Aplin, K. L., and Harrison, R. G. (2003). Meteorological effects of the eclipse of 11 Pasachoff, J. M., Jubier, X., and Wright, E. T. (2017d). “Syzygy information: lunar
August 1999 in cloudy and clear conditions. Proc. R. Soc. Lond. A 459, 353–371. limb profiles at total eclipses of the decade,” in 49th DPS, Provo, 417.17.
doi: 10.1098/rspa.2002.1042 Pasachoff, J. M., and Olson, R. J. M. (2014). Art of the eclipse. Nature 506, 314–315.
Brueckner, G. E., Howard, R. A., Koomen, M. J., Korendyke, C. M., Michels, D. J., doi: 10.1038/508314a
Moses, J. D., et al. (1995). The large angle spectrometric coronagraph (LASCO). Pasachoff, J. M., and Olson, R. J. M. (2015). The 1918 eclipse mural series by
Solar Phys. 162:357. doi: 10.1007/BF00733434 Howard Russell Butler for the American Museum of Natural History and the
Burt, S. (2018). Meteorological Impacts of the total solar eclipse of 21 August 2017. Hayden Planetarium. in Inspiration of Astronomical Phenomena VIII: City of
Weather 73, 90–95. doi: 10.1002/wea.3210 Stars, insap.org, eds B. P. Abbott (San Francisco, CA: Astronomical Society of
Chen, Y., Tian, H., Su, Y., Qu, Z., Deng, L., Jibben, P. R., et al. (2018). Diagnosing the Pacific), Astronomical Society of the Pacific Conference Series 501.
the magnetic field structure of a coronal cavity observed during the 2017 total Pasachoff, J. M., Peñaloza-Murillo, M. A., Carter, A. L., and Roman, M. T. (2016).
solar eclipse. Astrophys. J. 856, 21–30. doi: 10.3847/1538-4357/aaaf68 Terrestrial atmospheric responses on Svalbard to the 20 March 2015 Arctic total
DeForest, C. E., Howard, R. A., Velli, M., Viall, N., and Vourlidas, A. solar eclipse under extreme conditions. Phil. Trans. Roy. Soc. A 374:20160188.
(2018). The highly structured outer solar corona. Astrophys. J. 862:18. doi: 10.1098/rsta.2016.0188
doi: 10.3847/1538-4357/aac8e3 Pasachoff, J. M., Rušin, V., Druckmüller, M., Aniol, P., Saniga, M., and
Druckmüller, M., Rušin, V., and Minarovjech, M. (2006). A new numerical method Minarovjech, M. (2009). The 2008 August 1 eclipse solar-minimum corona
of total solar eclipse photography processing. Contr. Astron. Obs. Skalnaté Pleso unraveled. Astrophys. J. 702, 1297–1308. doi: 10.1088/0004-637X/702/2/1297
36, 131–148. Pasachoff, J. M., Rušin, V., Druckmüller, M., Druckmüllerová, H., Bělík, M., Saniga,
Golub, L., and Pasachoff, J. M. (2010). The Solar Corona, 2nd Edn. Cambridge, UK: M., et al. (2008). Polar plume brightening during the 29 March 2006 total
Cambridge University Press. eclipse. Astrophys. J. 682, 638–643. doi: 10.1086/588020
Golub, L., and Pasachoff, J. M. (2014). Nearest Star: The Surprising Science of Our Pasachoff, J. M., Rušin, V., Druckmüller, M., and Saniga, M. (2007). Fine structures
Sun. 2nd Edn. Cambridge, UK: Cambridge University Press. in the white-light solar corona at the 2006 eclipse. Astrophys. J. 665, 824–829.
Hanaoka, Y., Hasuo, R., Hirose, T., Ikeda, A. C., Shibashi, T., Manago, M., et al. doi: 10.1086/519680
(2018). Solar coronal jets extending to high altitudes observed during the 2017 Pasachoff, J. M., Rušin, V., Saniga, M., Babcock, B. A., Lu, M., Davis, A. B.,
August 21 total eclipse. Astrophys. J. 860:142. doi: 10.3847/1538-4357/aac49b et al. (2015). Structure and dynamics of the 13/14 November 2012 white-light
Howard, R. A., Moses, J. D., Vourlidas, A., Newmark, J. S., Socker, D. G., Plunkett, corona. Astrophys. J. 800, 90–109, doi: 10.1088/0004-637X/800/2/90
S. P., et al. (2008). Sun earth connection coronal and heliospheric investigation Pasachoff, J. M., Rušin, V., Saniga, M., Druckmüllerová, H., and Babcock, B. A.
(SECCHI). Space Sci. Rev. 136:67. doi: 10.1007/s11214-008-9341-4 (2011). Structure and dynamics of the 22 July 2009 eclipse white-light corona.
Koutchmy, O., Koutchmy, S., Nitschelm, C. H., Sýkora, J., and Smartt, R. N. (1988). Astrophys. J. 742, 29–42. doi: 10.1088/0004-637X/742/1/29
“Image processing of coronal pictures,” in Solar and Stellar Coronal Structure Pasachoff, J. M., Rušin, V., Vanúr, R., Economou, T., Voulgaris, A., Seiradakis, J.
and Dynamics; A Festschrift in Honor of Dr. John, W. Evans, eds R. C. Altrock H., et al. (2018b). “Configuration of and motions in the solar corona at the 2017
(National Solar Observatory/Sacramento Peak, Sunspot, N. M.), 256–266. total solar eclipse,” in 232nd AAS Meeting (Denver, CO), June, 325.10.
Mikic, Z., Downs, C., Linker, J. A., Caplan, R. M., Mackay, D., Upton, L., et al. Peñaloza-Murillo, M. A., and Pasachoff, J. M. (2015). Air-cooling mathematical
(2018). Predicting the corona for the 21 August 2017 total solar eclipse. Nat. analysis as inferred from the air temperature observation during the 1st total
Astron. 1:0190. doi: 10.1038/s41550-018-0562.5 occultation of the Sun of the 21st century in June 21, 2001, at Lusaka, Zambia.
Nandy, D., Bhowmik, P., Yeates, A. R., Panda, S., Tarafder, R., and Dash, S. (2018). J. Atmos. Solar Terrest. Phys. 125–126, 59–77. doi: 10.1016/j.jastp.2015.02.002
The large-scale coronal structure of the 2017 August 21 great american eclipse: Seaton, D. B., and Darnel, J. M. (2018). Observations of an eruptive solar flare
an assessment of solar surface flux transport model enabled predictions and in the extended EUV solar corona. ApJL 852:L9. doi: 10.3847/2041-8213/
observations. Astrophys. J. 853, 712–717. doi: 10.3847/1538-4357/aaa1eb aaa28e
Pasachoff, J., Person, M. J., Dantowitz, R., Lockwood, C. A., Nagle-McNaughton, Tian, H., Qu, Z., Chen, Y., Deng, L., Huang, Z., Li, H., et al. (2017). Observations of
T., Meadors, E. N., et al. (2018a). “2018, Early science results from the Williams the solar corona during the total solar eclipse on 21 August 2017. Earth Planet.
College eclipse expedition,” in 231st AAS, January, National Harbor, MD, Phys. 1, 68–71. doi: 10.26464/epp2017010
220.06. Voulgaris, A., Athanasiadis, T. M., Seiradakis, J. H., and Pasachoff, J. M. (2010). A
Pasachoff, J. M. (2009a). Solar eclipses as an astrophysical laboratory. Nature 459, Comparison of the red and green coronal line intensities at the 29 March 2006
789–795. doi: 10.1038/nature07987 and the 1 August 2008 total solar eclipses:considerations of the temperature
Pasachoff, J. M. (2009b). Scientific observations at total solar eclipses. Res. Astron. of the solar corona. Solar Phys. 264, 45–55. doi: 10.1007/s11207-010-
Astrophys. 9, 613–634. doi: 10.1088/1674-4527/9/6/001 9575-7
Pasachoff, J. M. (2010). Resource letter SP-1 on solar physics. Am. J. Phys. 78, Voulgaris, A., Gaintatzis, P., Seiradakis, J. H., Pasachoff, J. M., and Economou,
890–901. doi: 10.1119/1.3429977 T. E. (2012). Spectroscopic coronal observations during the total solar
Pasachoff, J. M. (2017a). The great solar eclipse of 2017. Sci. Am. 317, 54–61. eclipse of 11 July 2010. Solar Phys. 278, 187–202. doi: 10.1007/s11207-012-
doi: 10.1038/scientificamerican0817-54 9929-4
Pasachoff, J. M. (2017b). Heliophysics at total solar eclipses. Nat. Astron. 1:0190.
doi: 10.1038/s41550-017-0190 Conflict of Interest Statement: The authors declare that the research was
Pasachoff, J. M. (2017c). First Results from the August 21, 2017, Total Solar Eclipse. conducted in the absence of any commercial or financial relationships that could
Portland, OR: Solar Physics Division of AAS, 208.03. be construed as a potential conflict of interest.
Pasachoff, J. M. (2018a). Science at the Great American Eclipse. Astron. Geophys.
Roy. Astron. Soc. 59, 4.19–4.23. doi: 10.1093/astrogeo/aty191 Copyright © 2018 Pasachoff, Lockwood, Meadors, Yu, Perez, Peñaloza-Murillo,
Pasachoff, J. M. (2018b). “Secchi’s Solar Physics,” in International Conference on Seaton, Voulgaris, Dantowitz, Rušin and Economou. This is an open-access article
The Legacy of Angelo Secchi SJ 200 Years After His Birth, Rome, September 3–5. distributed under the terms of the Creative Commons Attribution License (CC BY).
Comitato Nazionale per le Celebrazioni del Bicentenario della Nascita di Angelo The use, distribution or reproduction in other forums is permitted, provided the
Secchi c/o Accademia Nazionale delle Scienze detta dei XL (Denver, CO). original author(s) and the copyright owner(s) are credited and that the original
Pasachoff, J. M., Dantowitz, R., Rušin, V., Seiradakis, J. H., Voulgaris, A., Seaton, publication in this journal is cited, in accordance with accepted academic practice.
D. B., et al. (2017e). First 2017-Total-Eclipse Results From the Williams College No use, distribution or reproduction is permitted which does not comply with these
Team. AGU, New Orleans, SH13B-2476. terms.
Frontiers in Astronomy and Space Sciences | www.frontiersin.org 6 October 2018 | Volume 5 | Article 37You can also read