CONTEMPORARY EDUCATIONAL TECHNOLOGY
←
→
Page content transcription
If your browser does not render page correctly, please read the page content below
CONTEMPORARY EDUCATIONAL TECHNOLOGY
 ISSN: 1309-517X (Online) 2021, 13(4), ep327, https://doi.org/10.30935/cedtech/11235

OPEN ACCESS Research Article

 Assessing the Impact of Dynamic Software Environments (MATLAB) on
 Rural-Based Pre-Service Teachers’ Spatial-Visualisation Skills

 G. Amevor
 Department of Mathematics, Science, and Technology Education, University of Zululand, South Africa
 ORCID: 0000-0003-4667-0539
 Anass Bayaga
 Nelson Mandela University, Faculty of Education, Port Elizabeth, South Africa
 ORCID: 0000-0003-0283-0262
 Michael J. Bossé
 Appalachian State University, Boone, NC, USA
 ORCID: 0000-0002-5515-9460

 Received: 12 Jan 2021 Accepted: 12 Mar 2021

 Abstract
 Dynamic visual tools such as MATLAB have inbuilt features which are believed to be able to empower
 students to learn through the visualisation of three-dimensional objects. While student learning through
 MATLAB has been investigated regarding students in urban settings, only a handful of studies have
 investigated how MATLAB can assist students in rural settings. Spatial visualisation (SV) as a measure or
 reflection of one’s cognitive reasoning is affected by family social economic status (SES). For instance, it
 is argued that SES in combination with other components, do enhance cognitive development in different
 ways. What is meant is that components such as but not exclusively, economic and occupational
 components of SES may vary and hence provide opportunities for generating better understanding of
 education (cognition). In this study, we randomly selected 100 second-year rural-based pre-service
 teachers in a vector calculus class at University of Zululand (UNIZULU). Students need SV skills to learn
 vector calculus and the Purdue spatial-visualization test/rotations (PSVT/R) is well established for
 measuring individuals’ spatial reasoning. In this study, spatial reasoning skills were assessed through a
 vector calculus pre-test and through a post-test using the Purdue spatial-visualization test/rotations
 (PSVT/R). The experimental group of students learned the vector calculus topics supported by activities
 and investigations using MATLAB. Duval’s Theory of Register of Semiotic Representation (TRSR) was
 employed to comprehend the impact of MATLAB on rural-based pre-service teachers’ spatial-visualisation
 skills. From using an independent sample t-test, our findings indicated that, for participants in this study,
 using MATLAB had positive impact on the rural-based pre-service teachers’ SV skills.

 Keywords: spatial-visualisation skills, dynamic visual tool and learning, spatial reasoning, vector calculus
 and mental rotation

 INTRODUCTION
While spatial-visualisation (SV) skills are only one facet of a person’s overall intelligence, research suggests
that spatial reasoning is an important predictor of achievement in science, technology, engineering, and
mathematics disciplines (STEM) (Stieff & Uttal 2015; Uttal et al., 2013; Wai et al., 2009). Thus, spatial skills
have been considered to form the basis of several learning disciplines. Some mathematics psychology

Copyright © 2021 by the authors; licensee CEDTECH by Bastas. This article is published under the terms of the
Creative Commons Attribution License (http://creativecommons.org/licenses/by/4.0/).
Amevor et al. / Contemporary Educational Technology, 2021, 13(4), ep327

researchers have argued that the ability to rotate, compose, and decompose two- and three-dimensional
objects in space mainly describes spatial skills (Nguyen & Rebello, 2011; Price et al., 2013; Šipuš & Cizmešija,
2012; Sorby et al., 2013; Stieff & Uttal, 2016; Wai et al., 2009; Zhang et al., 2014). Also, studies have proven
that spatial-visualization skills are trainable through visual interaction (e.g., mental rotation tasks) and
dynamic software and other computer environments (Cheng & Mix, 2014; Ćurčić et al., 2018; Joshi & Rawal,
2021; Mailizar & Fan, 2021; Uttal et al., 2013). While similar conclusion has been suggested by Mailizar and
Fann (2021), Ćurčić et al. (2018) revealed that the integration of software has a link with students’ knowledge
and hence increase not only the interest in studying content, but also the teaching.
Altogether, these interconnected notions have provided researchers rich opportunities to investigate student
understanding and SV skills through the integration of dynamic software (e.g., GeoGebra, Maple, MATLAB,
CAS and other computer environments) in various learning disciplines. While this research has previously
predominately considered student learning in mostly urban settings, this study considers rural college
student learning and growth in mental rotations in the context of vector calculus using MATLAB. For example,
in comparing the ongoing studies in the investigation of impact of dynamic software environments (MATLAB)
of pre-service teachers’ spatial-visualisation skills, one key factor stands out. Thus, while ongoing research
points to pervasive usage of dynamic software environments in urban settings, little to no evidence, this far
exist in the context of rural settings particularly with the connections that link SV skills, mental rotations, and
learning through the dynamic visual tool MATLAB. Consequently, in rural -settings, little to no evidence exist
to unpack a) digital technology and learning, b) mental rotation skills as a measure of spatial reasoning skill,
c) spatial reasoning and cognitive reasoning, and d) vector calculus.
In response to such limited body of knowledge, this study explores connections linking SV skills, mental
rotations, and learning through the dynamic visual tool MATLAB. We do so through a range of conceptual
underpinnings for a) digital technology and learning, b) mental rotation skills as a measure of spatial
reasoning skill, c) spatial reasoning and cognitive reasoning, and d) vector calculus. To fully address the
impact of rural-based pre-service teachers’ spatial-visualisation using MATLAB, we draw from a theoretical
perspective on spatial visualisation of Duval’s (1995) theory of register of semiotic representation (TRSR).
While research reveals that computer-aided tools can enhance students’ spatial visualisation (SV) (often
believed to be one of the defining characteristics of intelligence), this has had limited attention in South Africa
in respect to learning vector calculus. Vector calculus integrates vectors and calculus and is extensively
applied in both mathematics and physics (Bollen, van Kampen, & De Cock, 2015; Ferrer, 2016; Fleisch, 2011;
Gire & Price, 2012).
Gire and Price (2014) found that students made many errors when sketching graphical representations of
vector fields, and they suggested that instructors should be aware that some representational features may
have two potential meanings (e.g., length, meaning both distances between points and strength of a field)
or do not match what is being represented (e.g., closer spacing in field line diagrams corresponds to a greater
magnitude). This may result from insufficient instructional emphasis focusing on graphical representations
through traditional instructional techniques. The conclusion drawn from the works of Törnkvist et al. (1993),
and Gire and Price (2014) is that students need to grasp vector concepts and apply their spatial reasoning in
vector calculus problem-solving situations.
Integral functions (i.e., integration techniques and theorems) are employed in vector calculus for the
calculation of areas bounded by curves, the volume of solids revolution, the centroid, the moment of inertia,
fluid pressure, work, etc. (Ferrer, 2016). These calculations are grounded on three theorems: Green’s
theorem, which relates to line integrals; Stokes’ theorem, relating to surface integrals; and Guass’ theorem,
regarding flux through a given surface volume integrals involving field’s divergence.
Integration of areas bounded by curves and volumes of solids of revolution require high spatial reasoning
ability including the ability to; draw a sketch or visualized 3D mathematical object in space for a given
algebraic expression; interpret a sketch with understanding; and use the 3D object as an aid to write out the
integral function (Zazkis et al., 1996). Interestingly, while some students find it easy to evaluate a given vector
integral using analytical techniques, some struggle to visualize and transform it from one coordinate system

2 / 12
Amevor et al. / Contemporary Educational Technology, 2021, 13(4), ep327

to another – a skill requiring more sophisticated problem-solving. Research suggests that imagery, spatial
skills, and multiple representations aid in cognitive reasoning enhancing problem-solving skills (Casey et al.,
2015; Rebello et al., 2012).

Objective of the Study
This study explores connections linking SV skills, mental rotations, and learning through the dynamic visual
tool MATLAB. We do so through a range of conceptual underpinnings for a) digital technology and learning,
b) mental rotation skills as a measure of spatial reasoning skill, c) spatial reasoning and cognitive reasoning,
and d) vector calculus. To fully address the impact of rural-based pre-service teachers’ spatial-visualisation
using MATLAB, we draw from a theoretical perspective on spatial visualisation of Duval’s (1995) theory of
register of semiotic representation (TRSR).

 LITERATURE REVIEW

Digital Technology and Vector Calculus Challenges in Rural Setting
Mathematics education, like other learning disciplines, incorporates digital technology to explore and
enhance teaching and learning (Andreatos et al., 2015; Phillips, Norris & Macnab, 2010). For instance: Phillips
et al. (2010) examined concept of visualization in mathematics; Baltaci and Yildiz (2015) investigated
elementary pre-service teachers use of GeoGebra in the context of 3D objects; Andreatos and Zagorianos
(2009) explored the use MATLAB in teaching control systems; and others such as Hodanbosi (2001), and
Baltaci and Yildiz (2015) offered insights to find the value of digital technology for learning.
Despite ongoing research, numerous dimensions remain ripe for further investigation, including: appropriate
pedagogical uses of digital technologies; how digital technologies are evaluated in relation to the effective
learning; and the critical analysis of teaching and learning of various mathematical topics with digital
technology. Generally accepted is that the appropriate use of digital technology can be a catalyst to greater
academic achievement. The value of technology on teaching and learning in mathematics education has been
underscored by the National Council of Mathematics Teachers (NCTM) (NCTM, 2000). The ubiquitous nature
of computers has increased the technological focus in many disciplines (e.g., STEM). Research has shown that
computer-assisted instrumental materials have a major influence on teaching and learning (Baltaci et aL.,
2001).
The noteworthy use of technology in mathematics education has led to the invention of dynamic computer
tools such as MATLAB, GeoGebra, Maple, and other computer environments (Baltaci & Yildiz, 2015). These
computer environments can empower students to think, learn, problem-solve, and grow in the visualisation
of three-dimensional objects. These computer environments are constructed with tools through which well-
designed activities can engage students to intuitively and visually investigate and manipulate various
geometric relationships between surfaces, space curves, vectors, vector fields, and other calculus related
shapes. Using these technology tools, more readily visualized are relationships between surfaces (space
curve) and rotations to gain 3D perspective (Bollen et al., 2015).

Mental Rotation Skills as a Measure of Spatial Reasoning Skills
Measuring spatial reasoning skills through the ability to perform mental rotations has received considerable
attention for decades (Hoffkamp et al., 2010; Jansen et al., 2013; Koch, 2006; Mix & Cheng, 2014; Shepard &
Metzler, 1971; Utall et al., 2013; Wai et al., 2009). For example, hinged upon the work of Osman et al. (2018),
the researchers investigated the relation in enhancing students’ mathematical problem-solving Skills through
Bar Model visualisation technique. Similar studies have been conducted (Joshi & Rawal, 2021; Mailizar & Fan,
2021). The conclusion was that students understanding, and motivation influenced performance.
Additionally, students performed positively after the implementation of the Bar Model in mathematical
problem-solving. However, one key component as suggested by Mailizar and Fann (2021) is that instructional
practices coupled with technology has ramifications with the type of tasks they set in lessons, and example
being mental rotation. Mental rotation is the ability to mentally rotate 2D or 3D object in a space. This ability

 3 / 12
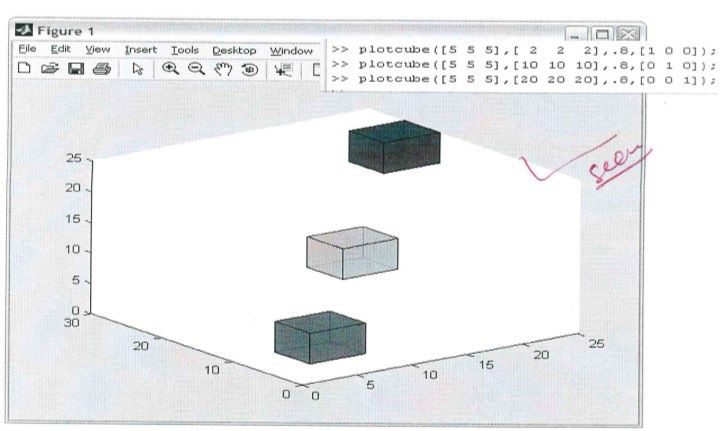
Amevor et al. / Contemporary Educational Technology, 2021, 13(4), ep327

 Figure 1. Isometric block

is measured through a number of recognized cognitive tasks: the mental rotation task (Shepard & Metzler,
1971); mental paper folding (Shephard & Feng, 1972); and the Purdue visualization rotation (Bodner & Guay,
1976). An illustrative example in Figure 1 gives an overview of spatial measurement. The ability to accurately
predict or imagine orientation of the cubes (refer to Figure 1) measures an individual’s spatial skills by
accurately providing answers to questions such as; are these two shapes different or are they identical and
merely reoriented? The dependent time coupled with providing an accurate answer to this question is
believed to measure an individual’s spatial abilities.
Researchers have also found evidence to suggest that an individual’s performance in mental rotation tasks
correlate with his/her achievement in several STEM learning disciplines (Mix & Cheng, 2014). This may
evidence that students who attain a high score in STEM disciplines tend to exhibit high spatial abilities
(Hoffkamp, 2011; Höffler, 2010; Jansen et al., 2013; Koch, 2006; Utall et al., 2013; Wai et al., 2009). Wai et
al. (2009, p. 817) advance the notion that mental rotation ability is a predictor of an individuals’ future career.
Contradicting opinions of some (Mix & Cheng, 2014; Wai et al., 2009), Sipus and Cizmesija (2012) argue that
mental skills and achievement is gender independent.
Research also identified the connection between mental rotation skills and early age (Verdine et al., 2014).
Development of mathematics aptitude and spatial reasoning are closely tied, and early spatial intelligence
predicts a child’s achievement in mathematics (Verdine et al., 2014). As a result, young children with high
visualising skills tend to perform better in mathematics achievement. This relationship may be based on
shared underlying processes.
Hence, it could be concluded that applications involving spatial skills may contribute to bridging the gaps in
assessing the impact of dynamic software environments on rural-based pre-service teachers’ spatial-
visualisation skills.

 THEORETICAL FRAMEWORK
In the context of addressing the impact of MATLAB on rural-based pre-service teachers’ spatial-visualisation,
the notion of representation plays a significant role. Duval’s (1995) theory of register of semiotic
representation (TRSR) suggests that “there’s no knowledge that can be mobilised by an individual without a
representation activity” (p. 15). The idea drawn from this is that representations mediate cognitive reasoning.
One of the distinctions of the semiotic representations is dependence on an organised system of signs such
as linguistic, algebraic, symbolic writing, and cartesian graphs. This means that all semiotic representations
must be interpreted in the context of the register in which they were formed and with an understanding of
what they clearly represent and what they cannot represent. The TRSR recognizes two cognitive actions:
treatments, which involves movement of a representation within the same registers where both registers
are associated with the exact same mathematical concept (e.g., the symbolic expression 2 − 1 is rewritten
as ( + 1)( − 1)) and conversions, where a representation in one register is translated to a representation
in a different register (e.g., the equation 2 − 4 is translated into a graph). Conservation among semiotic
representations is when the object of one representation is correctly displayed in another representation –
whether in the same or a different register.

4 / 12
Amevor et al. / Contemporary Educational Technology, 2021, 13(4), ep327

 Figure 2. Duval’s Theory of Register of Semiotic Representation (TRSR)

According to Duval’s (1995) TRSR, students often struggle to perform conversions between registers,
particularly if the conversion does not include an algorithm for mapping objects from the source to the target
register. Fortunately, upon request, technological graphical tools such as GeoGebra, Applets, and MATLAB
readily perform conversions among numeric, symbolic, and graphical representations. In the context of this
study, the 3D solid figures associated with vector integration problems are readily translated from one
coordinate system to another coordinate system, providing students with quick feedback in problem solving
in vector calculus. Thus, MATLAB could be employed to serve as a tool through which to provide learning and
assessment opportunities regarding the spatial reasoning of rural-based pre-service teachers.

 RESEARCH METHOD
One hundred rural-based pre-service teachers in second year vector calculus class at UNIZULU (case site)
were randomly selected into an experimental group (N = 50) and a control group (N = 50). A quantitative
approach was employed in this study. A pre-test (vector calculus) covering the vector calculus topics of vector
operations, double integral, and triple integral was given to all participants. These topics were chosen
because, their contents demand students’ spatial reasoning. This was then followed by teaching
interventions for both the control and experimental groups. A two-hour lesson each day for three weeks
were given to both groups by one of the researchers.
For the control group, lessons were delivered by using the lecturer’s notes and textbook whereby 2D and 3D
figures associated with vector integration were drawn on the board and explained. However, for the
experimental group the dynamic software, MATLAB was employed in teaching and learning and participants
experienced MATLAB activities covering, but not limited to; generating geometric 3D shapes (e.g., cubes,
cylinder, rectangular etcetera); viewing 3D shapes in different perspectives; vector fields, vector operations,
and performing vector integrations (refer to Figure 2).
Instruction was followed by all participants completing the post-test, the ten-items of Section A on the
PSVT/R. The PSVT/R was designed to measure the participants’ ability to visualise the rotation of three-
dimensional objects. The instrument was chosen because of its higher correlation with similar instruments
measuring visualisation such as the Shepard-Metzler tests. According to Bodner and Guay (1997), these tests
are “among the spatial test least likely to be confounded by analytic processing strategies” (p. 13). The format
for each item on the PSVT/R is that an object is pictured in one position; it is then paired with another image
which is reoriented to a different position. The participants were shown a second object and given five
choices for a pairing, one of the choices matched the rotation of the original object example pair. From which
data was collected from both groups. Ethics consideration of participants were at all times observed as well
as privacy and confidentiality of informants.

 5 / 12
Amevor et al. / Contemporary Educational Technology, 2021, 13(4), ep327

 Figure 3. A solution provided by rural-based pre-service teacher for the vector function ⃗ ( , ) = ⃗.

 Figure 4. Solution presented by rural-based pre-service teacher for the conversion of the Cartesian
 coordinate ( , , ) = (1, √3, 2) to cylindrical coordinates and a graph in cylindrical coordinates

 DATA ANALYSIS
Data was collected through a pre-test (vector calculus) and a post-test as defined below.

PRE-TEST (Vector Calculus Test)
In question 1, participants were to match the equations with their respective graphs. In all, 72% of the
participants were able to match the equations: = 3 and = 3 to their respective graphs while nearly
 2 2 2
28% of the students were able to match the equations 2 + 2 = 3, = 2 + 2 and 2 + 2 + 2 = 1 to
their respective graphs. Question 2(a) required participants to sketch and describe the vector field of the
vector function ⃗ ( , ) = ⃗. Overall, only a few of the participants (10%) sketched the vector field correctly
and provided adequate descriptions (refer to Figure 3).

Question 2.1(a) required participants to convert the coordinate �1, √3, 2� in cartesian system to cylindrical
coordinates system and question 2.2(b) required participants to sketch the cylindrical coordinates calculated
in question 2.1a above. Interestingly, while a large number of the participants (85%) were able to do the
conversion and provide the respective cylindrical coordinate equation, among these students only 15% were
able to correctly sketch the cylindrical coordinates.
Question 3.1. 3.2, and 3.3 were based on multivariate calculus. Question 3.1 required participants to make a
3D sketch of the algebraic equation 2 + + = 8. In all, nearly 13% of the participants were able to
calculate the , , and intercepts and correctly sketch the respective 3D shape. Participants found it difficult
to sketch the graph bounded by the region ℎ( ) = 2 and ( ) = 2 as requested in question 3.2.

6 / 12
Amevor et al. / Contemporary Educational Technology, 2021, 13(4), ep327

Table 1a. Group statistics on pre-test
Pre-Test Group N Mean Std. Deviation Std. Error Mean
Score Control Group 50 14.62 3.78 .535
 Experimental Group 50 15.40 3.65 .516

Table 1b. Independent Sample Test for assessing the baseline of the groups
 Levene’s Test for t-test for Equality of Means
 Equality of Variances
 F Sig. T Df Sig. (2- Mean Std. Error 95% confidence interval
 tailed) Difference Difference of the Difference
 Lower Upper
Pre -Test Equal variances .51 .48 -1.05 98 .29 -.78 .74 -2.26 695
Score assumed
 Equal variances -1.05 97.87 .29 -.78 .74 -2.26 695
 not assumed
T-Value significant at < 0.05

In question 3.3, the last item of the pre-test, most participants were unable to visualise and give a correct
sketch of a cube. However, all those who correctly sketched the cube also correctly performed the integration
of the volume.
The pre-test was administered to all 100 participants including those in the control group (N = 50) and the
experimental group (N = 50) as indicated in Table 1a. The mean pre-test score of the control group was ̅ =
14.62 with = 3.78 and the mean pre-test score for the experimental group was ̅ = 15.40 with =
3.65. An independent sampled test was further carried out to see whether or not there was significant
difference of the pre-test score between the two groups (refer to Table 1b).
From Table 1b, the mean difference between the groups was 0.78 with a t-value 1.05. Since the -value (2-
tailled) was 0.29 ( > 0.05), we have reason to conclude that there was no significant difference between
the mean pre-test score of the control group and the experimental group. This meant that control and
experimental groups were both on a similar baseline before the teaching experiment (treatment).
The pre-test was then followed by teaching interventions for both the control and experimental groups. The
control group had lessons using the lecturer’s notes and text book. The experimental group employed
MATLAB in teaching and learning activities and experienced MALTAB investigations involving, among others:
generating 3D shapes (e.g., cubes, cylinder, rectangular etcetera); viewing 3D shapes through different
perspectives; vector fields, vector operations, and performing vector integration (refer to Figures 2a and 2b).

Post-Test -Purdue Spatial-Visualisation Test/Rotation (PSVT/R)
Research evidence from many disciplines supports the claim that dynamic environments such as
MATHEMATICA, CAS, and MATLAB enhance spatial-visualisation skills. In the field of cognitive science, the
ability to accurately predict or imagine orientation of cubes with respect to the time taken is a reflection or
measure of one’s spatial-visualisation skills. The Purdue Visualisation rotation (Bodner & Guay, 1976) has
long been used to measure this aspect of spatial-visualisation skills.
The control group was used as a baseline since statistical evidence from Tables 1a and 1b indicated that the
two groups statistically possess similar prior knowledge. The ten-items of Section A on the PSVT/R was
administered to both the experimental and the control groups after the treatments. The results were
compared using the independent sampled t-test to evaluate if there was significant difference in the mean
spatial-visualisation skills difference between the two groups (refer to Tables 1a and 1b).
Table 2a shows the control group obtained the mean score of ̅ = 5.8 and = .85 whereas the
experimental group obtained the mean score of ̅ = 6.86 with = 1.18. The independent sample test
further revealed that, the mean score difference and the -values of the control group and the experimental
group (refer to Table 2b).

 7 / 12
Amevor et al. / Contemporary Educational Technology, 2021, 13(4), ep327

Table 2a. Group statistics on pre-test
Spatial- Group N Mean Std. Deviation Std. Error Mean
Visualisation Control Group 50 5.86 .86 .12
Test Score Experimental Group 50 6.86 1.18 .17

Table 2b. Independent Sample Test
 Levene’s Test for t-test for Equality of Means
 Equality of
 Variances
 F Sig. T Df Sig. (2- Mean Std. Error 95% confidence interval
 tailed) Difference Difference of the Difference
 Lower Upper
Spatial- Equal variances 13.423 .000 -4.853 98 .000 -1.000 .206 -1.409 -.591
Visualisation assumed
Score Equal variances -4.853 89.530 .000 -1.000 .206 -1.409 -.591
 not assumed
( < 0.05)

The findings presented in Table 2b show that the mean difference between the groups was 1.000 whereas
the -value was 0.00 which is lower( < 0.05). Hence, there was a statistically significant difference
between the control group and the experimental group, with the experimental group performing better than
the control group.

 DISCUSSION

Post-Test Students’ Performance Against PSV/RT
The main aim of this study was to assess the impact of MATLAB-infused instruction on rural-based pre-service
teachers’ spatial-visualisation skills. The experimental group went through MATLAB activities as previously
described.

Laboratory Activities
Instructional treatments were followed by an assessment test to assess the impact of the MATLAB on the
pre-service teachers’ spatial-visualisation skills. After a post-test, descriptive statistics and an independent
sample t-test were used and revealed that the experimental group performed significantly better than the
control group (refer Tables 2a and 2b). This finding is consistent with some relevant literature which have
evidenced that computer-based 3D visualisations support spatial-visualisation skills (Arıcı et al., 2015; Cheng
& Mix 2014; Joshi & Rawal, 2021; Mailizar & Fan, 2021). Generating and viewing geometric figures in space,
cubes arrangement, and predicting the orientations of cubes are factors identified to have a link with spatial-
visualisation skills (Arıcı et al., 2015; Cheng & Mix 2014; Uttal et al., 2013). The positive effects of using
MATLAB may stem from the dynamic visual features that enable the creation and animation of 3D display on
the screen. The results obtained from Purdue spatial-visualisation/rotation test revealed that the
experimental group developed spatial-visualisation skills while learning vector calculus with MATLAB (refer
to Table 2a and 2b). This finding appears to support the theory by Cheng and Mix (2014), Uttal et al. (2013),
Arıcı et al. (2015) that spatial-visualisation skills are trainable through dynamic visual tools in the context of
manipulation and orientation of geometric shapes.
Previously, Shepard and Metzler (1971) made strong arguments about an association between physical
manipulation or rotations of the cubes (i.e., mental rotation task) and spatial-visualisation skills. They further
claimed that these two variables (mental rotation tasks and spatial-visualisation skills) both share a link with
ones’ cognitive reasoning. Hubbard et al. (2005), and Park and Brannon (2013) deepened this argument
claiming that there are interconnections among mental rotation, spatial-visualisation, and mathematics
achievement. This is consistent with the findings with this study.

8 / 12
Amevor et al. / Contemporary Educational Technology, 2021, 13(4), ep327

 Laboratory activity 2: Run the following code using the Matlab

 (a)
 Laboratory activity 3: Use the Matlab to generate cube boxes

 (b)
 Figure 5. A worksheet presented by student (EG015) from the experimental class run the code given to
 generate vector field and the generating 3D shape with the MATLAB respectively

According to Duval (1995), representation plays a significant role regarding learning and cognitive reasoning.
Drawing from this theory, pre-test questions and learning activities for both the control and experimental
groups involved the translation of mathematical representations from one register to another. This led to
increases in participants’ spatial-visualisation skills as measured by their ability to correctly interpret
rotations of solids on the post-test.
The experimental group’s greater increase in spatial-visualisation score (refer Table 2a and 2b) than the
control group supports the claim by Hubbard et al. (2005) and Park and Brannon (2013) that there is a shared
link between the dynamic visual tool, MATLAB, mental rotation skills, and spatial-visualisation. From the
results obtained in this study, rural-based pre-service teachers can grow in spatial-visual skills.

 CONCLUSION AND FUTURE RESEARCH
From the empirical evidence gathered from the research results, we found that the use of MATLAB as a
pedagogical tool in traditional classrooms mediates spatial-visualisation skills. Hence, we can conclude that
the use of computer and technology dynamic software can be equally employed in rural-based universities
to enhance their spatial reasoning skills for smooth mediation of learning. Drawn from the results of the

 9 / 12
Amevor et al. / Contemporary Educational Technology, 2021, 13(4), ep327

current study and in relation to (1) the positive effects of using MATLAB as well as (2) the fact that findings
tend to support the theory by Arıcı et al. (2015) and hence (3) improving SV skills: It is accordingly important
to situate rural-setting teaching in a) digital technology (MATLAB) and learning, while drawing on spatial
reasoning and cognitive reasoning and other mathematical concepts.
 Author contributions: All authors were involved in concept, design, collection of data, interpretation, writing, and critically
 revising the article. All authors approved final version of the article.
 Funding: The authors received no financial support for the research and/or authorship of this article.
 Declaration of interest: Authors declare no competing interest.
 Data availability: Data generated or analysed during this study are available from the authors on request.

 REFERENCES
Andreatos, A. S., & Zagorianos, A. (2009). MATLAB GUI application for teaching control systems. In
 Proceedings of the 6th WSEAS International Conference on engineering education, 208-218.
Arıcı, S., & Aslan-Tutak, F. (2015). The effect of origami-based instruction on spatial visualization, geometry
 achievement, and geometric reasoning. International Journal of Science and Mathematics Education,
 13(1), 179-200. https://doi.org/10.1007/s10763-013-9487-8
Baltaci, S., & Yildiz, A. (2015). GeoGebra 3D from the Perspectives of Elementary Pre-Service Mathematics
 Teachers Who Are Familiar with a Number of Software Programs. Online Submission, 10(1), 12-17.
Bodner, G. M., & Guay, R. B. (1997). The Purdue visualization of rotations test. The Chemical Educator, 2(4),
 1-17. https://doi.org/10.1007/s00897970138a
Bollen, L., van Kampen, P., & De Cock, M. (2015). Students’ difficulties with vector calculus in
 electrodynamics. Physical Review Special Topics-Physics Education Research, 11(2), 234-250.
 https://doi.org/10.1103/PhysRevSTPER.11.020129
Casey, B. M., Pezaris, E., Fineman, B., Pollock, A., Demers, L., & Dearing, E. (2015). A longitudinal analysis of
 early spatial skills compared to arithmetic and verbal skills as predictors of fifth-grade girls’ math
 reasoning. Learning and Individual Differences, 40, 90-100.
 https://doi.org/10.1016/j.lindif.2015.03.028
Ćurčić, M., Milinković, D. and Radivojević, D. (2018). Educational Computer Software in the Function of
 Integrating and Individualization in Teaching of Mathematics and Knowledge of Nature. EURASIA
 Journal Maths, Science and Technology Education 14(12). 1607-1619.
 https://doi.org/10.29333/ejmste/93808
Duval, R. (1995). Representation, Vision and Visualization: Cognitive Functions in Mathematical Thinking.
 Basic Issues for Learning. Sage.
Ferrer, F. P. (2016). Investigating students’ learning difficulties in integral calculus. People: International
 Journal of Social Sciences, 2(1), 45-57. https://doi.org/10.20319/pijss.2016.s21.310324
Fleisch, D. A. (2011). A student’s guide to vectors and tensors. Cambridge University Press.
 https://doi.org/10.1017/CBO9781139031035
Gire, E., & Price, E. (2012). Graphical representations of vector functions in upper-division E&M. In AIP
 Conference Proceedings, 141(1), 27-30. https://doi.org/10.1063/1.3679985
Hodanbosi, C. L. (2001). A comparison of the effects of using a dynamic geometry software program and
 construction tools on learner achievement. Kent State University.
Hoffkamp, A. (2011). The use of interactive visualizations to foster the understanding of concepts of calculus:
 design principles and empirical results. ZDM, 43(3), 359-372. https://doi.org/10.1007/s11858-011-
 0322-9

10 / 12
Amevor et al. / Contemporary Educational Technology, 2021, 13(4), ep327

Höffler, T. N. (2010). Spatial ability: Its influence on learning with visualizations—a meta-analytic review.
 Educational psychology review, 22(3), 245-269. https://doi.org/10.1007/s10648-010-9126-7
Hubbard, E. M., Piazza, M., Pinel, P., & Dehaene, S. (2005). Interactions between number and space in parietal
 cortex. Nature Reviews Neuroscience, 6(6), 435-450. https://doi.org/10.1038/nrn1684
Jansen, P., Schmelter, A., Quaiser-Pohl, C., Neuburger, S., & Heil, M. (2013). Mental rotation performance in
 primary school age children: Are there gender differences in chronometric tests? Cognitive
 Development, 28(1), 51-62. https://doi.org/10.1016/j.cogdev.2012.08.005
Joshi, D. R., & Rawal, M. (2021). Mathematics Teachers Standing on the Utilization of Digital Resources in
 Kathmandu, Nepal. Contemporary Mathematics and Science Education, 2(1), 45-67.
 https://doi.org/10.30935/conmaths/9679
Koch, D. S. (2006). The effects of solid modeling and visualization on technical problem solving (Doctoral
 dissertation), Virginia Tech.
Mailizar, M., & Fan, L. (2021). Secondary School Mathematics Teachers’ Instructional Practices in the
 Integration of Mathematics Analysis Software (MAS). International Electronic Journal of Mathematics
 Education, 16(1). 45-68. https://doi.org/10.29333/iejme/9293
Mix, K. S., & Cheng, Y. L. (2012). The relation between space and math: Developmental and educational
 implications. In Advances in child development and behavior, 42, 197-243.
 https://doi.org/10.1016/B978-0-12-394388-0.00006-X
National Council of Teachers of Mathematics (NCTM) (2000). Principles and standards for school
 mathematics. Sage.
Nguyen, D. H., & Rebello, N. S. (2011). Students’ Difficulties with Multiple Representations in Introductory
 Mechanics. Online Submission, 8(5), 559-569.
Osman, S., Che Yang, C.A., Salleh Abu, M., Ismail, N., Jambari, H., & Amantha Kumar, J. (2018). Enhancing
 Students’ Mathematical Problem-Solving Skills through Bar Model Visualisation Technique.
 International Electronic Journal of Mathematics Education, 3(3), 273-279.
 https://doi.org/10.12973/iejme/3919
Park, J., & Brannon, E. M. (2013). Training the approximate number system improves math proficiency.
 Psychological science, 24(10), 2013-2019. https://doi.org/10.1177/0956797613482944
Phillips, L. M., Norris, S. P., & Macnab, J. S. (2010). The Concept of Visualization. In Visualization in
 Mathematics, Reading and Science Education. Springer. https://doi.org/10.1007/978-90-481-8816-
 1_3
Price, G. R., Mazzocco, M. M., & Ansari, D. (2013). Why mental arithmetic counts: brain activation during
 single digit arithmetic predicts high school math scores. Journal of Neuroscience, 33(1), 156-163.
 https://doi.org/10.1523/JNEUROSCI.2936-12.2013
Rebello, N. S., Engelhardt, P. V., & Singh, C. (2012). 2011 Physics education research conference. In American
 Institute of Physics Conference Series, 1413-1419. https://doi.org/10.1063/1.3679980
Shepard, R. N., & Feng, C. (1972). A chronometric study of mental paper folding. Cognitive psychology, 3(2),
 228-243. https://doi.org/10.1016/0010-0285(72)90005-9
Shepard, R. N., & Metzler, J. (1971). Mental rotation of three-dimensional objects. Science, 171(3972), 701-
 703. https://doi.org/10.1126/science.171.3972.701
Šipuš, Ž. M., & Cizmešija, A. (2012). Spatial ability of students of mathematics education in Croatia evaluated
 by the Mental Cutting Test. Annal of Maths Information, 40, 203-216.

 11 / 12
Amevor et al. / Contemporary Educational Technology, 2021, 13(4), ep327

Sorby, S., Casey, B., Veurink, N., & Dulaney, A. (2013). The role of spatial training in improving spatial and
 calculus performance in engineering students. Learning and Individual Differences, 26, 20-29.
 https://doi.org/10.1016/j.lindif.2013.03.010
Stieff, M., & Uttal, D. (2015). How much can spatial training improve STEM achievement?. Educational
 Psychology Review, 27(4), 607-615. https://doi.org/10.1007/s10648-015-9304-8
Tokpah, C. L. (2008). The effects of computer algebra systems on students’ achievement in mathematics
 (Doctoral dissertation), Kent State University.
Törnkvist, S., Pettersson, K. A., & Tranströmer, G. (1993). Confusion by representation: On student’s
 comprehension of the electric field concept. American Journal of physics, 61(4), 335-338.
 https://doi.org/10.1119/1.17265
Uttal, D. H., Meadow, N. G., Tipton, E., Hand, L. L., Alden, A. R., Warren, C., & Newcombe, N. S. (2013). The
 malleability of spatial skills: A meta-analysis of training studies. Psychological bulletin, 139(2), 352.
 https://doi.org/10.1037/a0028446
Verdine, B. N., Golinkoff, R. M., Hirsh‐Pasek, K., Newcombe, N. S., Filipowicz, A. T., & Chang, A. (2014).
 Deconstructing building blocks: Preschoolers’ spatial assembly performance relates to early
 mathematical skills. Child development, 85(3), 1062-1076. https://doi.org/10.1111/cdev.12165
Wai, J., Lubinski, D., & Benbow, C. P. (2009). Spatial ability for STEM domains: Aligning over 50 years of
 cumulative psychological knowledge solidifies its importance. Journal of Educational Psychology,
 101(4), 817. https://doi.org/10.1037/a0016127
Zazkis, R., Dubinsky, E., & Dautermann, J. (1996). Coordinating visual and analytic strategies: A study of
 students’ understanding of the group D 4. Journal for research in Mathematics Education, 27(4), 435-
 457. https://doi.org/10.2307/749876
Zhang, X., Koponen, T., Räsänen, P., Aunola, K., Lerkkanen, M. K., & Nurmi, J. E. (2014). Linguistic and spatial
 skills predict early arithmetic development via counting sequence knowledge. Child Development,
 85(3), 1091-1107. https://doi.org/10.1111/cdev.12173

Correspondence: Anass Bayaga, Nelson Mandela University, Faculty of Education, Port Elizabeth, South
Africa. E-mail: anass.bayaga@mandela.ac.za

12 / 12
You can also read