Current challenges in thermodynamic aspects of rubber foam
←
→
Page content transcription
If your browser does not render page correctly, please read the page content below
www.nature.com/scientificreports
OPEN Current challenges
in thermodynamic aspects
of rubber foam
Supitta Suethao1, Worachai Ponloa1, Saree Phongphanphanee1, Jirasak Wong‑Ekkabut1,2 &
Wirasak Smitthipong1,3,4*
Natural rubber (NR) foam can be prepared by the Dunlop method using concentrated natural latex
with chemical agents. Most previous studies have focused on the thermodynamic parameters of
solid rubber in extension. The main objective of this study is to investigate the effect of the NR
matrix concentration on the static and dynamic properties of NR foams, especially the new approach
of considering the thermodynamic aspects of NR foam in compression. We found that the density
and compression strength of NR foams increased with increasing NR matrix concentration. The
mechanical properties of NR foam were in agreement with computational modelling. Moreover,
thermodynamic aspects showed that the ratio of internal energy force to the compression force, Fu/F,
and the entropy, S, increased with increasing matrix concentration. The activation enthalpy, ∆Ha, also
increased with increasing matrix concentration in the NR foam, indicating the greater relaxation time
of the backbone of the rubber molecules. New scientific concepts of thermodynamic parameters of the
crosslinked NR foam in compression mode are proposed and discussed. Our results will improve both
the knowledge and the development of rubber foams based on the structure–properties relationship,
especially the new scientific concept of the thermodynamical parameters under compression.
Polymer foams are formed by adding gas bubbles to the polymer matrix, leading to porosity and polymer continu-
ous phases. The porosity, otherwise known as the cells, can be classified from its structure as either open–cell or
closed–cell. The open–cell foam drives the flexibility, whereas the closed–cell foam drives the rigidity. Therefore,
product applications depend on the structural properties of the f oam1–4.
Natural rubber (NR) foam is an interesting natural polymer foam which can be made into lightweight prod-
ucts and is suitable for comfort applications such as pillows and mattresses. Generally, rubber foams are porous,
elastic and have a ventilated s urface5,6. Rubber foam has good e lasticity7, and its mechanical properties can be
tuned with the choice of the type of latex, foam structure, and filler loading, for e xample7–10.
olecules11. Rubber
The most important characteristic of a rubber material is that it consists of long flexible m
molecules have a backbone of many covalent bonds which can rotate rapidly because of thermal agitation. Such
long molecules convert their form easily at specific temperatures due to Brownian motion12,13. When no force is
applied, they make random conformations but may adopt specific conformations if an external force is loaded.
Changes in rubber elasticity are associated with changes in the configurational entropy and the system’s internal
energy during the deformation p rocess7. For any elastic mechanism in extension mode, the stretching force is
proportional to the temperature at a given state of strain. The thermodynamic study of the elastic deformation
in rubber has shown that the stress depends significantly on the temperature in the extended state. It is pos-
sible to derive the separate contributions of the internal energy and entropy to the deformation process. The
early experiments of Meyer and Ferri14 showed this statement to be substantially correct over a wide range of
temperatures, provided that the extension was sufficiently large. The elastic behaviour seems to be irregular at
lower strains because the force increases more slowly than would be expected from the theory. The deviations
from the theoretical form of the force–extension curve for mechanical extension have been extensively studied
by previous workers15–17; however, Mooney and Rivlin proposed a semi–empirical formula consistent with the
experiment, referred to as the Mooney–Rivlin e quation18,19.
1
Specialized Center of Rubber and Polymer Materials in Agriculture and Industry (RPM), Department of Materials
Science, Faculty of Science, Kasetsart University, Bangkok 10900, Thailand. 2Department of Physics, Faculty
of Science, Kasetsart University, Bangkok 10900, Thailand. 3Office of Research Integration on Target‑Based
Natural Rubber, National Research Council of Thailand (NRCT), Bangkok 10900, Thailand. 4Office of Natural
Rubber Research Program, Thailand Science Research and Innovation (TSRI), Bangkok 10900, Thailand. *email:
fsciwssm@ku.ac.th
Scientific Reports | (2021) 11:6097 | https://doi.org/10.1038/s41598-021-85638-z 1
Vol.:(0123456789)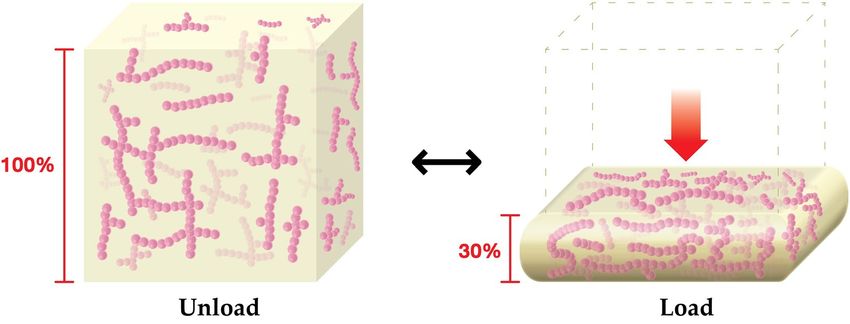
www.nature.com/scientificreports/
Control + 10% NR or control added 10% Control − 10% NR or control reduced
Chemical agents NR (g) Control (g) 10% NR (g)
60% concentrated natural latex 183.33 166.67 150.00
10% potassium oleate solution 16.50 16.50 16.50
50% sulphur dispersion 4.00 4.00 4.00
50% ZDEC dispersion 2.00 2.00 2.00
50% ZMBT dispersion 2.00 2.00 2.00
50% Wingstay L dispersion 2.00 2.00 2.00
50% ZnO dispersion 10.00 10.00 10.00
33% DPG dispersion 2.00 2.00 2.00
12.5% SSF dispersion 8.00 8.00 8.00
Table 1. Chemical agents used for the preparation of various foam samples.
When non–Gaussian theory14,16 has been applied to the experimental data at high strain process, the possible
effects of strain–induced crystallisation on the mechanical properties of solid rubber have not been taken into
account. The non–Gaussian theory of the strain state is significant within the crystallisation region, and it has
been suggested that the rise of the force–deformation curve should be attributed primarily to this factor20. The
crystallisation that occurs would certainly be expected to produce some stiffening of the rubber, but it is not easy
to predict the magnitude of the effect. However, it has been noted by Wang and Guth21 that the characteristic
form of the force–extension curve for natural rubber is only slightly affected by increasing the temperature to
100 °C, though this will substantially reduce the crystallinity. Most existing studies investigated the solid rubber
in extension mode; fewer studies have focused on the thermodynamics of polymer foams, especially rubber
foam7,22. In the present work, a new scientific concept of the thermodynamic parameters of the natural rubber
(NR) foam is investigated. The mechanical properties are modelled. In particular, we consider some features of
the compression of crosslinked rubber foams which are still not fully understood.
Materials and methods
Materials. The concentrated natural latex (60% dry rubber content and 1.7% non–rubber content), from
Hevea brasiliensis in the southern part of Thailand, was supplied from Num Rubber & Latex Co., Ltd., Trang,
Thailand. The chemical agents consist of 10% potassium oleate solution, 50% sulphur dispersion, 50% zinc
diethyldithiocarbamate (ZDEC) dispersion, 50% zinc–2–mercaptobenzothiazole (ZMBT) dispersion, 50%
Wingstay L dispersion, 50% zinc oxide (ZnO) dispersion, 33% diphenylguanidine (DPG) dispersion, and 12.5%
sodium silicofluoride (SSF) dispersion. All the chemical agents were supplied from Thanodom Technology Co.,
Ltd., Thailand. The chemical agents used for the rubber foam preparation are summarised in Table 1.
Rubber foam preparation. The rubber foams were prepared in the following way: first, concentrated
natural latex was stirred 80 rpm in a blender for 1 min to remove the ammonia. Second, the potassium oleate
solution was added as the stirring speed was increased to 160 rpm for 10 min. Then, dispersions of sulphur,
ZDEC, ZMBT and Wingstay L were added to the rubber compound with the stirring speed decreased to 80 rpm
for 1 min. Next, ZnO and DPG dispersions were added into the rubber compound at the same mixing speed for
1 min. After that, the SSF dispersion was added into the rubber compound and mixing continued until the rub-
ber foam had nearly reached the gel point. Finally, the rubber foam was transferred to a mould and allowed to
set for 45 min. The vulcanisation of the rubber foam was performed by a hot air oven at 90 °C for 2 h. The rubber
foam was then removed from the mould, washed, and dried in the hot air oven at 70 °C for 4 h.
Rubber foam characterisation. The density (kg/m3) of the foam was evaluated by the relationship
between the weight (kg) and volume (m3) of the foam as described elsewhere9.
The chemical functional groups present in the foam sample were measured by Attenuated Total Reflec-
tion–Fourier Transform Infrared (ATR–FTIR) spectroscopy with a Ge crystal probe (VERTEX 70, Bruker, Bill-
erica, MA, USA).
The morphology of foam samples was examined by a scanning electron microscope (SEM, FEI, Quanta 450,
Eindhoven, Netherlands). The foam sample was coated with gold, and three replicants of each foam formula
were tested. ImageJ s oftware23 was used to evaluate the average pore size and porosity of the foam samples. The
cell density (dcell) of the foam sample was calculated as in a previous study7 for comparison with the solid phase
density of natural rubber (NR 0.93 g/cm3).
The compression stress of a foam sample as a function of strain was determined by a texture analyser (TA.
XT Plus, Stable Micro Systems, Godalming, Surrey, UK) with a platen probe of 100 mm diameter at 0.1 mm/
sec and room temperature.
The computational modelling of the mechanical properties of the foam sample used the hyperfoam–polyno-
mial strain energy function from 1st to 6th o rder24. The finite element method (FEM) and curve–fitting analysis
of foam sample data were performed using A BAQUS25 under uniaxial compression.
The relationship between the stress, σ, and the compression limit, λ, of each foam sample was plotted on the
Mooney–Rivlin Eq. 26 where C1 and C2 were the constant values:
Scientific Reports | (2021) 11:6097 | https://doi.org/10.1038/s41598-021-85638-z 2
Vol:.(1234567890)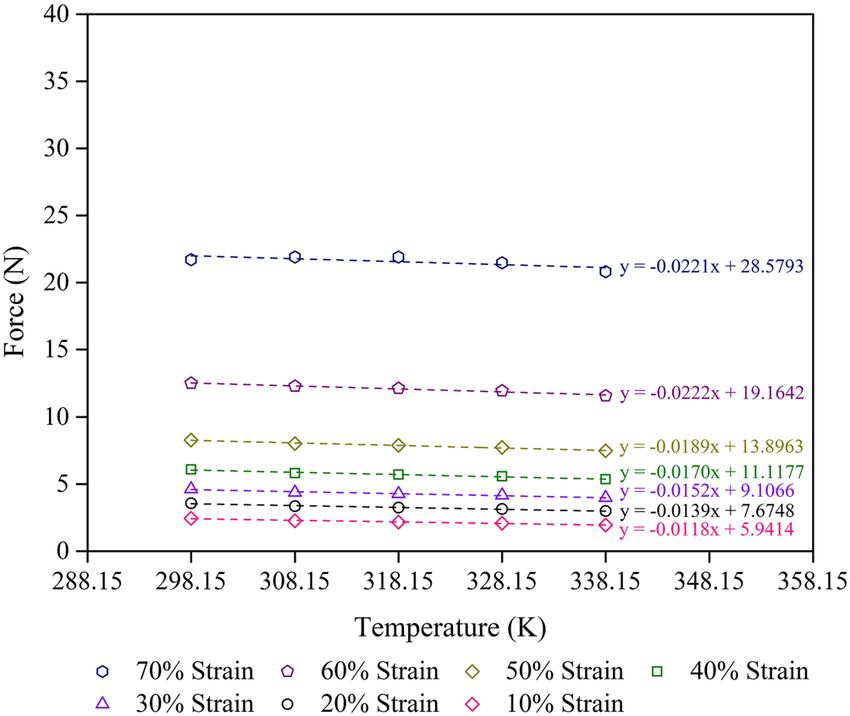
www.nature.com/scientificreports/
Figure 1. ATR–FTIR spectrum of the control sample: 3015–2970 cm−1 attribute to C–H stretching of CH3 and
CH2, 1672 cm−1 attributes to C=C stretching, 935–1171 cm−1 attribute to C–S stretching, and 840 cm−1 attributes
to C=C wagging9.
σ 1
= 2C1 + 2C2
(1)
1
− 2
The crosslinking density of the foam samples was evaluated by the swelling method according to the
Flory–Rehner equation27–31. We also used the Flory–Huggins equation to calculate the change in Gibbs free
energy, ∆G, and entropy, ∆S, as follows32,33:
�G = RT ln(1 − Vr ) + Vr + V2r (2)
G
S = − (3)
T
where Vr is the volume fraction of foam sample in the rubber network, χ is the parameter between the foam
sample and the solvent interaction (defined as 0.43 + 0.05 Vr)28, R is the ideal gas constant (8.3145 J/mol·K), and
T is the test temperature (298.15 K).
The thermodynamic parameters of the foam sample compression were measured by the texture analyser
(TA.XT Plus, Stable Micro Systems, Godalming, Surrey, UK). The foam sample was also incubated at different
temperatures (298.15, 308.15, 318.15, 328.15, and 338.15 K) during the compression process from 10 strain
to 70% strain. Next, the relationship between force and temperature was plotted to obtain the ratio of internal
energy to the compression force, F u/F.
The activation enthalpy of the transition process, ∆Ha, of the foam sample was evaluated by dynamic mechani-
cal analysis (DMA1, Mettler Toledo, Columbus, OH, USA) from − 193.15 to 353.15 K. From this, the ∆Ha value
of the foam sample can be calculated as described elsewhere33.
Results and discussion
Here we investigate the underlying thermodynamic relations of these rubber foam phenomena in more detail
and explore how they may be applied experimentally to obtain quantitative information about the deformation
process mechanism.
Physical and morphological properties. First, we discuss the chemical function of the rubber foams.
Figure 1 presents an ATR–FTIR spectrum of the control s ample7,9 from 500 to 4000 cm−1, this result confirmed
the chemical functional group of crosslinked NR foam. However, there are no significant differences between
the spectra of the foam samples, even at different rubber concentrations. To investigate the density of the rubber
foams (Table 2), rubber foam samples of each type with the same volume (4.86 × 10⁻⁵ m3) were prepared. Each
rubber foam sample was weighed in kilograms. The results showed that the amount of matrix has a significant
effect on the density of the foam sample. The density of the foam sample decreased by around 10% when the
matrix was reduced by 10%, while the addition of 10% matrix content increased the density of the foam sample
of around 10%.
Scientific Reports | (2021) 11:6097 | https://doi.org/10.1038/s41598-021-85638-z 3
Vol.:(0123456789)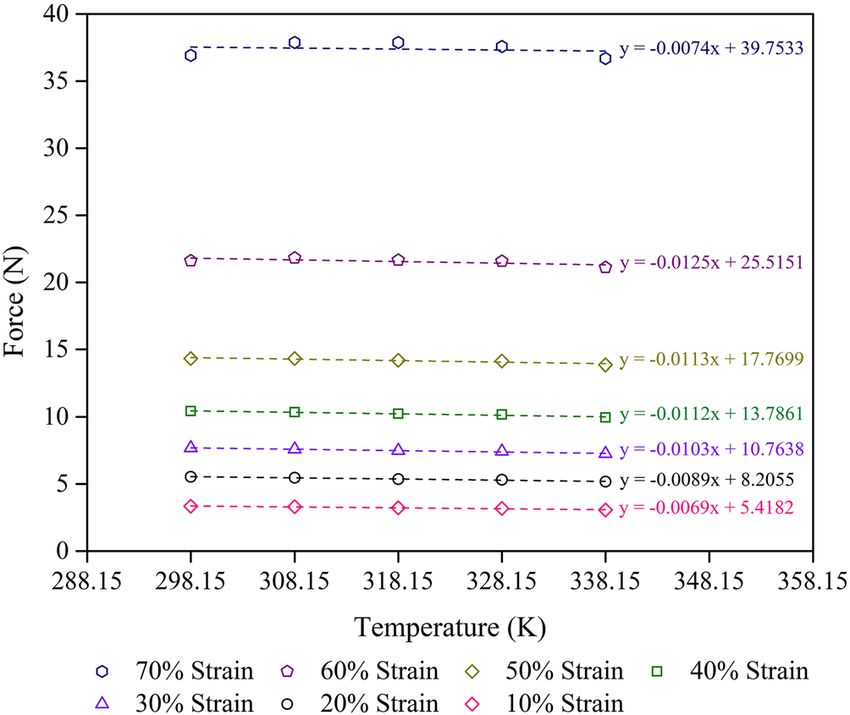
www.nature.com/scientificreports/
Sample Foam density (± 3 kg/m3) Average pore size (± 150 µm) Porosity (± 1.00%) Cell density (± 500 cm-3)
Control + 10% NR 123 352 45.97 38,054
Control 110 522 48.73 11,844
Control − 10% NR 99 555 55.37 9,966
Table 2. Foam density, average pore size, porosity, and cell density of various foam samples.
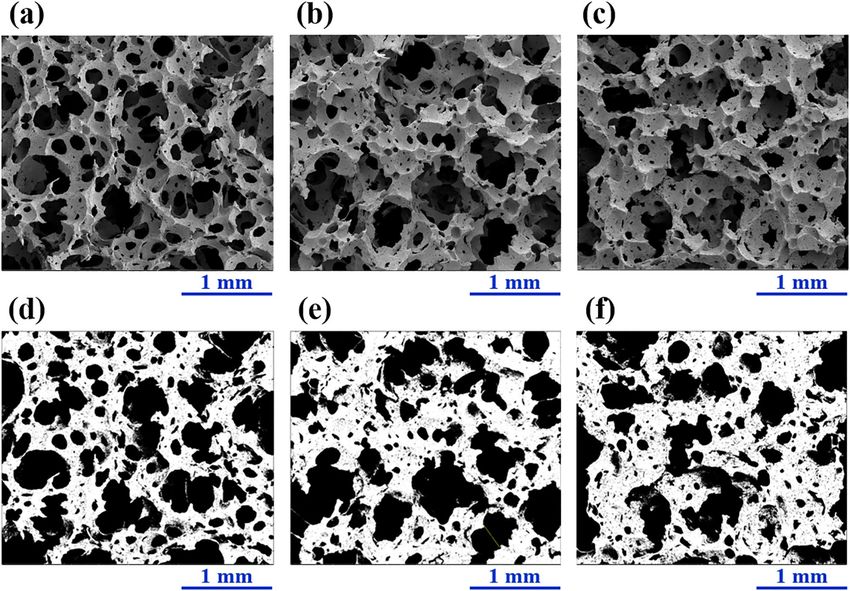
Figure 2. SEM images of the various foam samples at 50× magnification: (a) control − 10% NR, (b) control, and
(c) control + 10% NR. Images of various foam samples from ImageJ analysis: (d) control − 10% NR, (e) control,
and (f) control + 10% NR. The white areas are related to the interconnected foam, whereas the black areas relate
to the pore or cell.
In terms of the morphological properties, the images obtained from the SEM are presented in Fig. 2. We
found that all the foam samples exhibited the open–cell structure with heterogeneous sizes of bubble (heteroge-
neous pore size), a known effect of the Dunlop process34,35. However, the amount of NR matrix present affects
the morphological properties of the foam samples. The foam of samples with a higher NR concentration is more
interconnected (Fig. 2a–c), which agrees with the density measurements. The ImageJ software23 was used to
evaluate the morphological parameters of the foam samples (Fig. 2d–f and Table 2). In Fig. 2d–f, the white areas
are related to the interconnected foam, while the black areas relate to the pore or cell. The average pore size and
porosity calculated by ImageJ analysis decrease with the increasing amount of NR matrix (Table 2). This trend is
in good agreement with other works investigating the effects of filler concentration and the type of NR matrix on
the properties of foams7,9. The cell density, calculated in a previous s tudy36, is in good agreement with the SEM
images and ImageJ analysis results. The cell density of the foam samples increases with increasing NR matrix
concentration. However, the present values of cell density are higher than those of our previous w ork7, because
foam samples used in our current study have higher densities than in the previous study.
Mechanical properties. Figure 3 shows the stress–strain curves from experiments and hyperfoam mate-
rial modelling of rubber foam samples. For the reduced polynomial model used in this study, the 6th order is
in good agreement with the experimental result. Table 3 presents the parameters from the fit to the 6th order,
Scientific Reports | (2021) 11:6097 | https://doi.org/10.1038/s41598-021-85638-z 4
Vol:.(1234567890)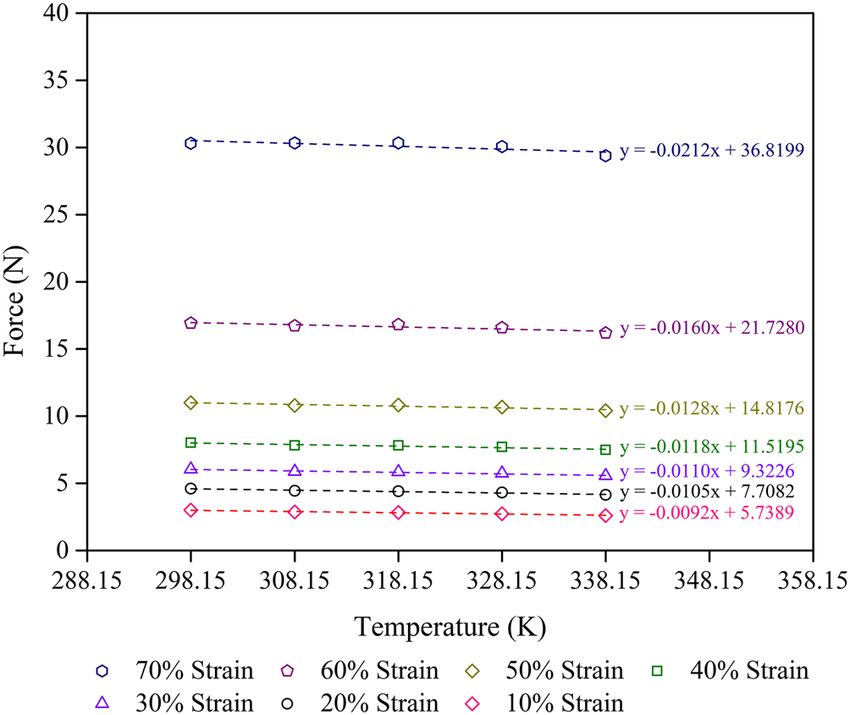
www.nature.com/scientificreports/
Figure 3. Compression stress–strain curves of foam samples from the experimental data and the computation
of the 6th order reduced polynomial model.
Sample C10 (10–2) C20 (10–5) C30 (10–9) C40 (10–12) C50 (10–16) C60 (10–20) µ0(10–1)
Control + 10% NR 5.47 − 0.84 2.62 − 0.03 − 0.44 0.59 1.10
Control 7.33 − 1.93 8.47 − 1.78 2.04 − 0.78 1.47
Control − 10% NR 5.53 − 1.86 9.43 − 2.32 3.00 − 1.42 1.11
Table 3. Modelling parameters from the 1st to 6th order of the reduced polynomial for the foam samples.
and the computer modelling of the foam samples in compression is in good agreement with the experimental
results (Fig. 3). Concerning the compression strength, which is the maximum compression stress at 75% from
the rubber foam surface, we found that the compression strength increases with increasing NR matrix content.
This result is in agreement with the density of the foam samples. Generally, NR exhibits good mechanical prop-
erties because it has a high molecular w eight8,37. Interestingly, the mechanical property, compression strength,
is more sensitive to the matrix content than the density. The compression strength of rubber foam is decreased
around 37% by a 10% reduction in matrix content while 10% addition to the matrix content results in an increase
of compression strength of around 23%. In general, the compressive axial tests of foams show three main dis-
tinct regions38. The deformation process starts with an initial linear elastic response on cell edges or cell walls.
Deformations are increasing and leading to the cell starts to collapse while stresses remain roughly unchanged,
known as the plateau region. This effect results in the ability to absorb impact and vibrating loading. This col-
lapse progresses until opposing walls meet and touch. After the opposing walls touch, the deformation stops
with increasing stresses (densification or locking) i.e. cellular solids exhibit deformation until the densification
is reached. Alzoubi et al.39 showed that the natural latex is highly elastic and low viscous characteristics than
any other foam samples such as Polyurethane. Therefore, the latex material has no clear distinct three regions as
the case for other samples. However, at high strains, the cell walls of NR foam are completely collapsed: higher
compression strength is represented by a higher concentration of the NR matrix.
The mechanical properties of rubber foam can also be investigated in terms of the stress, σ, and the compres-
sion limit, λ, based on the Mooney–Rivlin equation26 (Fig. 4). We found that the slope of the straight line above
1.5 at x–axis for all samples is almost identical. The y–intercept for all samples is related to the crosslinking density
of the foam samples; higher crosslinking density is represented by a higher absolute value of the y–intercept. The
resulting pattern of curves is in good agreement with the Mooney–Rivlin experiment25, although our curves
were in the opposite direction compared to the Mooney–Rivlin result. However, the Mooney–Rivlin result was
obtained in extension mode of solid rubber while our study was in compression mode of rubber foam.
Thermodynamic aspects. Based on the crosslinking density of the foam samples, a foam with higher NR
matrix concentration possesses a higher volume fraction of rubber, Vr, and greater crosslinking density. We can
calculate the change in the Gibbs free energy, ∆G, and entropy, ∆S, from the swelling test based on the Flory–
Huggins equation32,33; results are given in Table 4. A negative ∆G was found for all the foam samples, and the ∆G
decreases with increasing NR matrix concentration. Moreover, ∆S increases with increasing matrix concentra-
tion, which indicates favourable thermodynamics. This is because of the NR matrix concentration on the foam
sample: rubber with good mechanical properties (high compression strength and modulus) and high relaxation
stress result in a more thermodynamically favourable system7,16.
Scientific Reports | (2021) 11:6097 | https://doi.org/10.1038/s41598-021-85638-z 5
Vol.:(0123456789)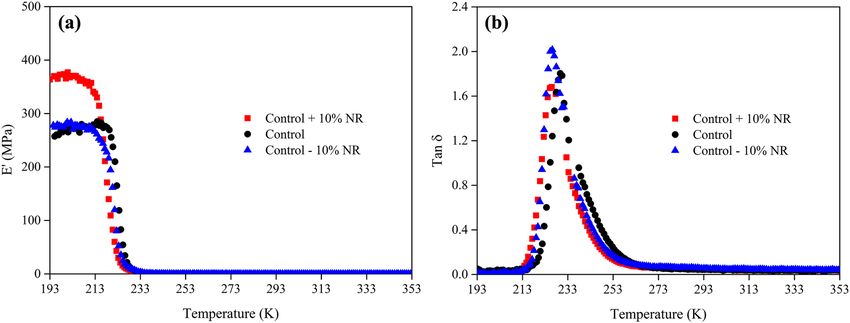
www.nature.com/scientificreports/
Figure 4. The relationship of stress, σ, and compression limit, λ, of foam samples based on the Mooney–Rivlin
Eq. 26. The relative scatter on the results is estimated equal to about 5%.
Sample Volume fraction of rubber, Vr (± 0.001% a.u.) ΔG (J/mol) ΔS (J/mol K)
Control + 10% NR 0.2605 − 36.7143 0.1231
Control 0.2595 − 36.3674 0.1220
Control − 10% NR 0.2575 − 35.6386 0.1195
Table 4. Thermodynamic parameters determined from the crosslinking density of various foam samples
based on the Flory–Huggins equation32,33.
Figure 5. Unloaded (left) and loaded at z–direction (right) models of rubber foam samples. Unloaded rubber
molecules (pink lines) have freedom to move, whereas loaded rubber molecules cannot move and rubber foam
is expanded at x– and y–directions due to the compression. The model was drawn using Adobe illustrator
software vision 24.2.340.
It is extremely interesting to investigate the thermodynamic aspects of rubber foam related to the mechani-
cal properties in more detail. We focused on the compression of the foam samples. The compression force came
exclusively from an entropic mechanism, for example, from the tendency of the rubber molecule to transform to
random conformations. The compression force was then directly proportional to the absolute temperature14–16.
Figure 5 illustrates the model of the unloaded foam sample, which corresponds to a high degree of freedom
for the rubber molecules, and the model of the loaded foam sample from compression, which corresponds to a
lower degree of freedom for the rubber molecules. When the compression force is unloaded, the foam sample
returns to its original shape, which is more favourable in terms of the entropy, S, of the entangled molecules.
Consider the consequence of an external force causing compression on a rubber foam. The first law of ther-
modynamics can be written41:
Scientific Reports | (2021) 11:6097 | https://doi.org/10.1038/s41598-021-85638-z 6
Vol:.(1234567890)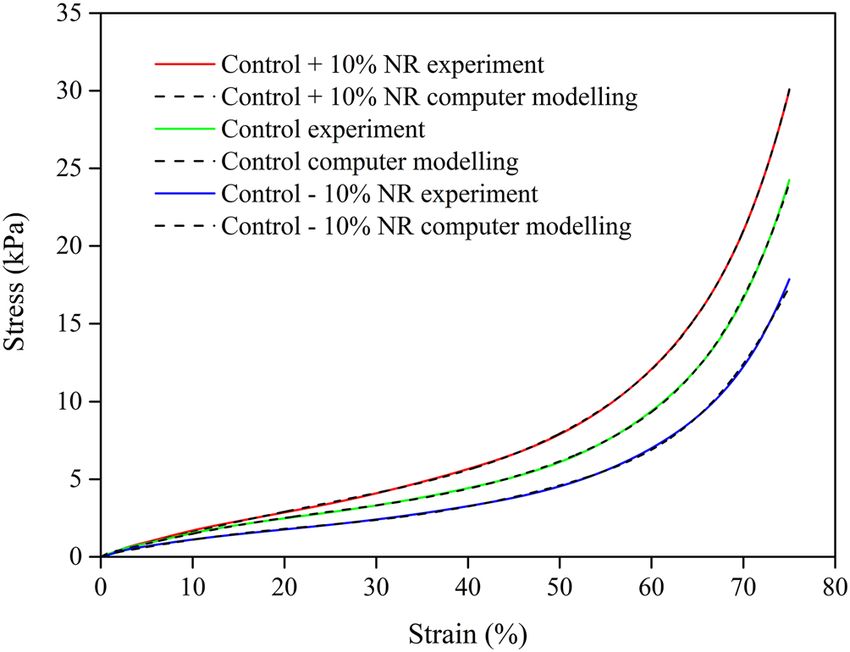
www.nature.com/scientificreports/
Figure 6. Force–temperature curves at a given strain for the control + 10% NR sample with R2 = 0.9 minimum
at each strain. The scatter on the results is on the order of the size of the figures.
dU = dQ + dW (4)
where dU is the change in the rubber foam’s internal energy resulting from the absorption of heat, dQ, and the
distribution of work, dW, on it by the external force. If we assume that the compression process is reversible
based on the porous structure of rubber foam, the heat flow can be expressed as41:
dQ = TdS (5)
where T is the temperature and dS is the change in entropy, and thus:
dU = TdS + dW (6)
This equation concerns the reversible compression of a foam sample. The work is done by applying a force, F,
to the foam, resulting in the change of length, dL, from its original length. From the perspective of porous struc-
ture of rubber foam, when a foam is compressed at the z–direction, it can be expanded at the x– and y–directions.
So, the uniaxial work done on the foam based on the assumption of constant volume is thus:
dW = FdL (7)
Then, we combine (4), (5), (6), and (7) and produce:
dU = TdS + FdL (8)
14,16
We can take the partial differential of (8) with respect to L as follows :
dU dS
=T +F
dL dL
dU dS
F= −T = Fu + Fs (9)
dL dL
where Fu = dU/dL and Fs = − T(dS/dL). These two thermodynamic parameters relate to the internal energy and
entropy changes on compression of the rubber foam sample.
Equation (9) is of basic significance in rubber elasticity since it provides a direct measurement of the changes
of the internal energy and the entropy during a deforming. Its application is illustrated by Figs. 6, 7 and 8, in
which the linear curve represents the variation with temperature of the force at a constant compressive strain.
From (9), the slope of this curve gives the entropy change per unit compression, dS/dL, for isothermal compres-
sion at the temperature T. Correspondingly, the y–intercept at T = 0 is dU/dL, the change of internal energy per
unit compression.
Thus, the internal energy and entropy contributions to the force at any given compression strain can be
obtained by the experimental force–temperature curve of the foam samples with different compression strains
and temperatures (Figs. 6, 7, 8). The internal energy and entropy terms are independent of the temperature
when the force–temperature curve is linear. However, at high compression strains, the effect of crystallisation
could become significant. Strain–induced crystallisation of solid uncrosslinked rubber has previously been
reported42,43, while stress–induced crystallisation of crosslinked rubber foam has been reported7. Figures 6,7 and
8 show the increase of compression force with increasing compression strain (from 10 to 70% strain) in all types
Scientific Reports | (2021) 11:6097 | https://doi.org/10.1038/s41598-021-85638-z 7
Vol.:(0123456789)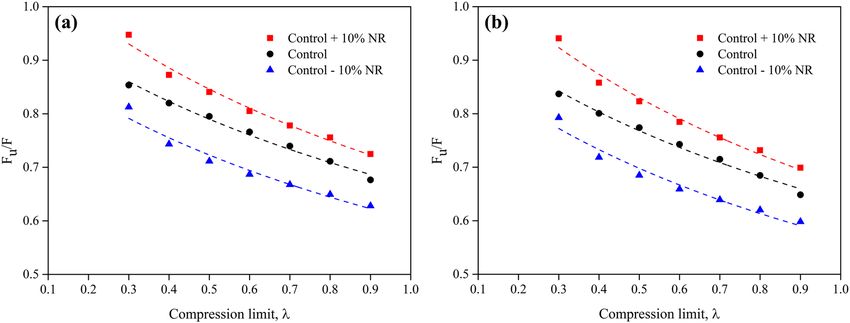
www.nature.com/scientificreports/
Figure 7. Force–temperature curves at a given strain for the control sample with R
2 = 0.9 minimum at each
strain. The scatter on the results is on the order of the size of the figures.
Figure 8. Force–temperature curves at given strain for the control − 10% NR sample with R
2 = 0.9 minimum at
each strain. The scatter on the results is on the order of the size of the figures.
of foam sample studied. At a certain compression strain, the compression force seems to be stable, indicating the
high–density foam samples which are in good agreement with a previous study on high–density rubber foams
with silica filler7. Furthermore, the slope decreases slightly at higher strains, indicating the decrease degree of
freedom of the rubber molecules.
Concerning the elasticity of the foam sample in compression mode (Figs. 6, 7, 8), samples under high length
or low compression strain, L, exhibits high entropy, S, values. Thus, the entropy of a foam sample is proportional
to the length at a constant temperature, as shown in Eq. (10).
S∝L (10)
Table 5 shows the values of the Fu/F ratio of various foam samples at different compression strains and two
temperatures (298.15 and 338.15 K). The values of F u and F grow as the compression strain increases for all types
of foam sample. Moreover, the F u/F value also increases with increasing compression strain, indicating the stabil-
ity of the entropy during the deformation process. This result agrees with previous work on rubber foam with high
silica loading, which showed high density and better mechanical p roperties7. While the NR matrix concentration
affects the mechanical properties of the foam samples, the ratio of F u/F relates to the thermodynamic aspects
of the mechanical properties of the foam samples. This result is in good agreement with the calculations of ∆G
Scientific Reports | (2021) 11:6097 | https://doi.org/10.1038/s41598-021-85638-z 8
Vol:.(1234567890)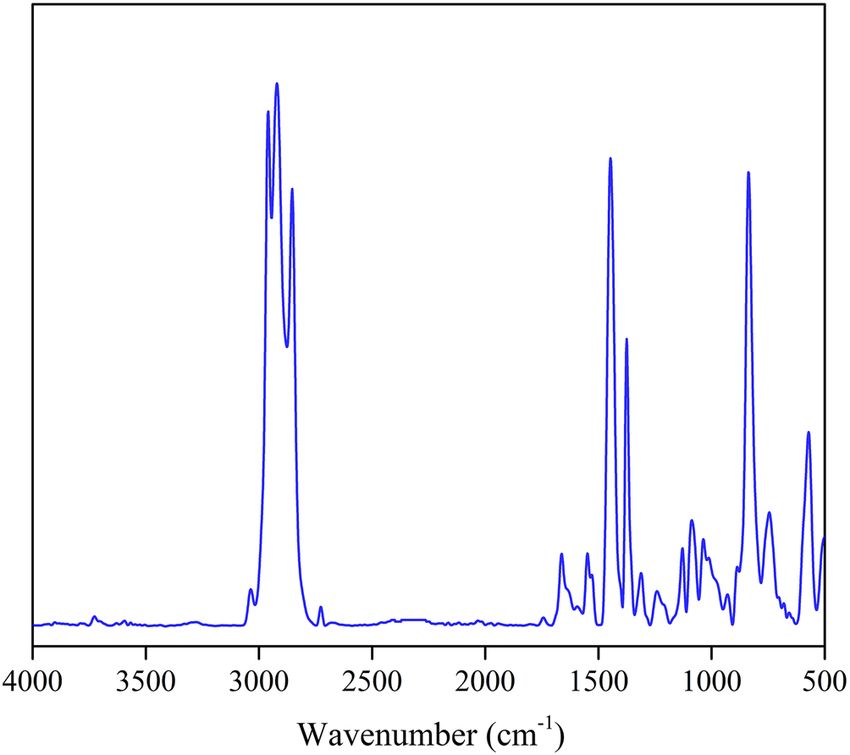
www.nature.com/scientificreports/
298.15 K 338.15 K
Sample Compression strain (%) Fu (± 5% N) F (± 5% N) Fu/F F (± 5% N) Fu/F
10 5.42 7.48 0.7248 7.75 0.6990
20 8.21 10.86 0.7556 11.22 0.7317
30 10.76 13.83 0.7780 14.25 0.7555
Control + 10% NR 40 13.79 17.13 0.8050 17.57 0.7845
50 17.77 21.14 0.8406 21.59 0.8230
60 25.52 29.24 0.8726 29.74 0.8579
70 39.75 41.96 0.9474 42.26 0.9408
10 5.74 8.48 0.6766 8.85 0.6485
20 7.71 10.84 0.7112 11.26 0.6846
30 9.32 12.60 0.7398 13.04 0.7148
Control 40 11.52 15.04 0.7660 15.51 0.7427
50 14.82 18.63 0.7952 19.15 0.7739
60 21.73 26.50 0.8200 27.14 0.8006
70 36.82 43.14 0.8535 43.99 0.8370
10 5.94 9.46 0.6281 9.93 0.5982
20 7.67 11.82 0.6494 12.38 0.6202
30 9.11 13.64 0.6677 14.25 0.6392
Control − 10% NR 40 11.12 16.19 0.6869 16.87 0.6592
50 13.90 19.53 0.7115 20.29 0.6850
60 19.16 25.78 0.7433 26.67 0.7185
70 28.58 35.17 0.8126 36.05 0.7927
Table 5. Compression strain, Fu, F, and F
u/F values of foam samples at 298.15 K and 338.15 K.
Figure 9. Internal energy contribution vs the compression force, Fu/F, of various foam samples: (a) 298.15 K,
and (b) 338.15 K. The scatter on the results is on the order of the size of the figures.
and ∆S. Moreover, the ratio of Fu/F increases as the temperature decreases from 338.15 to 298.15 K. This can be
explained by the effect of the flow property of natural rubber at higher t emperatures44,45. The Fu/F values obtained
from this study (0.7–0.9) are higher than those from previous studies: 0.1–0.2 values for uncrosslinked rubber
in extension16 and 0.6–0.8 values for lower density crosslinked foam samples in compression7. The difference
in Fu/F values could be due to the differences in the rubber structure and the test method used. Figure 9 shows
the relationship between F u/F and the compression limit, λ, of various foam samples at 298.15 K and 338.15 K.
We found that the slope is similar to that from a previous study of rubber foams with a large amount of silica
loading7. The slope direction of the foam samples is not significantly different between the two temperatures.
However, the NR matrix concentration in the foam sample affects the level of the Fu/F graphs because of the
mechanical properties of the foam sample.
The thermodynamic parameters of foam samples were also calculated from the perspective of dynamic
mechanical analysis. The storage modulus, E′, and tan δ of the foam samples as a function of temperature are
presented in Fig. 10. In general, the storage modulus relates to the dynamic mechanical properties whereas
tan δ relates to the dissipation energy of a material46,47. Rubber chains are freezing at the glassy plateau below
the glass transition temperature, the foam sample with high NR content (control + 10% NR) represents a high
Scientific Reports | (2021) 11:6097 | https://doi.org/10.1038/s41598-021-85638-z 9
Vol.:(0123456789)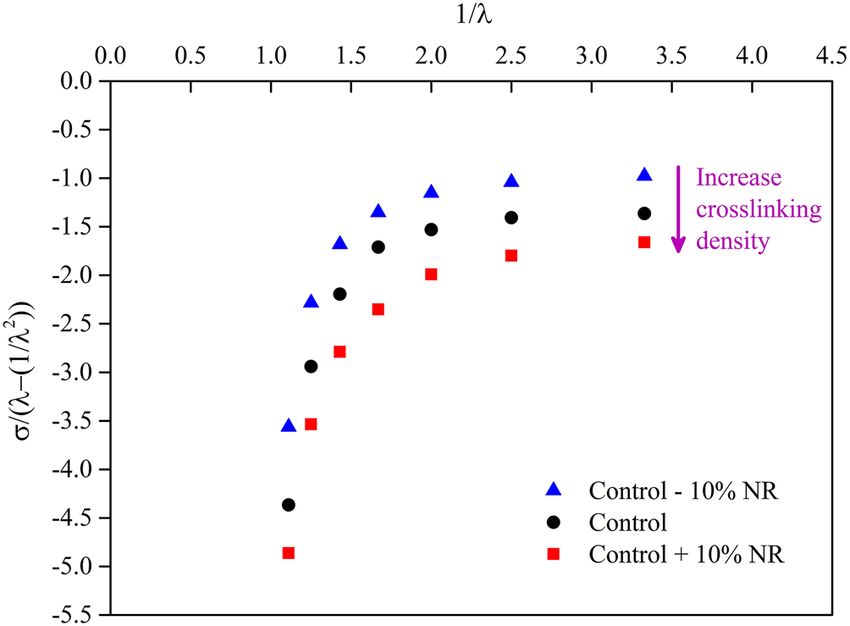
www.nature.com/scientificreports/
Figure 10. Dynamic mechanical analysis of various foam samples: (a) storage modulus, E’, as a function of
temperature, and (b) tan δ as a function of temperature. The relative scatter on the results is estimated equal to
about 5%.
E’glassy at 203.15 K E’rubber at 273.15 K tA (area under tan
Sample (± 5% MPa) (± 5% MPa) Tg dynamic (K) Tan ẟ max ẟ peak) ∆Ha (kJ K/mol)
Control + 10% NR 337.28 0.37 232.07 1.68 33.44 143.36
Control 293.53 0.31 229.98 1.80 34.50 137.30
Control − 10% NR 324.73 0.49 226.65 2.02 33.22 131.28
Table 6. Parameters obtained from the dynamic mechanical analysis of various foam samples.
storage modulus at the glassy plateau, indicating the lower free volume for high density samples46. However, the
storage modulus of other two samples is quite similar. The NR matrix concentration also affects the dissipation
energy or hysteresis (maximum tan δ) of a foam sample. Samples with a high NR concentration possess more
network structure, generating the low hysteresis. This result is in good agreement with the existing literature,
and the hysteresis of the rubber foam could be due to either the molecular friction of short molecules or the
reduced network s tructure8,48.
Table 6 presents the dynamic mechanical parameters extracted from Fig. 10, from which the activation
enthalpy, ∆Ha, of various foam samples can be calculated. This activation enthalpy focuses on the transition
process between the glassy and rubber states of rubber molecules. This average value also corresponds to the
relaxation of the backbone motion of rubber molecules33. Interestingly, the NR matrix concentration again affects
the activation enthalpy of the foam sample, where a higher NR concentration represents a higher average activa-
tion enthalpy, ∆Ha, due to the greater relaxation time of the rubber chains. These average activation enthalpy
values are in good agreement with the previous literature7,33.
Conclusions
In this study, we applied the Dunlop process to prepare rubber foam samples with different NR matrix concen-
trations. Then we investigated the thermodynamic relations of the system in more detail and how they may be
applied experimentally to obtain quantitative information during the compression process. We found that the
NR matrix content has a significant effect on the density and compression strength of the foam sample; neverthe-
less, the compression strength is more sensitive to the matrix concentration than the density. The foam samples
have an open–cell structure with heterogeneous cell sizes, samples with higher NR matrix concentration exhibit
higher interconnectivity and cell density.
The computational modelling using the hyperfoam model of the 6th order is in good agreement with the
experimental result of the foam samples in the stress–strain curve. Moreover, the mechanical properties of the
foam samples with different matrix concentrations are in good agreement with that of the Mooney–Rivlin experi-
ment. However, our work was in compression mode while Mooney–Rivlin’s was in extension mode.
Based on the crosslinking density of the foam sample, the higher NR matrix concentration results in a higher
volume fraction of rubber, Vr, and crosslinking density. When the Flory–Huggins equation is applied, the change
in Gibbs free energy, ∆G, decreases, and the change in entropy, ∆S, increases with the increasing NR matrix
concentration, which is thermodynamically favourable. The force and temperature relationship corresponded
to the internal energy and entropy, which were experimentally determined by compression of foam samples.
Interestingly, the ratio of the internal energy force to the compression force, F
u/F, increases with the NR matrix
concentration, and the Fu/F ratio is in good agreement with the literature reviews. Thus, the change of foam
length, ΔL, or compression strain, is directly influenced by the entropy change.
Scientific Reports | (2021) 11:6097 | https://doi.org/10.1038/s41598-021-85638-z 10
Vol:.(1234567890)www.nature.com/scientificreports/
Dynamic mechanical analysis was applied to evaluate the activation enthalpy of the transition process, ∆Ha,
of the foam samples. The results showed that a higher NR matrix concentration has the effect of increasing the
average activation enthalpy related to the relaxation time of rubber molecules. Therefore, the NR matrix con-
centration affects the static and dynamic parameters resulting from the relationship between the rubber foam
structure and the material properties. New approaches in the thermodynamic aspects of foam samples related
to the matrix concentration effect were investigated and proposed.
Data availability
Correspondence and requests for materials should be addressed to W.S.
Received: 5 January 2021; Accepted: 1 March 2021
References
1. Mohebbi, A., Mighri, F., Ajji, A. & Rodrigue, D. Current issues and challenges in polypropylene foaming: a review. Cell. Polym.
34, 299–338 (2015).
2. Andrieux, S., Quell, A., Stubenrauch, C. & Drenckhan, W. Liquid foam templating: a route to tailor-made polymer foams. Adv.
Colloid Interface Sci. 256, 276–290 (2018).
3. Trofa, M., Di Maio, E. & Maffettone, P. L. Multi-graded foams upon time-dependent exposition to blowing agent. Chem. Eng. J.
362, 812–817 (2019).
4. Suethao, S., Shah, D. U. & Smitthipong, W. Recent progress in processing functionally graded polymer foams. Materials 13, 4060.
https://doi.org/10.3390/ma13184060 (2020).
5. Najib, N. N., Ariff, Z. M., Bakar, A. A. & Sipaut, C. S. Correlation between the acoustic and dynamic mechanical properties of
natural rubber foam: effect of foaming temperature. Mater. Des. 32, 505–511 (2011).
6. Yuan, Q. et al. Comparison of fire behaviors of thermally thin and thick rubber latex foam under bottom ventilation. Polymers 11,
88. https://doi.org/10.3390/polym11010088 (2019).
7. Prasopdee, T. & Smitthipong, W. Effect of fillers on the recovery of rubber foam: from theory to applications. Polymers 12, 2745.
https://doi.org/10.3390/polym12112745 (2020).
8. Chollakup, R., Suwanruji, P., Tantatherdtam, R. & Smitthipong, W. New approach on structure-property relationships of stabilized
natural rubbers. J. Polym. Res. 26, 37. https://doi.org/10.1007/s10965-018-1685-1 (2019).
9. Suksup, R., Sun, Y., Sukatta, U. & Smitthipong, W. Foam rubber from centrifuged and creamed latex. J. Polym. Eng. https://doi.
org/10.1515/polyeng-2018-0219 (2019).
10. Khuntawee, W., Sutthibutpong, T., Phongphanphanee, S., Karttunen, M. & Wong-ekkabut, J. Molecular dynamics study of natural
rubber–fullerene composites: connecting microscopic properties to macroscopic behavior. Phys. Chem. Chem. Phys. 21, 19403–
19413. https://doi.org/10.1039/c9cp03155c (2019).
11. James, H. M. & Guth, E. Theory of the elasticity of rubber. J. Appl. Phys. 15, 294–303 (1944).
12. Einstein, A. Investigations on the Theory of the Brownian Movement (Dover Publications, 1956).
13. Lampo, A., March, M. Á. G. & Lewenstein, M. Quantum Brownian Motion Revisited: Extensions and Applications (Springer Inter-
national Publishing, 2019).
14. Meyer, K. H. & Ferri, C. The elasticity of rubber. Rubber Chem. Technol. 8, 319–334 (1935).
15. Roe, R. J. & Krigbaum, W. R. The contribution of internal energy to the elastic force of natural rubber. J. Polym. Sci. 61, 167–183
(1962).
16. Treloar, L. R. G. The Physics of Rubber Elasticity (Oxford University Press, 1975).
17. Pakornpadungsit, P., Smitthipong, W. & Chworos, A. Self-assembly nucleic acid-based biopolymers: learn from the nature. J. Polym.
Res. 25, 45. https://doi.org/10.1007/s10965-018-1441-6 (2018).
18. Smith, T. L. Large deformation tensile properties of elastomers: I: temperature dependence of c1 and c2 in the Mooney-Rivlin
equation. J. Polym. Sci. Part C Polym. Symp. 16, 841–858 (1967).
19. Spathis, G. D. Polyurethane elastomers studied by the Mooney-Rivlin equation for rubbers. J. Appl. Polym. Sci. 43, 613–620 (1991).
20. Flory, P. J. Thermodynamics of crystallization in high polymers: I: crystallization induced by stretching. J. Chem. Phys. 15, 397–408.
https://doi.org/10.1063/1.1746537 (1947).
21. Wang, M. C. & Guth, E. Statistical theory of networks of non-Gaussian flexible chains. J. Chem. Phys. 20, 1144–1157 (1952).
22. Hasany, S. M., Saeed, M. M. & Ahmed, M. Adsorption isotherms and thermodynamic profile of Co(II)—SCN complex uptake on
polyurethane foam. Sep. Sci. Technol. 35, 379–394 (2000).
23. Schneider, C. A., Rasband, W. S. & Eliceiri, K. W. NIH Image to ImageJ: 25 years of image analysis. Nat. Methods 9, 671–675. https
://doi.org/10.1038/nmeth.2089 (2012).
24. Mase, G. T., Smelser, R. E. & Rossmann, J. S. Continuum Mechanics for Engineers (CRC Press, 2020).
25. Smith, M. ABAQUS/Standard User’s Manual, Version 6.9 (Dassault Systèmes Simulia Corp, 2009).
26. Fukahori, Y. & Seki, W. Molecular behaviour of elastomeric materials under large deformation: 1: re-evaluation of the Mooney-
Rivlin plot. Polymer 33, 502–508 (1992).
27. Flory, P. J. & Rehner, J. Statistical mechanics of cross-linked polymer networks II: swelling. J. Chem. Phys. 11, 521–526 (1943).
28. Smitthipong, W., Nardin, M., Schultz, J. & Suchiva, K. Adhesion and self-adhesion of rubbers, crosslinked by electron beam irra-
diation. Int. J. Adhes. Adhes. 27, 352–357 (2007).
29. Croll, S. G. Application of the Flory-Rehner equation and the Griffith fracture criterion to paint stripping. J. Coat. Technol. Res. 7,
49. https://doi.org/10.1007/s11998-009-9166-4 (2009).
30. Tangboriboon, N., Rortchanakarn, S., Petcharoen, K. & Sirivat, A. Effects of foaming agents and eggshell calcium carbonate
(CaCO3) filler on natural rubber foam physical-thermal: mechanical properties. J. Rubb. Res. 19, 71–96 (2016).
31. Phomrak, S., Nimpaiboon, A., Newby, B.-M.Z. & Phisalaphong, M. Natural rubber latex foam reinforced with micro- and nanofi-
brillated cellulose via Dunlop method. Polymers 12, 1959. https://doi.org/10.3390/polym12091959 (2020).
32. Pojanavaraphan, T. & Magaraphan, R. Prevulcanized natural rubber latex/clay aerogel nanocomposites. Eur. Polym. J. 44, 1968–1977
(2008).
33. Sadeghi Ghari, H. & Jalali-Arani, A. Nanocomposites based on natural rubber, organoclay and nano-calcium carbonate: study on
the structure, cure behavior, static and dynamic-mechanical properties. Appl. Clay Sci. 119, 348–357 (2016).
34. Rathnayake, I., Ismail, H., Azahari, B., Darsanasiri, N. D. & Rajapakse, S. Synthesis and characterization of nano-silver incorporated
natural rubber latex foam. Polym. Plast. Technol. Eng. 51, 605–611 (2012).
35. Panploo, K., Chalermsinsuwan, B. & Poompradub, S. Natural rubber latex foam with particulate fillers for carbon dioxide adsorp-
tion and regeneration. RSC Adv. 9, 28916–28923 (2019).
36. Forest, C., Chaumont, P., Cassagnau, P., Swoboda, B. & Sonntag, P. Polymer nano-foams for insulating applications prepared from
CO2 foaming. Prog. Polym. Sci. 41, 122–145 (2015).
Scientific Reports | (2021) 11:6097 | https://doi.org/10.1038/s41598-021-85638-z 11
Vol.:(0123456789)www.nature.com/scientificreports/
37. Smitthipong, W., Nardin, M., Schultz, J., Nipithakul, T. & Suchiva, K. Study of tack properties of uncrosslinked natural rubber. J.
Adhes. Sci. Technol. 18, 1449–1463 (2004).
38. Messinger, R. J., Marks, T. G., Gleiman, S. S., Milstein, F. & Chmelka, B. F. Molecular origins of macroscopic mechanical properties
of elastomeric organosiloxane foams. Macromolecules 48, 4835–4849. https://doi.org/10.1021/acs.macromol.5b00532 (2015).
39. Alzoubi, M., Al-Waked, R. & Tanbour, E. Compression and hysteresis curves of nonlinear polyurethane foams under different
densities, strain rates and different environmental conditions. J. Mech. Eng. 9, 101–109. https: //doi.org/10.1115/IMECE2 011-62290
(2011).
40. Adobe Inc, Adobe Illustrator. Available from: https://adobe.com/products/illustrator (2019).
41. Klein, S. & Nellis, G. Thermodynamics (Cambridge University Press, 2011).
42. Huneau, B. Strain-induced crystallization of natural rubber: a review of x-ray diffraction investigations. Rubber Chem. Technol.
84, 425–452 (2011).
43. Brüning, K., Schneider, K., Roth, S. V. & Heinrich, G. Kinetics of strain-induced crystallization in natural rubber studied by WAXD:
Dynamic and impact tensile experiments. Macromolecules 45, 7914–7919 (2012).
44. Boel, M. & Eirich, F. Thermodynamics, thermal effects and dilatation of natural. https://doi.org/10.21236/ad0644112 (1966).
45. Stephen, R. et al. Flow properties of unvulcanised natural rubber/carboxylated styrene butadiene rubber latices and their blends.
J. Appl. Polym. Sci. 104, 2528–2535. https://doi.org/10.1002/app.25855 (2007).
46. Phuhiangpa, N., Ponloa, W., Phongphanphanee, S. & Smitthipong, W. Performance of nano- and microcalcium carbonate in
uncrosslinked natural rubber composites: new results of structure-properties relationship. Polymers. https://doi.org/10.3390/
polym12092002 (2020).
47. Promhuad, K. & Smitthipong, W. Effect of stabilizer states (solid Vs liquid) on properties of stabilized natural rubbers. Polymers.
https://doi.org/10.3390/polym12040741 (2020).
48. Suethao, S. & Smitthipong, W. Adhesion and heat build-up of rubber for energy-saved tyre. IOP Conf. Ser. Mater. Sci. Eng. 526,
012011. https://doi.org/10.1088/1757-899X/526/1/012011 (2019).
Acknowledgements
This research was financially supported by the graduate school of Kasetsart University, Bangkok, Thailand.
This research was also supported by the Specialized center of Rubber and Polymer Materials in agriculture and
industry (RPM), Faculty of Science, Kasetsart University, Bangkok, Thailand.
Author contributions
S.S. carried out the preparation and characterisation of foam samples and wrote the manuscript; W.P. carried out
the finite element analysis; S.P. contributed to the discussion of the manuscript; J.W. contributed to the discussion
and review of the manuscript; W.S. conceived and designed the study, supervised, and revised the manuscript.
All authors approved the manuscript before submission.
Competing interests
The authors declare no competing interests.
Additional information
Correspondence and requests for materials should be addressed to W.S.
Reprints and permissions information is available at www.nature.com/reprints.
Publisher’s note Springer Nature remains neutral with regard to jurisdictional claims in published maps and
institutional affiliations.
Open Access This article is licensed under a Creative Commons Attribution 4.0 International
License, which permits use, sharing, adaptation, distribution and reproduction in any medium or
format, as long as you give appropriate credit to the original author(s) and the source, provide a link to the
Creative Commons licence, and indicate if changes were made. The images or other third party material in this
article are included in the article’s Creative Commons licence, unless indicated otherwise in a credit line to the
material. If material is not included in the article’s Creative Commons licence and your intended use is not
permitted by statutory regulation or exceeds the permitted use, you will need to obtain permission directly from
the copyright holder. To view a copy of this licence, visit http://creativecommons.org/licenses/by/4.0/.
© The Author(s) 2021
Scientific Reports | (2021) 11:6097 | https://doi.org/10.1038/s41598-021-85638-z 12
Vol:.(1234567890)You can also read