FIREFLY FLASHING IS CONTROLLED BY GATING OXYGEN TO LIGHT-EMITTING CELLS
←
→
Page content transcription
If your browser does not render page correctly, please read the page content below
The Journal of Experimental Biology 204, 2795–2801 (2001)                                                                                  2795
Printed in Great Britain © The Company of Biologists Limited 2001
JEB3547

 FIREFLY FLASHING IS CONTROLLED BY GATING OXYGEN TO LIGHT-EMITTING
                               CELLS
       GRAHAM S. TIMMINS1,*, FRASER J. ROBB2,‡, CARMEN M. WILMOT2, SIMON K. JACKSON1 AND
                                             HAROLD M. SWARTZ2
      1Department of Medical Microbiology, University of Wales College of Medicine, Cardiff, UK, 2Department of
                          Radiology, Dartmouth Medical School, Hanover NH 03755, USA
     *Author for correspondence (e-mail: mail@eprimaging.com) at present address: College of Pharmacy, 2502 Marble NE, Albuquerque,
                                                         NM 87131-5691, USA
                                     ‡Present address: USA Instruments Inc., Aurora, OH 44202, USA

                                                                    Accepted 5 June 2001

                                                         Summary
  Although many aspects of firefly bioluminescence are       the photocytes in the aqueous and gas phases. Thirdly, we
understood, the mechanism by which adult fireflies           provide constraints upon the distance between any gas-
produce light as discrete rapid flashes is not. Here we      phase gating structure(s) and the photocytes. We
examine the most postulated theory, that flashing is         conclude from these data that the flash of the adult firefly
controlled by gating oxygen access to the light-emitting     is controlled by gating of oxygen to the photocytes, and
cells (photocytes). According to this theory, the dark state demonstrate that this control mechanism is likely to act
represents repression of bioluminescence by limiting         by modulating the levels of fluid in the tracheoles
oxygen, which is required for bioluminescence; relief        supplying photocytes, providing a variable barrier to
from this repression by transiently allowing oxygen access   oxygen diffusion.
to the photocytes allows the flash. We show that
normobaric hyperoxia releases the repression of light
emission in the dark state of both spontaneously flashing    Movies available on-line.
and non-flashing fireflies, causing continual glowing, and
we measure the kinetics of this process. Secondly, we        Key words: bioluminescence, oxygen gating, light-emitting cell,
determine the length of the barriers to oxygen diffusion to  photocyte, firefly, Photinus pyralis.

                                   Introduction
   The chemical reactions by which fireflies produce                                                            Fast
bioluminescence are well described (Reactions 1 and 2), the                      Luciferase-luciferin-AMP + O2 → Luciferase +
                                                                                                                                            (2)
excited-state intermediates involved in light emission have                                           oxyluciferin + CO2 + AMP + light ,
been characterized, many of the genes for their luciferase                         Here we provide experimental evidence supporting the
have been sequenced, and the X-ray crystal structure of the                     most commonly postulated theory of flash control, namely
Photinus pyralis luciferase enzyme has been solved                              that the flash results from rapid gating of oxygen (O2) to the
(reviewed recently by Wilson and Hastings, 1998). However,                      light-emitting cells of the lantern (photocytes). There is a
the mechanism by which adults produce their                                     great deal of circumstantial evidence supporting such a
bioluminescence as rapid flashes of light, which is vital for                   control mechanism (Case and Strause, 1978; Wilson and
its biological courtship function, is not yet understood,                       Hastings, 1998), including (1) firefly bioluminescence
despite a long history of scientific investigation. This has                    absolutely requires oxygen (Reaction 2); (2) sequential
been comprehensively reviewed by Case and Strause (Case                         hypoxia and reoxygenation causes a ‘pseudoflash’,
and Strause, 1978) and recently updated by Ghiradella                           simulating many features of a genuine flash (Alexander,
(Ghiradella, 1998) and Wilson and Hastings (Wilson and                          1943; Hastings and Buck, 1956); (3) the tracheolar system of
Hastings, 1998), also see Movie 1 in the supplementary                          the adult lantern (the structures supplying oxygen to insect
material for a demonstration.                                                   cells) has a unique structure compared to the larval form
                                        Slow
                                                                                (Ghiradella, 1977; Ghiradella, 1998); and (4) the nerves
ATP + luciferase + luciferin →                                                  innervating the flash motor unit do not terminate upon the
                                                                         (1)
                        Luciferase-luciferin-AMP + PPi ,                        photocytes themselves but rather the specialised tracheal end
2796 G. S. TIMMINS AND OTHERS
140 AHVEVNIDYPEY-183 for Bacillus halodurans. Given the
similarities in molecular structure between the site of
120 benzothiazole luciferin oxidation and thiophene, this may
Light emission (arbitrary units)
perhaps form a common oxidation and/or binding site, arrived
100 at through convergent evolution.]
The flash is therefore almost certainly controlled by regulating
80
the access of oxygen to the LL-AMP complex, most logically
60 by control of oxygen entry to the photocytes, perhaps by a
Action Action mechanism analogous to (albeit faster than) the spiracular
40 potential potential Onset of control of discontinuous cyclic gas exchange (DCG) known to
initiation arrival at light occur in many insects (Lighton, 1996), or perhaps through
20 at brain lantern emission
control of tracheolar fluid levels (Timmins et al., 2000). It has
long been known that oxygen supply to tissues in insects is
0
mediated by changes in tracheolar fluid levels, which result from
changes in the balance of osmotic pressure of the tracheolar fluid
0 50 100 150 200 250 and intracellular milieu (Wigglesworth, 1935). Indeed, Maloeuf
Time (ms) (Maloeuf, 1938) proposed such a mechanism of control of
oxygen supply to the photocyte by controlling tracheolar fluid
Fig. 1. Temporal sequence of events in a typical single firefly flash levels some years ago, although Alexander (Alexander, 1943)
(adapted from data in Buck et al., 1963).
later proposed that the tracheal end cell rather acts in the manner
of a mechanical valve to control oxygen access. Irrespective of
cells (Ghiradella, 1977; Ghiradella, 1998; Case and Strause, the actual mechanism, in such a model light emission during the
1978). dark phase of flashing would be repressed by restricting oxygen
However, perhaps most importantly, only a few tens of access to the photocytes; these are richly endowed with
milliseconds (typically 40–60 ms) pass between the arrival of mitochondria around their internal periphery, adjacent to the
the nervous action potential at the lantern and the start of light photocyte plasma membrane that abuts the oxygen-supplying
emission in vivo, with maximal light emission occurring within tracheoles (Ghiradella, 1977; Ghiradella, 1998; Case and
100–150 ms after action potential arrival (see Fig. 1; Buck et Strause, 1978). The combination of limiting oxygen supply,
al., 1963). Only the reaction of pre-formed luciferase-luciferyl- together with the oxygen consumption by these mitochondria,
AMP complex (LL-AMP) with oxygen (Reaction 2) occurs could reasonably be expected to result in anoxia within the
rapidly enough to be the point of control, with maximum light centre of the photocytes and thereby inhibit light emission. This
emission occurring within 60 ms of mixing LL-AMP and is supported by the fact that the light-emitting subcellular
oxygen in vitro (De Luca and McElroy, 1974). If however, the structures, the photocyte vesicles that contain the LL-AMP
reaction is instead initiated in vitro by mixing luciferin, complex, are found at the centre of the photocytes (Smalley et
luciferase, ATP and oxygen (i.e. proceeding via Reaction 1 al., 1980). The flash of light emission would therefore be
followed by Reaction 2), a lag phase of 25 ms occurs before achieved by transiently increasing the supply of oxygen to the
any light is emitted, and maximal light is not emitted until photocytes; their peripheral mitochondria would be unable to
300 ms after mixing (De Luca and McElroy, 1974). Hence consume all of this increased oxygen supply, so some would
these kinetics dictate that any control mechanisms acting at reach the photocyte vesicles and result in light emission. The
points prior to the reaction of LL-AMP with oxygen (e.g. via combination of oxygen consumption by mitochondria and
controlling ATP levels or luciferin release from photocyte bioluminescence itself would consume the ‘pulse’ of increased
vesicles) would simply occur too slowly and can be ruled out. oxygen, resulting in anoxia around the photocyte vesicles and
In vitro, the reaction of the LL-AMP complex with oxygen repression of light emission, ending the flash.
is rapid and spontaneous, and although one could argue that in In this study we have confirmed this theory by first
vivo this might be subject to the repressive action of a cellular demonstrating that increasing oxygen supply by normobaric
second messenger/binding protein (not present in the in vitro hyperoxia (rapidly changing the external gas stream to oxygen
experiments), with this repression being rapidly and transiently from air) can relieve this repression of light emission, and more
lifted for the flash, no such consensus sequences/binding sites, importantly, measuring the kinetics of this hyperoxia-induced
other than those for substrate carboxyl group adenylation light emission. Secondly, we have measured pseudoflash
(Wood, 1995), were found after extensive database searching kinetics in fireflies in gas mixtures where the gas-phase
(Altschul et al., 1997) using all known coleopteran luciferase diffusion coefficient of oxygen varies to determine gas- and
sequences (G. S. Timmins, unpublished results). [Note that aqueous-phase barriers to oxygen diffusion (Timmins et al.,
although no ‘control’ sequences were found, a clear analogy 2000). Thirdly, we have used direct electrical stimulation of
between coleopteran luciferase and bacterial thiophene firefly flashing by insertion of electrodes into the lantern (Buck
oxidation protein sequences was observed e.g. 45- et al., 1963) and measured the delay between electrical
AHIEVNITYAEY-56 for Photinus pyralis and 172- stimulation and peak light emission in a range of normoxic gasFirefly flashing is controlled by gating oxygen 2797
mixtures, in which the gas-phase diffusion coefficient of MV series digital video camera and converted to MPEG1
oxygen varies. From this, we have been able to provide format. All values are means ± 1 S.D.
constraints on the distance between any such gas-phase gating
structure and the photocytes. Finally, we use these and previous
data to provide the likely identity of the physical mechanism by Results and discussion
which rapid oxygen gating is achieved, namely modulation of Kinetics of both hyperoxia-initiated light emission and the
tracheolar fluid levels. The use of such an oxygen-gating control pseudoflash
mechanism does not (to the author’s knowledge) occur When the gas stream in which spontaneously flashing
elsewhere in animal biology, and has most likely evolved via a specimens (at approximately 1–2 h after dusk, N=5) were held
series of sequential modifications of the pre-existing was rapidly changed from air to oxygen (a change of oxygen
mechanism through which insects regulate tissue oxygenation, partial pressure, PO∑, from 21 kPa to 101 kPa in approximately
via changes in tracheolar fluid levels (Wigglesworth, 1935). 25 ms), the entire lantern began to glow continuously, taking
5–15 s to reach peak light emission (5 measurements for
each sample, mean 10.2±2.8 s). As the hyperoxia-induced
Materials and methods continuous light emission increased, the apparent intensity of
Fireflies (Photinus sp., male) were collected locally from spontaneous flashing decreased and could not be observed at
meadows near Hanover, NH, USA, and kept individually in maximal hyperoxia-induced light emission; this continued for
plastic containers containing ventilation holes in ambient the longest periods of hyperoxia tested (30 s). Upon changing
lighting conditions. Measurements of kinetics of the gas stream back to air, the continuous hyperoxia-induced
bioluminescence induced by a rapid change from normobaric light emission steadily decreased to zero within 10–30 s, and
normoxia to hyperoxia (change in partial pressure of oxygen, spontaneous flashing again became apparent during this
PO∑, from 21 kPa to 101 kPa) were determined as previously time (a typical experiment is shown in Movie 2 in the
described at 294±1 K using a rapid gas-changing valve supplementary material). Analogous behaviour was also
apparatus, photodiode and storage oscilloscope. The total time observed when the hyperoxic gas contained 96 kPa O2 and
taken to change the external gas supply at the lantern was 25 ms, 5 kPa CO2, whereas changing the gas stream from air to 5 kPa
and the time from gas change to peak light emission was CO2 in air did not induce glowing, indicating that CO2 levels
measured (Timmins et al., 1999; Timmins et al., 2000). play no role in this effect.
Pseudoflash kinetics in fireflies (either after electrical stimulation When samples that were not spontaneously flashing (prior
or during periods of spontaneous flashing) were measured in to dusk, N=4) were studied, peak continuous hyperoxia-
low- and high-diffusivity carrier gases (N2 and He, respectively; induced light emission due to changing the gas stream from
at least five measurements per sample in each gas) with the time- air to oxygen was somewhat slower, taking 17–52 s (3
to-peak-pseudoflash intensity measured (Timmins et al., 2000). measurements on each sample, mean 31.6±10.7 s,) but still
Root mean square (r.m.s.) pathlengths of diffusion in the gas and occurred, and upon changing the gas stream back to air, light
condensed phase were calculated as previously; the barrier in the emission similarly ended over a period of 10–30 s. A typical
condensed phase is produced almost entirely in the aqueous experiment is shown in Movie 3.
phase since the barrier to diffusion across the plasma cell These observations, first reported by Kastle and McDermot
membrane is exceedingly small (Subczynski et al., 1992). For (Kastle and McDermot, 1910) and studied extensively by Snell
electrical stimulation studies, fireflies were decapitated, mounted (Snell, 1932) and Alexander (Alexander, 1943), directly
on a plastic carrier with adhesive tape, and electrically stimulated demonstrate that during the dark state, both between flashes
with electrodes inserted into the lantern (Buck et al., 1963) and when not spontaneously flashing at all, the repression of
whilst held at 294±1 K (measured at the thorax) in a polystyrene light emission can be lifted simply by increasing the ambient
case in a gas stream (both temperature-controlled). Flashing was oxygen concentration (by a factor of approximately five) and
stimulated by a pulse of nominal 50 V amplitude, 5 ms duration hence increasing the supply of oxygen to the photocyte by a
from a stimulator connected to the lantern-mounted electrodes, similar factor. This in and of itself has been used to strongly
and the delay between stimulation and peak flash intensity was support the theory of oxygen control of bioluminescence.
measured. At the voltage and pulse length used, only a single Additionally, the overwhelming of spontaneous flashing at
flash was stimulated. Fireflies were studied in either O2/He and maximal hyperoxia further supports the hypothesis of oxygen
O2/N2, or in O2/He and O2/SF6 gas mixtures, in two cycles of control, because if normal spontaneous flashing were achieved
gas changes (except for sample 3). Spontaneously flashing by another mechanism that was independent of controlling
fireflies were obtained by exposure to ambient light in a natural oxygen levels, then the spontaneous flashing should rather
diurnal cycle, and measured in subdued light after dusk at have been superimposed upon the hyperoxia-induced continual
21.00–23.00 h. Non-flashing fireflies were studied as for flashing bioluminescence. Analysis of the observed kinetics of light
samples, but at 18.00–20.00 h (prior to dusk) in dimmed ambient emission is discussed later.
lighting; delicate handling was required to avoid stimulation of Pseudoflash kinetics for five samples were obtained using
flashing. Video recordings of hyperoxia and pseudoflash helium and nitrogen as carrier gases (Timmins et al., 2000),
experiments (supplemental material) were made using a Canon with delays to peak pseudoflash intensity of 0.249±0.061 s and2798 G. S. TIMMINS AND OTHERS
A P Table 1. The delay between stimulation and peak flash
intensity of fireflies in various gas mixtures
Firefly tSF¥/O∑a or tN∑/O∑b tHe/O∑ tN∑/O∑/tHe/O∑ or
identity (ms) (ms) tSF¥/O∑/tHe/O∑
A 171.1±4.9 (10)a 172.5±4.0 (13) 0.992
176.9±2.2 (11)a 171.5±4.0 (10) 1.031
B 153.0±0.7 (5)a 150.9±1.1 (7) 1.014
153.4±0.5 (7)a 152.8±0.8 (9) 1.004
t C 146.4±0.5 (6)a 146.2±0.7 (8) 1.001
T D 116.9±2.2 (8)b 119.2±1.8 (9) 0.981
120±1.9 (8)b 120±2.8 (7) 1.000
E 121.5±1.4 (5)b 128.8±1.4 (6) 0.943
TF 120.5±1.2 (5)b 119.8±1.4 (5) 1.006
F 87.9±0.7 (11)b 88±0 (6) 0.999
93.6±0.5 (8)b 94±0.6 (6) 0.996
Mean ND ND 0.997±0.022 (11)
NE TC TEC tt Gas mixtures used were He/O2, N2/O2 and SF6/O2. See text for
details.
t, delay time taken for peak flash intensity after stimulation in the
B indicated gas mixture.
Values are means ± S.D. (±σN−1) (N=number of tests).
ND, not determined.
inhibition of Reaction 2 by anoxia (sample held in gas stream
of He or N2); after rapid changing to a normoxic gas stream,
the delay until peak pseudoflash intensity represents the time
taken for diffusion of oxygen from the spiracle to the
TF photocyte. These values are substantially lower than those
obtained for larval Pyrearinus termitilluminans (1.95 s and
1.49 s, respectively), and indicate that the adult firefly has an
enhanced system for oxygen supply compared to the larval
light organ of P. termitilluminans (Timmins et al., 2000).
Effects of modulating gas-phase diffusion on kinetics of light
emission in electrically stimulated fireflies
In order to provide constraints upon the gas-phase distance
between the photocytes and any gating structure responsible for
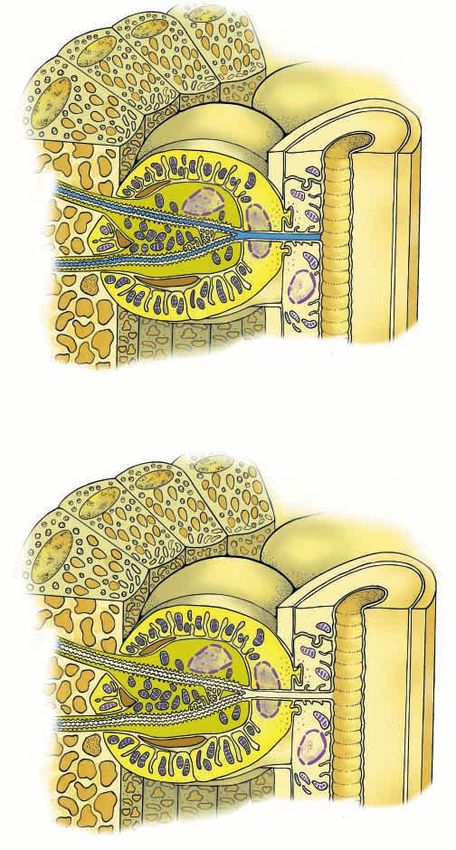
Fig. 2. Diagrams (adapted from Ghiradella, 1977; Ghiradella, 1998, this control of oxygen supply (and hence to determine its
with permission) depicting changes in tracheolar fluid length possible nature), we studied the kinetics of light emission in
responsible for controlling oxygen access to the photocytes. electrically stimulated fireflies held in normobaric, normoxic gas
(A) Increased fluid length during no light emission; (B) decreased fluid mixtures of varying binary diffusion coefficients. These were
length during light emission. P, photocytes; NE, nerve ending; t,
21 kPa O2 in 80 kPa of either He, N2 or SF6, with binary diffusion
tracheole; TF, tracheolar fluid; T, trachea; TC, tracheolar cell; TEC,
tracheal end cell. As explained more fully in the text and shown in
coefficients of 7.91, 2.19 and 1.00×10⁻⁵ m2 s−1, respectively, at
Movie 4, neural stimulation leads to a transient increase in the osmotic 310 K (Chang, 1987). The delay time t, taken for peak flash
potential of the tracheolar cell, resulting in decreased tracheolar fluid intensity after stimulation, was measured (Fig. 2) and this and
levels. The resultant decreased diffusional barrier allows greater the ratio of delay times in either O2/He and O2/N2, or in O2/He
oxygen supply to the photocytes, relieving intracellular anoxia and and O2/SF6 gas mixtures, tN∑/O∑/tHe/O∑ and tSF6/O∑/tHe/O∑,
enabling light emission (molecular oxygen is required). As tracheolar respectively, were calculated and the data presented in Table 1.
cell osmotic potential returns to the resting state, tracheolar fluid levels The greater the distance from the gating structure to the
increase, oxygen diffusion to the photocytes is decreased, intracellular photocytes, the more this value will increase from unity. It can
anoxia occurs in the photocytes and light emission is inhibited. be seen from Table 1 that the mean ratio of delay time in low-
diffusivity gas/high-diffusivity gas mixture in the same
0.154±0.05 s in nitrogen and helium carrier gases, respectively. specimen was 0.997±0.022, implying either that a gas-phase
The pseudoflash occurs due to accumulation of the LL-AMP gating structure must be close to the photocyte or that gas-phase
complex within the photocytes (Reaction 1) caused by the gating is not important in flash control. The time taken for gas-Firefly flashing is controlled by gating oxygen 2799
phase diffusion from such a structure to the photocyte must to how oxygen supply to the photocyte might be gated, and
therefore be less than the observed experimental error, hence provide the mechanism of flash control.
approximately 2 ms, corresponding to an r.m.s. distance in the From Krogh’s equation of diffusion in a planar model
gas phase from the gating structure to the photocyte of about (applicable to supply by tracheoles where length >> area), one
300 µm. This is substantially less than the average gas-phase can define the value of any particular barrier to oxygen
distance from the spiracles to the photocyte (see later) and so diffusion in terms of the gradient in PO∑ required to maintain
these cannot be sites of gas-phase oxygen gating. However, the a given oxygen flux through that barrier
distance from the tracheal end cell to the photocyte is within this
∆PO∑ × ṀO2−1 = α−1 × dO2−1 × l , (1)
value (Ghiradella, 1977; Ghiradella, 1998; Case and Strause,
1978) and so these measurements do not discount its prior where ṀO2 is oxygen flux (moles s−1 m−2), α is oxygen
assignment as the potential oxygen gating structure (Alexander, solubility (at 0.01 moles m−3 kPa−1), dO∑ is the diffusion
1943), although this is now thought not to be the case. coefficient of oxygen (3.0×10⁻⁹ m2 s−1), ∆PO∑ is the difference
in oxygen partial pressure (kPa) and l is diffusion pathlength
Calculation of gas- and aqueous-phase diffusional barriers (m). Using this we can calculate the overall barrier to diffusion
for oxygen supply to photocytes from the spiracle to the photocyte in the aqueous phases for two
By analysing the delay required for peak pseudoflash intensity cases of tracheolar fluid length observed, namely the value of
in different gas mixtures, it is possible to calculate the r.m.s. 120 µm during the dark phase between spontaneous flashes, and
pathlengths of diffusion in the gaseous and aqueous phases the near-minimum possible value of 27.4 µm from pseudoflash
(Timmins et al., 2000), and this leads to values of 2.21±0.24 mm measurements, with a constant air pathlength of 2.21 mm.
and 27.4±5 µm, respectively. These values are in agreement with This leads to values of 4.0×10⁶ and 9.13× 10⁵ kPa mol−1 s m2,
overall morphology of the firefly lantern (Ghiradella, 1977; respectively, during the dark phase between flashing and during
Ghiradella, 1998; Case and Strause, 1978). During the period of anoxia, respectively (the value for the gaseous phase is much
anoxia prior to initiation of the pseudoflash, the levels of fluid smaller, at 10.5 kPa mol−1 s m2), indicating that the difference in
in the tracheoles will be minimised, decreasing the barrier PO∑ must be 4.3-fold greater in the former case to ensure
against oxygen diffusion to the photocytes they supply oxygenation in the photocyte. This correlates with the
(Wigglesworth et al., 1935). This presumably occurs through the observation that in the dark phase in a normoxic environment,
osmotic mechanism proposed by Wigglesworth, in which bioluminescence is achieved by maintaining anoxia within the
intracellular accumulation of metabolites from anaerobic photocyte, and that by increasing the gradient in PO∑ from the
metabolism during hypoxia increases the intracellular osmotic external environment to the photocyte by fivefold (21–101 kPa)
potential, with diffusion of fluid from the tracheoles into the cells this repression of bioluminescence is lifted.
being driven by this change in osmotic pressure. Thus the The even greater tracheolar fluid length in non-
pathlength of aqueous-phase diffusion measured in these spontaneously flashing specimens (approximately 220 µm)
experiments approaches the minimum possible dictated by implies that during periods when flashing does not occur, an
lantern morphology and physiology, although that occurring even greater barrier to oxygen diffusion to the photocytes is
during flashing may be smaller. maintained. Anoxia within the central portions of the
Analysis of the delay to maximum light emission in photocytes (to maintain repression of light emission from the
hyperoxia-induced glowing is more complicated than the photocyte vesicles) is a function both of controlling oxygen
transient pseudoflash, as the former represents attainment of a diffusion by the length of the tracheolar fluid and of the oxygen
new steady state. However, the long times indicate the barrier consumption by mitochondria in the periphery of the
to diffusion occurs primarily in the aqueous phase, with the photocytes (adjacent to the tracheoles). Hence, increasing the
time to maximal glowing in spontaneously flashing and non- length of the tracheolar fluid when spontaneous flashing does
flashing samples (10.2 and 31.6 s) implying r.m.s. distances of not occur (i.e. most of the time) will allow a decrease in
diffusion in the aqueous phase of approximately 120 and mitochondrial respiration during this time, and this may be
220 µm, respectively (Boag, 1969). [From type ‘B’ boundary important in minimising the overall energetic cost of this
conditions for planar geometry, with 99% maximal diffusion mechanism. The requirement for a short period of time
into photocyte at dt/l2=2.0, where l is diffusion pathlength; pp. between physical stimulation and competency for light
170–171.] These must represent the extent of fluid filling the emission observed by Case and Buck (Case and Buck, 1963),
terminal portions of the tracheoles during the period between during which atypical light emission (dim, localised glowing,
flashes and during non-flashing periods, respectively, as these blushing and a final flash) can occur, may in part result from
are much greater than the r.m.s. aqueous-phase diffusion the time taken to induce a reduction in tracheolar fluid length
distance measured in pseudoflash experiments (such values are from approximately 220 to 120 µm, i.e. changing from a
within the typical length of tracheoles in a variety of insect ‘resting’ to a ‘primed’ state. However, and perhaps more
tissues, i.e. 200–300 µm, although some filling of the smaller importantly, during this time one might reasonably expect
trachea supplying the tracheoles may also occur). The large temporary mismatches between increasing oxygen supply
differences in the length of the aqueous-phase diffusional (by decreasing tracheolar fluid levels) and increasing
barrier dependant upon oxygen supply also provide a hint as mitochondrial consumption (to maintain anoxia within the2800 G. S. TIMMINS AND OTHERS
photocyte centre between flashes), which may result in this movement of an ion across a membrane (analogous is the case
atypical light emission. for Ca2+ activation of muscle contraction). The morphology of
Thus, a system of controlling oxygen access to the both the tracheolar and tracheal end cells appears to be
photocytes by modulating tracheolar fluid levels is in classically adapted to sodium pumping (Ghiradella, 1977;
agreement with the calculated diffusional barriers from fireflies Ghiradella, 1998), and so this may well be the ion utilised. This
in vivo. Since it occurs by changes in the length of the aqueous- increases tracheolar cell osmotic pressure and results in the
phase diffusional pathlength, it is also consistent with the absorption of fluid from the tracheoles into the tracheolar cell
observation that alteration of gas phase diffusion coefficients (and perhaps, hence, the tracheal end cell), with the uniquely
had no measurable effect upon flash kinetics in electrically strengthened structure of these tracheoles (Ghiradella, 1977)
stimulated fireflies. being required to withstand the lateral forces due to the large
and rapid changes in pressure. The decreased barrier against
A possible mechanism for modulating tracheolar fluid levels oxygen diffusion to the photocytes is now sufficiently low to
to control flashing allow transient oxygenation of the photocyte interior, and light
It has been argued that the repression of firefly emission. Fig. 2A,B shows diagrams of the postulated
bioluminescence is achieved by regulating oxygen access to mechanism, and Movie 4 provides a time course of this
the photocytes, and shown that the gating of oxygen access to mechanism. Rapid ending of increased tracheal end cell
photocytes by modulation of tracheolar fluid levels between osmotic pressure reverses the process, and results in an
values that have been directly measured in vivo provides a increase in tracheolar fluid level, raising the barrier against
mechanism for controlling oxygen access to the photocytes. oxygen diffusion to the photocytes, resulting in internal anoxia
We also know that adult firefly lantern tracheoles have a and repression of light emission.
uniquely strengthened structure (Ghiradella, 1977; Ghiradella, A key question is whether such a mechanism could operate
1998), that the nerves stimulating the flash motor unit with the speed required in order to be compatible with the
terminate upon the tracheal end cells and not the photocytes, observed kinetics of light emission, i.e. is there sufficient
and that these cells show morphological features characteristic time for the movement of a length of tracheolar fluid of
of cells adapted for active transport of ions and fluid; indeed approximately 100 µm within the time period between arrival
the foremost and lattermost observations led Ghiradella of the nervous action potential at the lantern and light emission
(Ghiradella, 1977; Ghiradella, 1998) to conclude that some sort (typically 40–60 ms)? It would appear that firefly tracheoles
of osmotic mechanism might be involved in controlling the are highly permeable to water (Ghiradella, 1998), and this may
flash. Maloeuf (Maloeuf, 1938) observed that injection of a result from the presence of specific water-channel proteins,
hypertonic solution into fireflies resulted in continual and aquaporins, known to occur in other insect tracheoles
prolonged glowing, and interpreted this as showing that a (Pietrantonio et al., 2000). Such high permeability is a
decrease in tracheolar fluid levels (due to the resultant fundamental requirement for the operation of such a
increased osmotic pressure in the insect abdomen) resulted in mechanism. Since the transport of tracheolar fluid into the
an increased transport of oxygen to the light-emitting cells. tracheolar cell will presumably occur axially along the
Maloeuf suggested that a direct change in photocyte osmotic strengthened wall of the tracheole, the diffusional path length
potential would modulate tracheolar fluid levels and therefore of water from inside the tracheole into the tracheolar cell
control the flash (although later studies showing a lack of direct (resulting from the change in osmotic potential) will only be
photocyte innervation make this less likely; Ghiradella, 1977; of the order of approximately 10 µm, requiring approximately
Ghiradella, 1998; Case and Strause, 1978). This mechanism 25×10−6 s, with bulk flow along the tracheole (which is not
was later argued against by Alexander (Alexander, 1943) who, restricted by diffusion) being responsible for most of the
although concurring that modulation of tracheolar fluid levels required length of movement of fluid. Thus, such a mechanism
occurred, and was important in a ‘secondary regulatory nature could indeed operate sufficiently rapidly to be consistent with
rather than being involved in the flash itself’, rather suggested the observed kinetics of light emission in vivo.
that the primary mechanism of controlling the flash through The evolution of such a mechanism for the rapid control of
oxygen supply to the photocytes was the tracheal end cell light emission (as opposed to the slower acting mechanism in
acting as a mechanical gas-phase valve; however, this has been the larval form, presumably acting via control of the reaction
discounted (Case and Strause, 1978). of luciferin with ATP; Case and Strause, 1978) can therefore
All of these disparate observations are most convincingly be envisaged as having merely required progressive
integrated into one mechanism by which the access of oxygen modifications to one of the preexisting mechanisms by which
to the photocyte is gated by modulation of tracheolar fluid insects control tissue oxygen supply, rather than the less likely
levels, as hypothesised by Malouef (Malouef, 1938), but with concept of development of an entirely novel mechanism for
changes in fluid levels being actively brought about by nervous gating oxygen access. Since present-day selection by females
stimulation of the cells that are innervated, the tracheal end for more rapidly flashing males (in Photinus consimilis) is
cells. This nervous stimulation is postulated to result in rapid known to occur (Branham and Greenfield, 1996), a similar
and transient fluid uptake into the tracheal end cell and the selection process could feasibly have provided the
tracheolar cell that ensheathes the tracheoles, probably by evolutionary pressure required for its initial development andFirefly flashing is controlled by gating oxygen 2801
refinement. It is also interesting to speculate that the active Branham, M. A. and Greenfield, M. D. (1996). Flashing males win mate
control of tracheolar fluid length in modulating oxygen supply success. Nature 381, 745–746.
Buck, J., Case, J. F. and Hanson, F. E. (1963). Control of flashing in fireflies
to tissues, as opposed to that passively caused by intracellular III. Peripheral excitation. Biol. Bull. 125, 251–269.
accumulation of metabolites from anaerobic metabolism Case, J. F. and Buck, J. (1963). Control of flashing in fireflies II. Role of
during hypoxia as proposed by Wigglesworth (Wigglesworth, central nervous system. Biol. Bull. 125, 234–250.
Case, J. F. and Strause, L. G. (1978). Neurally controlled luminescent
1935), might be more widespread in insects. systems. In Bioluminescence in Action (ed. P. J. Herring), pp. 331–345.
Finally, it is also worth noting that an analogous system of London: Academic Press.
oxygen control by using an aqueous-phase diffusion barrier Chang, H. K. (1987). In Handbook of Physiology, Section 3, vol. 4, The
Respiratory System (ed. L. E. Farhi and S. M. Tenney), pp. 31–50. Bethseda:
of variable length at the ends of a predominantly gas-phase American Physiological Society.
oxygen supply system, although more slowly acting, has De Luca, M. and McElroy, W. D. (1974). Kinetics of the firefly luciferase
evolved to control the oxygen supply to the symbiotic catalyzed reactions. Biochemistry 13, 921–925.
Ghiradella, H. (1977). Fine structure of the tracheoles of the lantern of a
bacteroids in legume nodules. These must meet the photurid firefly. J. Morph. 153, 187–204.
requirement for oxygen for aerobic energy metabolism Ghiradella, H. (1998). Anatomy of light production: the firefly lantern. In
(nitrogen fixation is highly endergonic) whilst avoiding Microscopic Anatomy of Invertebrates, vol. 11A (ed. M. Locke and F. W.
Harrison), pp. 363–381. New York: Wiley and Sons.
oxygen-induced destruction of the bacterial enzyme Hastings, J. W. and Buck, J. (1956). The firefly pseudoflash in relation to
nitrogenase, in the face of an oxygen supply that can vary photogenic control. Biol. Bull. 111, 101–113.
widely, as soil oxygen concentrations greatly vary due to Kastle, J. H. and McDermott, F. A. (1910). Some observations on the
production of light by the firefly. Am. J. Physiol. 27, 122–157.
flooding (Witty and Minchin, 1998). Thus, similar Lighton, J. R. B. (1996). Discontinuous gas exchange in insects. Ann. Rev.
mechanisms to achieve control of cellular oxygen Entomol. 41, 309–324
concentrations would appear to have evolved in both animal Maloeuf, N. S. R. (1938). The basis of the rhythmic flashing of the firefly.
Ann. Entom. Soc. Amer. 31, 374–380.
and plant kingdoms, which is an interesting demonstration of Pietrantonio, P. V., Jagge, C., Keeley, L. L. and Ross, L. S. (2000). Cloning
convergent evolution. of an aquaporin-like cDNA and in situ hybridisation in adults of the
mosquito Aedes aegypti (Diptera: Culicidae). Insect Mol. Biol. 9, 407–418.
Smalley, K. N., Tarwater, D. E. and Davidson, T. L. (1980). Localization
We dedicate this work to J. F. Case (University of of fluorescent compounds in the firefly light organ. J. Histochem. Cytochem.
California at Santa Barbara, USA), T. Wilson (Harvard, 28, 323–329.
USA), and especially E. J. H. Bechara (University of São Snell, P. A. (1932). The control of luminescence in the male Lampyrid firefly,
Photuris pennsylvanica, with special reference to the effect of oxygen
Paula, Brazil) and J. W. Hastings (Harvard, USA), for tension on flashing. J. Cell Comp. Physiol. 1, 37–51.
initiating and continually guiding these and other studies of Subczynski, W. K., Hopwood, L. E. and Hyde, J. S. (1992). Is the
bioluminescence. We thank the Barlowe and Haskell families mammalian cell plasma membrane a barrier to oxygen transport? J. Gen.
Physiol. 100, 69–87.
(Dartmouth College) for sample collection; the Media Timmins, G. S., Penatti, C. A. A., Bechara, E. J. H. and Swartz, H. M.
Resources Centre, University of Wales College of Medicine, (1999). Measurement of oxygen partial pressure, its control during hypoxia
UK, for video editing and illustrations; and the Company of and hyperoxia, and its effect upon light emission in a bioluminescent elaterid
larva. J. Exp. Biol. 202, 2631–2638.
Biologists (Travelling Fellowship to G.S.T.) and the NIH Timmins, G. S., Bechara, E. J. H. and Swartz, H. M. (2000). Direct
(grant P41 RR11602 to H.M.S.) for financial support. determination of the kinetics of oxygen diffusion to the photocytes of a
bioluminescent elaterid larva, measurement of gas- and aqueous-phase
diffusional barriers and modelling of oxygen supply. J. Exp. Biol. 203,
2479–2484.
References Wigglesworth, V. B. (1935). Regulation of respiration in the flea, Xenopsylla
Alexander, R. S. (1943). Factors controlling firefly luminescence. J. Cell. cheopsis, Roths. (Pulicidae). Proc. Roy. Soc. Lond. B 118 397–419
Comp. Physiol. 22, 51–71. Wilson, T. and Hastings, J. W. (1998). Bioluminescence. Ann. Rev. Cell.
Altschul, S. F., Madden, T. L., Schäffer, A. A., Zhang, J., Zhang, Z., Dev. Biol. 14 197–230.
Miller, W. and Lipman, D. J. (1997). Gapped BLAST and PSI-BLAST: Witty, J. F. and Minchin, F. R. (1998). Hydrogen measurements provide
a new generation of protein database search programs. Nucleic Acids Res. direct evidence for a variable physical barrier to gas diffusion in legume
25, 3389–3402. nodules J. Exp. Bot. 49, 1015–1020.
Boag, J. W. (1969). Oxygen diffusion and oxygen depletion problems in Wood, K. V. (1995). The chemical and evolutionary development of beetle
radiobiology. Curr. Top. Radiat. Res. 5, 141–195. bioluminescence. Photochem. Photobiol. 62, 662–673.You can also read