Development of The NGV Market & Infrastructure in the U.S.
←
→
Page content transcription
If your browser does not render page correctly, please read the page content below
Development of The NGV Market & Infrastructure in the U.S.

Thanks to the sponsors & supporters

Argonne National Laboratory’s work is supported by the U.S.
Department of Energy, Office of Energy Efficiency and Renewable
Energy. This work has been supported and assisted by:
                                   Office of Energy    Linda Bluestein
                                   Efficiency &         Dennis Smith
                                   Renewable             Mark Smith
                                   Energy
                  Office of American Affairs | International Affairs
                  Elena Berger

                  Marianne Mintz
                  Michael Wang
                  Andy Burnham
                  Marcy Rood

Input also provided by: Clean Energy Fuels; Gladstein, Neandros &
Associates; and NGVAmerica.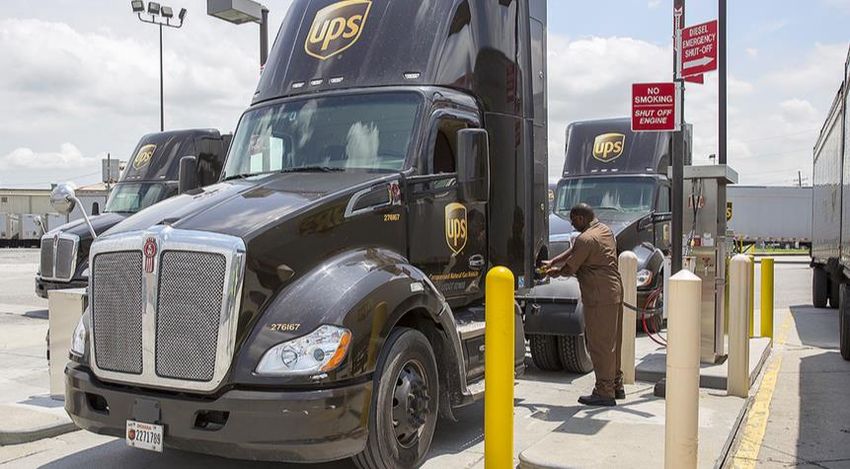
WHY NGVs?
• Long term energy supply & excellent
  delivery network worldwide
• Technology is available
• Economical
- Vehicles more expensive
- Fuel (almost always) is cheaper
• Environmentally friendly
• Safe

NGV CHALLENGES
• Vehicle range is 30% of petrol (gaseous fuels
  have less energy than liquids) or 60% of
  diesel with LNG
• Fueling station infrastructure needs to be
  developed proportionally to vehicle growth
• Fuel storage, range & fuel infrastructure
  issues shared by all AFV*s

 Fleet Fuelling             Public fuelling   Home fuelling appliances

 *AFV=Alternative Fuel Vehicles
NGVs in the Global Context
NGVs IN THE WORLD                                                                  World Total
                                                                            ~ 26.0 M               31,392
  December 2018                                                      NGVs                Fuelling Stations (FS)

                                                      Europe (incl. IT & RU)
                                                          1.866,611

                                                                                     Russia
              Canada                                                                 110,050
              15,000                       Italy
                                                                           Pakistan                       Japan
                                       1,004,982                           3,000.000
                                                                   Iran                                   47,158
              USA 175.000
                                                                4,502,000
                                                                                                    China
                                     Venezuela                   Egypt                            6,760.000
                                                                185,000          India
                                      226,100                                  3.250.139
    Colombia 571,668
                                            Brazil                                     Thailand.
           Bolivia 351,398                2,354,718                                     474.468
                                                                                             Australia
       Argentina 1,652,939                                                                    3.110

Data source: NGV Global 2018. Note: Years data collected varies but is ‘most current.’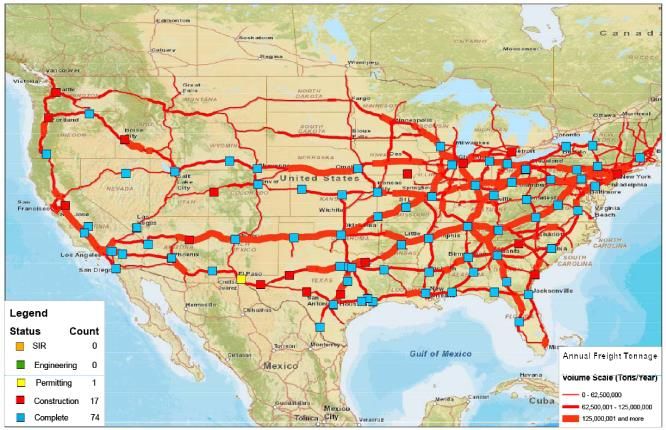
The top 10 NGV countries in the world & vehicles
                  per station
       CNG Station Economics Achieved!
                            December 2018
                            Fuelling    Vehicles per fuelling
               Total NGVs
                            stations           station
    China      6,760,000     9,000              751
     Iran      4,502,000     2,400             1,875
     India     3,250,000     1,500             2,166
   Pakistan    3,000.000     3,416              878
    Brazil     2,354,718     1.563             1,506
   Argentina   1,652,939      2019              819
                                                                Data
     Italy     1,004,982     1.219              824             sources:
                                                                NGV Global
  Uzbekistan    815,651       651              1,252             2018,
                                                                ANGVA &
   Colombia     571,668       813               703             ABEGAS
   Thailand     474.486       502               945             11-2019

     (600-1000 vehicles per station economically is optimal)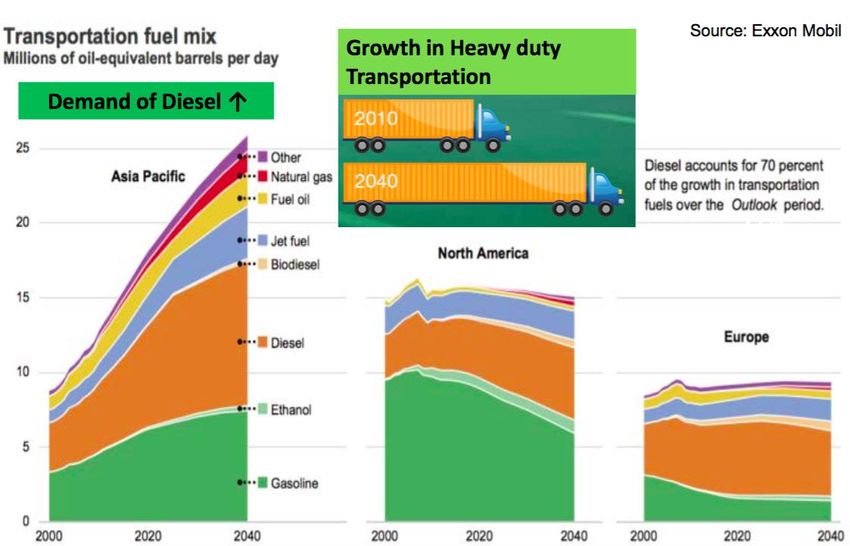
Top Ten NGV Countries in the World
                            % NGVs of All Vehicles
                                                            December 2018
                                                                                                          % NGVs of
                                                                     Total Vehicle                           All
                                    Total NGVs
                                                                     Population1                           Vehicles

                   China             6,760,000                        184,674,956                             3.66%
                    Iran             4,502,000                         14,130,000                               32%
                   India             3,250,000                         46,520,000                              6.9%
                 Pakistan*           3,000,000                           3,220,000                          93.2%(?)
                   Brazil            2,354,718                         43,598,000                              5.4%
                 Argentina           1,652,939                         14,109,000                             11.7%
                    Italy            1,004,982                         42,242,000                              2.4%
                                                                                                                                   Data
                 Uzbekistan            815,651                         1.634.600**                          49.9%(?)               source:
                                                                                                                                   NGV Global
                 Colombia              571,668                           5,332,000                            10.7%                2018

                  Thailand             474,486                         15,491,000                                3%
1InternationalAssoc Automobile Constructers (OICA), 2015 data; Transportation Energy Data Book, edition 37.2-2019,Oak Ridge National Labs
. *A vast majority of vehicles are Tuk-Tuks not autos. Auto population numbers subject to availability and very wide variation
**2010 data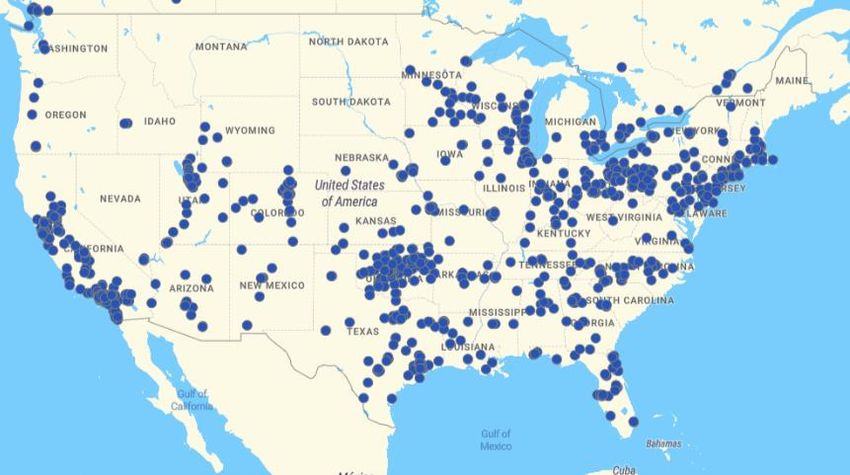
Natural Gas Vehicles Worldwide
                                                    Data Source: NGV Global
                                                  NGV (million)                   Linear (NGV (million))
35,0

30,0
              Current count (Jun 2018): 26.0 million
              Projection: Reach 30 million by 2021 (?)
25,0          Compound Annual Growth Rate                                                                                          26.0
              2000 - 2017: 19.1%                                                                                               23,9
                                                                                                                       22,5
20,0                                                                                                           21,2

                                                                                                       17,6
15,0                                                                                           16,7
                                                                                       15,1
                                                                               12,6
10,0                                                                   11,4
                                                                9,6
                                                         7,4
 5,0                                              5,8
                                           4,6
                                    3,9
       1,3 1,8 2,4 3,1
  -
       2000

               2001

                      2002

                             2003

                                    2004

                                           2005

                                                  2006

                                                         2007

                                                                2008

                                                                        2009

                                                                                2010

                                                                                        2011

                                                                                                2012

                                                                                                        2013

                                                                                                                2014

                                                                                                                        2015

                                                                                                                                2016

                                                                                                                                       2017

                                                                                                                                              2018

                                                                                                                                                     2019

                                                                                                                                                            2020

                                                                                                                                                                   2021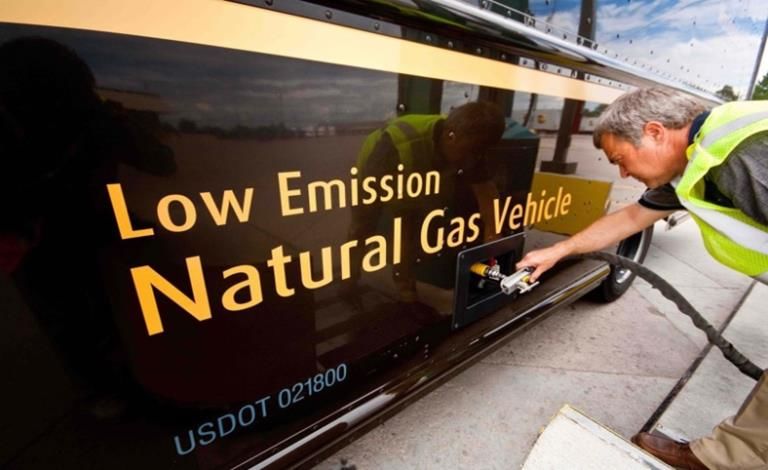
Growth is consistent but the growth rate
  drops as vehicle numbers increase
                    (take care making projections)
                    WORLD NGV GROWTH (millions)
 No. NGVs
 30,00                                                                                   140%
                                                                                25,99
                        122%                                                             120%
 25,00
                                                                       22,23
                                                                                         100%
 20,00
                                                  88%
                                                           16,10                         80%
                                  77%
 15,00
                                             10,92                                       60%
 10,00                                                          48%
                                                                          38%            40%
                               5,79
  5,00               3,27                                                                20%
                                                                                   17%
            1,47
    -          0%                                                                        0%
            2000     2003      2006          2009          2012        2015     2018
                                      ©IANGV 2018. www.ngvglobal.org
Passenger cars dominate the global
perspective of NGV use by vehicle type
but percentages show the country views
NGVs(000) % of NGVs
Source: Alternative fuels and infrastructure in seven non-EU markets, European
Commission, 2016.Future demand for transport fuels: Petroleum fuels will continue to have an important share Source: Exxon Mobil, from Auto Fuel Policy Interventions in India to Improve Air Quality, Dr. R.K.Malhotra.
HD trucks will continue to be important in the
                 transport sector
(Other factors: roads & condition; railway use; etc.)

                                                                                             EU-27

                                                                                               U.S.

                                                                                               Brazil

Source: Alternative fuels and infrastructure in seven non-EU markets, European Commission,
2016. from ICCT, 2012.
The long term supply outlook for
fossil natural gas is excellent
Source: The Outlook for Energy: View to 2040, ExxonMobilRenewable biomethane also will play an
increasing role in the future ‘methane mix’.
European View
Renewable
fraction
Source: NGVA Europe & European Biogas Association (2018).Why RNG?
Because the carbon footprint on a Well-to-Wheel
basis is the lowest of all the fuels.
passenger cars relative to diesel (left) and gasoline (right),
using current average emission factors
Diesel reference Gasoline reference
Source: www.fuelswitch.nl compiled from many sources from 2002-2011, Alternative
fuels and infrastructure in seven non-EU markets, European Commission, 2016.Crude Oil vs Natural Gas Prices
(to Feb 2019)
GGE to bbl = $bbl 42 gals 2 x3 = $1.99 gal pre tax
$/Bbl $Mcf
~ 2009 oil & gas price ‘decoupled’
US$55.80 bbl
US$3.19 Mcf
Source:https://www.macrotrends.net/2500/crude-oil-vs-natural-gas-chartAlternative Fuel Prices vs Gasoline (US)
The precipitous fall in petroleum fuel price
presents significant challenges as the price differential erodes
In January 2016, CNG
cost about $0.11 more
GASOLINE than gasoline on a per
gasoline gallon equivalent
(GGE) basis
CNG
Alternative Fuel Price Report, Alternative Fuel Data Center, April 2019,
https://afdc.energy.gov/files/u/publication/alternative_fuel_price_report_jan_2019.pdfAlternative Fuel Prices vs Diesel (US)
LNG for trucks remains ‘competitive’ with diesel
In January 2016, CNG
cost about $0.13 more
than diesel on a per
gasoline gallon equivalent
(GGE) basis
DIESEL
CNG
LNG
Alternative Fuel Price Report, Alternative Fuel Data Center, April 2019,
https://afdc.energy.gov/files/u/publication/alternative_fuel_price_report_jan_2019.pdfThe outlook on fuel pricing, from today’s
perspective, is very positive for natural
gas on a global basisRestructuring fuel taxes can dramatically alter
the economics of cleaner fuel alternatives.
(A carrot…… or a stick)
Harmonized to US$/gallon
UK US
Diesel = $3.39 Diesel = $0.25
Gasoline = $3.49 Gasoline = $0.19
Brazil
Diesel = $0.06
Gasoline = $0.12
Source: U.S. Alternative Fuel Data Center, 2019NGV Overview United States
2.5 million miles of natural gas
pipeline distribution system
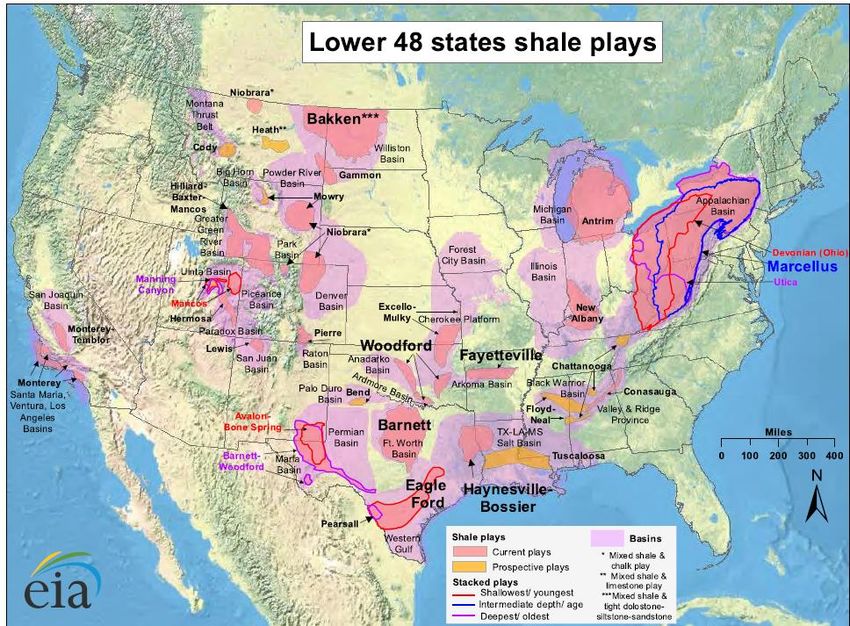
Source: Energy Information Administration, Office of Oil & Gas, U.S. DOE.Shale gas has been a game-changer to replace
imported oil: Anticipated 90 years supply
U.S. Energy Information Agency 2012Biogas potential is becoming legitimized:
Convert urban waste
in densely populated areas; agricultural
waste in farmlands
Source: GNA, Game Changer Technical white paper, full report, 2016Renewable Natural Gas (RNG) is taking a
larger share of NGV gas consumption:
from 5% in 2014 to 31% in 2017
Source: NGVAmericaRNG provides great opportunities to
reduced GHG and global warming
= WTW
Land Land
fill fill
AD=Anaerobic gas gas
digestion
Potential production of RNG could be 0.5 quads a year from the three sources
Total NG consumption ~24 quads in 2013
Source: GREET Model-Life cycle assessment of GHG emissions from diesel and natural gas
Fuels used in freight tansportation, A.Burnham, M.Wang, H.Cai, HEC Webinar 6 Feb 2018There are 12 LNG import terminals
in the U.S. although they are under utilized at
this moment
Source: FERC.gov, October 20199 Proposed LNG Export Terminals Source: FERC.gov, September 2019
CNG remains the cheapest of all fuels.* Low
  petroleum prices are a challenge to alternatives.
                                       (U.S. case, April 2019)

30%-50%

 petroleum                                                                            -20%
     vs.
  natural                                                                              -15%
   gas is
‘economic’
   basis

 *All fuels in energy equivalent basis. Source: Alternative Fuel Data Center, 2019.
NGV Technology
Where are they & what’s available in
the market?
Long & short haul truck About 30% of transit About 60% all new refuse
market continues buses operate on NG trucks orders are NG
transition
vessels
Rail industry piloting LNG
locomotives
Ready-Right-Now Technology On and Off the Road
Today.USA NGVs • Number of NGV: 175,000+ – Cars: 96,250* – Buses: 52,500* – Trucks: 26,250* – Others: - • Number of Fuelling Stations: 1,711 – CNG: Existing 1,592 Public: 898 Private: 694 – LNG: Existing 119 Public: 64 Private: 55 • Ratio NGV/FS: 102** + Various data sources show range from 175,000-195,000. *Extrapolated from 2015 ‘actual’ vehicle segmentation ** Including CNG & LNG, not distinguishing private vs public access Source: US AFDC & NGVAmerica
AFV/HEV/Diesel light duty vehicle
       offerings by fuel type 1991-2018
NGVs represent a small proportion of AFV products

                                                          NGVs

 AFV=Alternative fueled vehicle; HEV=Hybrid electric vehicle

Source: Alternative Fuel Data Center,2019. https://afdc.energy.gov/data/
LDV OEM models available
1991-2018
Relative small selection raises questions
about OEM commitment to NGVs
CNG (Dedicated and Bi-Fuel)
20
18
16
14
12 2018
10 PICK-UP
8
TRUCKS
& VANS;
6
NO
4 SEDANS
2
0
1991
1992
1993
1994
1995
1996
1997
1998
1999
2000
2001
2002
2003
2004
2005
2006
2007
2008
2009
2010
2011
2012
2013
2014
2015
2016
2017
2018
Source: U.S. AFDC2018 OEM (direct) LDV/MDV
2019
OEM Brand/Name Type
Chevrolet Express 2500 Van
Silverado 2500 HD
Chevrolet 2WD/4WD Truck
Ford F-150 Truck
Ford Super Duty F-250 Truck
Transit 150/250
Ford Van/Wagon Van
Transit Connect
Ford Van/Wagon Van
GMC Savana 2500 Van
Sierra 2500 HD
GMC 2WD/4WD Truck
Ram 2500 HD Truck
Source: Alternative Fuel Data Center (2018 & 2019 models)Most NGV options are available
through small vehicle modifiers (SVM)
(50 manufacturers/100+ models)
• SVM manufacture conversion systems that have been
certified and approved by the U.S. Environmental
Protection Agency (EPA) and/or the California Air
Resources Board (CARB)
• These approved systems can be installed on both
new and used vehicles to run on natural gas
• Six SVMs account for most of the light- and medium-
duty kits sold: Altech-Eco, BAF, IMPCO, Landi Renzo,
NGV Conversions and Natural Drive.
• The total cost to develop a kit and certify an NGV for
FMVSS* can exceed $300,000 for SVMs.
• SVM costs are high while volumes are low.
*FVMSS=Federal Motor Vehicle Safety StandardsHeavy duty vehicles in the U.S.
Most are NGV-available
Source: Alternative Fuels Data Center, U.S. Department of Energy. Types of Vehicles by Weight
Class. http://www.afdc.energy.gov/data/10381.HEAVY DUTY OVER-THE-ROAD NGVs Source: Gladstein & Neandros Associates (GNA)
Most heavy-duty natural gas trucks
     sold in US utilize Cummins Westport Inc.
               spark-ignited engines
                (ISL G and ISX12 G)

    In addition, the GM 6.0-liter and Ford 6.7-liter natural gas engines
        are commercially available options to power medium-duty
       applications such as step vans, shuttle buses, tow trucks and
                              beverage trucks
Source: GNA, Game Changer Technical white paper, full report, May 2016
Low NOx NGVs – trucks and buses -- are a more
cost-effective NOx reduction strategy than
diesel or electric counterparts
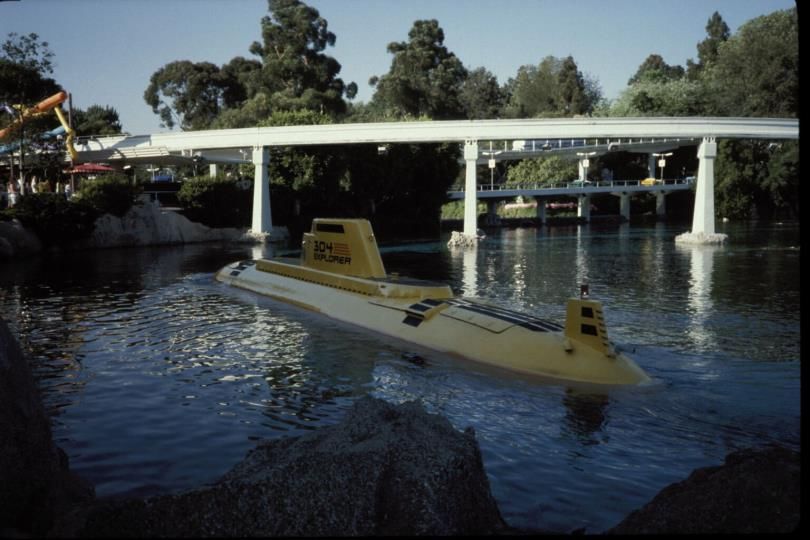
NGOff-Road NGVs
Mining, Farming, & Disney
Photo: NGV Journal CNH Industries
Photos: Gladstein Neandros
Disney
Submarine ride
Disney 20,000
Leagues
Under the SeaInternational Maritime Organization limits on
NOx emissions and sulphur limits in fuel has
begun the shift to LNG in the marine sector
NOx emissions reductions from engines % Sulphur reductions in fuel
New emissions limits and
sulphur content limits take
effect in U.S. and European
Emission Control Areas (ECAs)U.S. shipping is following the
worldwide move to LNG*
*As of April 2018: worldwide 121 existing LNG ships; 121 LNG ships on order; estimated
(unsubstantiated) 280 LNG ships in China. (DNV/GL Regulatory Update)‘LNG’ Port of the Future
A hub for LNG fueling
BUNKERING LNG TANKER TRUCKS TRUCK REFUELING LNG
- Shore to ship
- Ship to ship Potential for LNG railways
Image source: Natural Gas HHP Market Update, Gladstein, Neandross & Associates,
E.Neandrso 21 Feb 2018Next opening market will be
LNG freight trains. The heavily regulated
industry is beginning to look at new
standards for LNG propulsion & fueling
but the transition will take time.
Burlington Northern Santa Fe demo Florida East Coast Rail LNG project
Photos c/o Gladstein, Neandross & Associates, Natural Gas HHP Market Update, Feb.2018Developing the Fuel Infrastructure: Balancing the chicken & eggs
Different approaches to NGV market
   development help shape the growth of
        the fuel station infrastructure

France
UK

Germany
U.S.
Italy
Argentina-Taxis

Norway
CNG & LNG Station Growth:
Steady growth leveled off in 2016 when petroleum
prices dropped significantly.
CNG Fueling Station Count
3.000
Existing Planned Out of Service
2.500 CNG
878 Out of
2.000
Service
1.500
1.000
1,652 Existing
500
-
LNG Fueling Station Count
Existing Planned Out of Service
300
LNG
250
77 Out of
200
Service
150
100
140 Existing
50
0
US DOE AFDCWhere are the NGVs?
(Where there are NGV fuel stations)
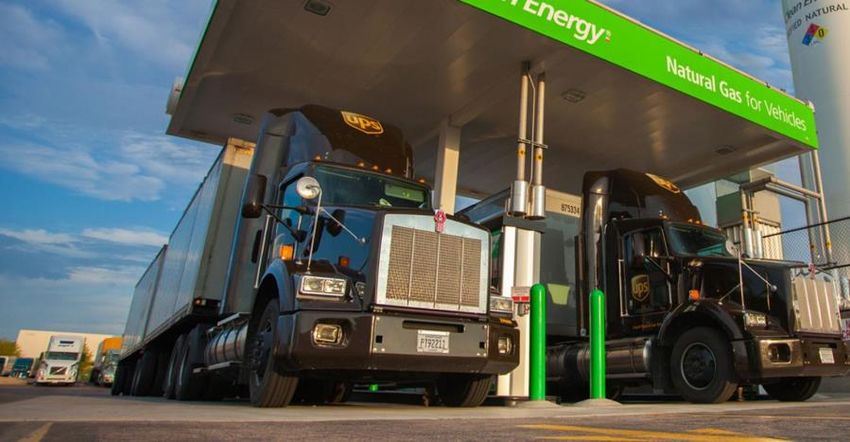
AFDC data base, October 2019UPS pioneered NGVs and now are
NGV Champions
• UPS started their
commitment to NGVs
in the late 1990s
• 6,000 NGVs will be
added to their fleet by
2022. (total ~12,000)
• UPS has 61 of their
own NGV fuel stations
Fueling RNG at a Clean Energy stationIn the U.S. the convenience industry
sells 80% of the gasoline
Typically sales margins are higher for CNG than for gasolineThe NGV fuel station network is
diverse and expanding
1,589 CNG stations
15-20+ new per month,
but slowing
119 LNG stations
Multiple Stakeholders
Natural gas retail fuel
sellers
Gas exploration &
production
Leasing companies
Gas utilities
Traditional (mostly
independent) fuel retailers
C-Stores
Truck Stops
Grocery/Warehouse
stores
Data source: Natural Gas Vehicles in Today’s Marketplace, NGVAmerica 2019LNG Infrastructure Corridors
119 public LNG stations
Source: NGVAmerica, the status and future of the NGV market, May 2013 and Alternative
Fuels Data Center (AFDC), May 2016A variety of mobile fuel systems are available
for CNG & LNG that allow the market to grow
beyond the pipeline
Proof of Packaged Emergency Packaged Mother
Concept CNG Breakdown LNG Daughter &
Systems Systems Systems Systems Mobile
Storage
Systems
Raufoss: Power Varieties of Chart (US)
Pinnacle (U.S.)
Gen & nobile Chinese-built
fuelling mobile fuellers Xperion
CNG truck
Gazprom Dynetek
Korean IMW (U.S.A) Tokyo Gas L-CNG portable fueller
All-in-one mobile fuel compressor fuel truck
modular unit dispenser truckFuel signage & Display Units
GGE-DGE (or GLE & DLE)
(gasoline/diesel equivalent)
• Gas measuring terms are confusing to customers
(Sf3; M3; Kilograms)
• Most CNG meters weigh gas in mass (Kg)
• To make sense at the fuel pump and station
signage, equivalencies to gasoline & diesel is key!
• Legally dispensers also measure/test in mass.
• European approach (not finalized) = €/100km. (!?)
• See Annex 1 for details of each approach.
(U.S.) National Conference on Weights and Measures. (Nist Handbook 44- Mass Flow Meters). S.1.2. Compressed Natural
Gas and Liquefied Natural Gas Dispensers. – Except for non-retail fleet sales and other price contract sales, a compressed
natural gas and liquefied natural gas dispensers used to refuel vehicles shall be of the computing type and shall indicate the
quantity, the unit price, and the total price of each delivery. The dispensers shall display the mass measured for each
transaction either continuously on an external or internal display accessible during the inspection and test of the dispensers, or
display the quantity in mass units by using controls on the device.
(Added 1994). S.1.3.1.1. Compressed Natural Gas Used as an Engine Fuel and S.1.3.1.2. Liquefied Natural Gas Used
as an Engine FuelNGV POLICY
NGV Legislative Milestones

•   1988 Alternative Motor Fuels Act
•   1990 Clean Air Act Amendments
•   1992 Energy Policy Act
•   2005 Energy Policy Act
•   2015 Fixing America’s Surface
    Transportation (FAST) Act
Sample U.S. Government Policies for alternative fuel vehicles (AFVs) • 1988 funding research & development • 1990 NGV emissions regulations • 1992 tax deductions & mandates for NGVs - $2,000 LDVs; $5,000 HDVs - $50,000 fuel station installation - Fleet mandate transition to % AFVs • 2005 AFV tax credits $2,000-$32,000 for qualified MDV/HDVs • $$s grants to states & localities
Summary Overview
               U.S. NGVs 2019
• Market growth tied to gasoline and diesel price but…
• The price differential between gas & petrol is returning.
• CNG and LNG station network is expanding but the
  U.S. is a large landmass to cover so many gaps exist.
• Light/medium duty OEMs are available in various
  popular models mostly from SVMs* delivered through
  the OEM chain (warrantied buy not manufactured).
• Heavy duty vehicles are available but the engines are
  limited to mostly Cummins systems. Still this will be a
  growth sector.
• Cost of the natural gas vehicle systems are high.
*Small Vehicle Modifier
Summary Overview
U.S. NGVs 2019
• Government support and incentives are intermittent,
leaving much uncertainty for purchasers.
• Natural gas industry needs to purchase NGVs for their
own vehicle fleets.
• Renewable Natural Gas will play a more important role
as part of the overall CO2 reduction strategy.
• LNG trucks and station sales will stabilize.
• Marine applications will become more important and
ports will provide a place for crossover with LNG trucks
• Environmental benefits are more important now than
ever.
• Standards and regulatory frameworks are well-
developed, legitimizing the foundation for safety.ANNEX 1 • Fuel pump display standards, approaches and fuel equivalencies (U.S. & Europe) • International alternative fuel station signage • Market segmentation of U.S. vehicles by fuel type • Relative merits of CNG vs LNG • Source materials
U.S. National Conference on
        Weights & Measures ruling on
        gaseous fuel measurement &
             labeling (gasoline)
•   At its 79th annual meeting in July of 1994, NCWM adopted resolutions that:
•   “All natural gas kept, offered or exposed for sale or sold at retail as a vehicle
    fuel shall be in terms of the gasoline liter equivalent (GLE) or gasoline
    gallon equivalent (GGE), and
•   All retail natural gas dispensers shall be labeled with the conversion factor
    in terms of kilograms or pounds. The label shall be permanently and
    conspicuously displayed on the face of the dispenser and shall have either
    the statement ‘1 Gasoline Liter Equivalent (GLE) is equal to 0.678 kg of
    Natural Gas’ or ‘1 Gasoline Gallon Equivalent (GGE) is equal to 5.660 lbs
    (2.567 kg) of Natural Gas’ according to the method of sale used.”
U.S. Standard for Diesel Gallon/Liter
Equivalent
• Table B.4 of the Transportation Energy Data Book, on the heat
content of fuels
(http://cta.ornl.gov/data/tedb26/Spreadsheets/TableB_04.xls) lists
the net energy of gasoline as 115,400 BTU/Gal and diesel as
128,700 BTU/Gal.
• Therefore a Diesel Gallon Equivalent of natural gas
is: (128,700/115,400) X 5.660 = 6.312 lb (2.863 kg) and a Diesel
Liter Equivalent of natural gas is: (128,700/115,400 X 0.678 =
0.756 kg
• Note that this is not the same value as given above for Indolene,
EPA’s certification fuel in 1993. This is the Transportation Energy
Data Book’s best estimate of the BTU value of average gasoline in
use. Likewise the diesel fuel value is not necessarily the same as
EPA’s certification diesel (in1993 or today), but a best estimate of
the BTU value of average No. 2 diesel fuel in use.Properties of Conventional & Alternative
Gaseous FuelsProperties of Conventional & Alternative
Liquid FuelsEuropean fuel equivalency
mandate (results to be confirmed)
Approach: €/100 km traveled
• DIRECTIVE 2014/94/EU OF THE EUROPEAN PARLIAMENT AND OF THE COUNCIL of
22 October 2014 on the deployment of alternative fuels infrastructure (page L307/8)
• (51) Simple and easy-to-compare information on the prices of different fuels could play an
important role in enabling vehicle users to better evaluate the relative cost of individual
fuels available on the market. Therefore, when fuel prices are displayed at a fuel station, in
particular for natural gas and hydrogen, it should be possible for unit price comparison to
conventional fuels, such as ‘1 petrol litre equivalent’, to be displayed for information
purposes.
• On 4 March 2015, Committee on European Normalisation (CEN) Technical Board agreed
to the creation of a new Project Committee, CEN/TC 441, in order to develop (a) European
standard(s) on fuel labelling. The Project Committee will develop harmonized graphical
expressions and labelling requirements for marketed liquid and gaseous fuels. These
include petroleum-derived fuel blends, synthetic fuels, biofuels, natural gas, liquid
petroleum gas or hydrogen. Electricity is excluded from the scope of the new Project
Committee.
• The work to be carried out will support the implementation of Article 7 of the Directive on
the deployment of alternative fuels infrastructure (2014/94/EU). Article 7 establishes that
Member States should ensure that consistent and clear information is provided to
consumers on the compatibility of their vehicles with individual fuels placed on the market
or electricity recharging points. According to the Directive, this information shall be placed
on refuelling points, pumps and their nozzles and on those motor vehicles and their
manuals placed on the market after 18 November 2016.European Approach
(not finalized as of 2019)
Source: Final Report, Study on the Implementation of Article 7(3) of the Directive on the Deployment of
Alternative Fuels Infrastructure-Fuel Price Comparison, European Commission (http://bookshop.europa.eu)International Road Signage for CNG
& LNG & other fuel alternatives
• The Working Party 1, Road Traffic Safety within the UNECE Inland Transport
Committee deals explicitly with issues from the 1949 Convention on Road
Traffic, the 1968 Convention on Road Traffic, and the 1968 Convention on Road
Signs and Signals. These Conventions are subject to continual amendment by
WP1 members and interested parties such as non-governmental organizations
that bring various issues to the attention of WP1.
• CNG and LPG road signage were adopted in 2005; LNG & H2in 2010.
• Based on the ENGVA/IANGV proposals Germany and Switzerland
recommended signage (as adopted) for CNG in TRANS/WP.1/2005/7 30
December 2004. LNG, LPG & H2 signage is indicated in
ECE/TRANS/WP.1/2009/4 and all alternative fuel signage adopted by WP1 as a
consolidated resolution (RE.2) is enumerated in ECE/Trans/WP.1/119/Rev.2, 27
May 2010.
• Road signage for alternative fuels adopted in a Consolidated Resolution by the
UNECE now has recognized international ‘legal status’ but is not (yet) a finalized
amendment adopted in the 1968 Convention on Road Signs and Signals.Market segmentation of U.S. vehicles by fuel type
Relative Merits of CNG versus LNG
             CNG                                                LNG
     Benefits                                           Benefits
     •Lower fuel cost                                   •Longer range/lower weight
     •Transmission/distribution already in              •Lower tank cost
     place                                              •Less expensive fueling stations
     •Odorant helps leak detection                      Challenges
     Challenges                                         •Higher fuel cost
     •Shorter range/higher weight                       •Larger investment needed for LNG
     •Higher tank cost                                  supply chain
     •More expensive fueling stations                   •Boil off (use or lose if storing for long
     •Heat of compression for fast fill                 time)
                                                        •No odorant for leak detection
Current HD NG engine technologies no longer require the use of only LNG, unlike past high-
pressure direct injection (HPDI) 15L application that could not utilize CNG. Similarly, large
diameter side-saddle CNG tank technology for Class 8 trucks that address range issues coupled
with the Class 8 trucking shift to spoke/hub versus long haul opened those applications to CNG.

Source: Burnham, Andy, Assessment of Expanding Natural Gas Use in
Transportation, Argonne National Laboratory, 13 July 2018.
Source Materials • Case Study: Natural Gas Regional Transport Trucks, August 2016, U.S. DOE. https://afdc.energy.gov/files/u/publication/ng_regional_transport_truc ks.pdf • Costs Associated with CNG Vehicle Fueling Implementation: Factors to Consider in the Implementation of Fueling Stations & Equipment, U.S.DOE, September 2014. https://afdc.energy.gov/files/u/publication/cng_infrastructure_costs.p df • AFLEET tool to analyze AFV costs and benefits: afleet- web.es.anl.gov • The GREET® (Greenhouse gases, Regulated Emissions, and Energy use in Transportation) Model: Please visit greet.es.anl.gov
ANNEX 2
U.S. DOE AFLEET and GREET
          Models

          Please visit:
      afleet-web.es.anl.gov
        greet.es.anl.gov
“AFLEET Tool” To Analyze AFV Costs &
Benefits
• Examines light-duty & heavy-duty vehicle:
– Air pollutant emissions
– GHG emissions
– Petroleum use
– Cost of ownershi
• Contains 18 fuel/vehicle technologies
– Conventional
– Hybrids
– Plug-in electrics
– Alternative fuels: CNG, LNG, LPG, H2, ethanol, biodiesel, renewable
diesel
• Includes 7 Major Vehicle Types
– Cost, MPG, & VMT data on 26 vocations
• AFLEET Tool Online and Spreadsheet; HDVEC available at:
afleet-web.es.anl.gov
74Significant Diesel NOx Variability Above 2010 Standard,
While NGV Consistently Low
EPA 2010 Compliant Freight Trucks
10
9
8
7
6
Tailpipe NOx (g/mi)
5
4 EPA 2010 NOx
emission standard
3
2
1
0
Near-dock Local UDDS Regional Transient UDDS FTP MOVES
(avg 7 mph) (9 mph) (19 mph) (22 mph) (15 mph) (19 mph) (19 mph) nat'l run
(58 mph)
Duty-Cycle Duty-Cycle
(Carder 2014; Johnson 2016) (Sandhu 2017)
Diesel LNG, current NG engine LNG, near-zero NG engine
Diesel NOx impacted by real world SCR performance
– Low-speed, low-load operations
– Cold starts
75
Cai, 2017, Wells to Wheels: Environmental Implications of Natural Gas As A Transportation FuelThe GREET® (Greenhouse gases, Regulated Emissions,
and Energy use in Transportation) Model
GREET analyzes transportation and energy
systems:
– Energy use
– Greenhouse gases
– Air pollutants
– Water consumption
GREET free and public domain
– Updated and expanded annually
Source: GREET Model-Life cycle assessment of GHG emissions from diesel and natural gas
Fuels used in freight tansportation, A.Burnham, M.Wang, H.Cai, HEC Webinar 6 Feb 2018~30,000 registered GREET users globally Source: GREET Model-Life cycle assessment of GHG emissions from diesel and natural gas Fuels used in freight tansportation, A.Burnham, M.Wang, H.Cai, HEC Webinar 6 Feb 2018
You can also read