Goldman Sachs Global Energy Conference 2020 - Range Resources
←
→
Page content transcription
If your browser does not render page correctly, please read the page content below
Goldman Sachs Global Energy Conference 2020
Forward Looking Statements
All statements, except for statements of historical fact, made in this presentation regarding activities, events or developments the Company expects, believes or anticipates
will or may occur in the future are forward-looking statements within the meaning of Section 27A of the Securities Act of 1933, as amended, and Section 21E of the Securities
Exchange Act of 1934, as amended. These statements are based on assumptions and estimates that management believes are reasonable based on currently available
information; however, management's assumptions and Range's future performance are subject to a wide range of business risks and uncertainties and there is no assurance
that these goals and projections can or will be met. Any number of factors could cause actual results to differ materially from those in the forward-looking statements. Further
information on risks and uncertainties is available in Range's filings with the Securities and Exchange Commission (SEC), including its most recent Annual Report on Form 10-
K. Unless required by law, Range undertakes no obligation to publicly update or revise any forward-looking statements to reflect circumstances or events after the date they
are made.

The SEC permits oil and gas companies, in filings made with the SEC, to disclose proved reserves, which are estimates that geological and engineering data demonstrate
with reasonable certainty to be recoverable in future years from known reservoirs under existing economic and operating conditions as well as the option to disclose probable
and possible reserves. Range has elected not to disclose its probable and possible reserves in its filings with the SEC. Range uses certain broader terms such as "resource
potential,” “unrisked resource potential,” "unproved resource potential" or "upside" or other descriptions of volumes of resources potentially recoverable through additional
drilling or recovery techniques that may include probable and possible reserves as defined by the SEC's guidelines. Range has not attempted to distinguish probable and
possible reserves from these broader classifications. The SEC’s rules prohibit us from including in filings with the SEC these broader classifications of reserves. These
estimates are by their nature more speculative than estimates of proved, probable and possible reserves and accordingly are subject to substantially greater risk of actually
being realized. Unproved resource potential refers to Range's internal estimates of hydrocarbon quantities that may be potentially discovered through exploratory drilling or
recovered with additional drilling or recovery techniques and have not been reviewed by independent engineers. Unproved resource potential does not constitute reserves
within the meaning of the Society of Petroleum Engineer's Petroleum Resource Management System and does not include proved reserves. Area wide unproven resource
potential has not been fully risked by Range's management. “EUR”, or estimated ultimate recovery, refers to our management’s estimates of hydrocarbon quantities that may
be recovered from a well completed as a producer in the area. These quantities may not necessarily constitute or represent reserves within the meaning of the Society of
Petroleum Engineer’s Petroleum Resource Management System or the SEC’s oil and natural gas disclosure rules. Actual quantities that may be recovered from Range's
interests could differ substantially. Factors affecting ultimate recovery include the scope of Range's drilling program, which will be directly affected by the availability of capital,
drilling and production costs, commodity prices, availability of drilling services and equipment, drilling results, lease expirations, transportation constraints, regulatory
approvals, field spacing rules, recoveries of gas in place, length of horizontal laterals, actual drilling results, including geological and mechanical factors affecting recovery
rates and other factors. Estimates of resource potential may change significantly as development of our resource plays provides additional data.

In addition, our production forecasts and expectations for future periods are dependent upon many assumptions, including estimates of production decline rates from existing
wells and the undertaking and outcome of future drilling activity, which may be affected by significant commodity price declines or drilling cost increases. Investors are urged
to consider closely the disclosure in our most recent Annual Report on Form 10-K, available from our website at www.rangeresources.com or by written request to 100
Throckmorton Street, Suite 1200, Fort Worth, Texas 76102. You can also obtain this Form 10-K on the SEC’s website at www.sec.gov or by calling the SEC at 1-800-SEC-
0330.

                                                                                                                                                                                           2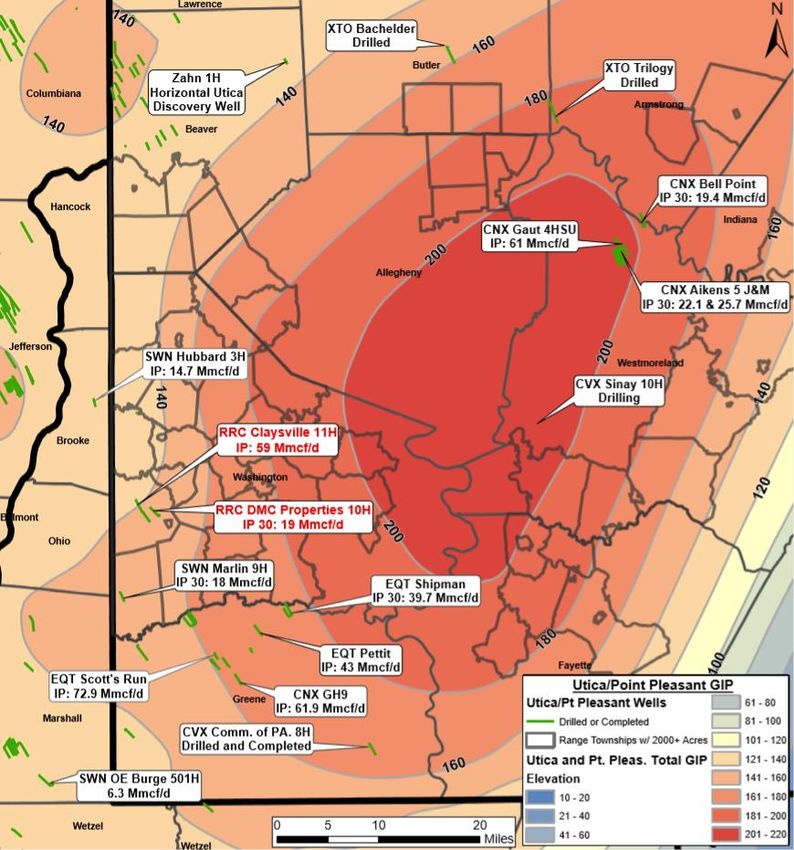
Range – At a Glance

Unmatched Southwest Appalachia Inventory
▪     Approximately one half million net acres provide decades of low-risk drilling inventory
▪     Contiguous position allows for efficient operations and long-lateral development
▪     Peer-leading well costs and productivity underpin top-tier recycle ratio
▪     Proved Reserves of 18.2 Tcfe at YE2019 – SEC PV-10 of over $17 per share, net of debt(a)

Sustainable Free Cash Flow
▪     Peer-leading well costs + Shallow base decline = Low maintenance capital requirements
▪     Low maintenance capital requirements support free cash flow through the cycles
▪     Cost structure improvements enhance margins and durability of free cash flow
▪     Disciplined spending evidenced by consecutive years of spending below original budget

Leader on Sustainability and Environmental Practices
▪     Reduced environmental impact and enhanced profitability through:
          ▪     Water recycling and logistics
          ▪     Long-lateral development
          ▪     Electric-powered fracturing fleet
          ▪     Innovative facility designs
          ▪     Robust LDAR program
(a)   SEC PV-10 assumes $2.58/Mmbtu NYMEX natural gas and $55.73/bbl WTI

                                                                                                 3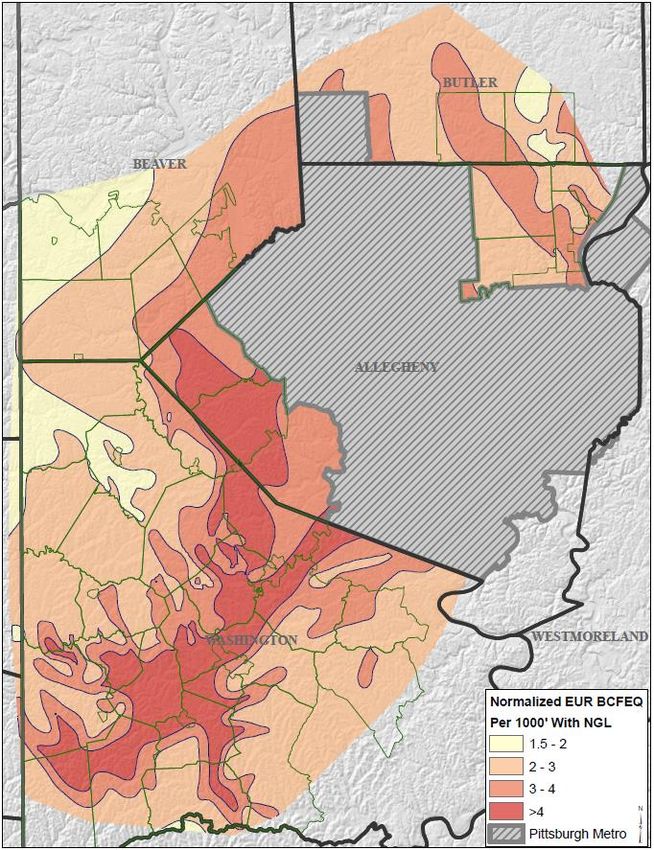
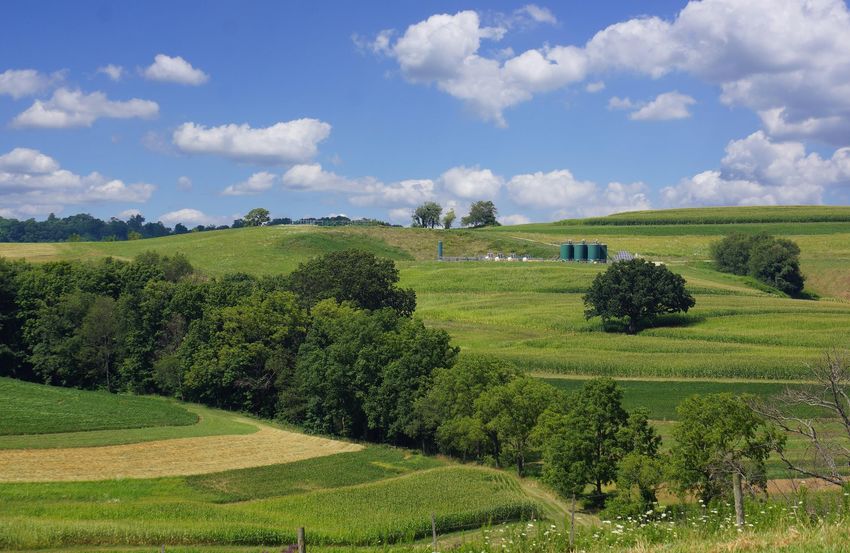
Unmatched Inventory in Southwest Appalachia
~3,700 undrilled core Marcellus wells(a)
                                                                                                   Range acreage
provide decades of low-risk drilling                                                               outlined in green
opportunities

Marcellus resource potential(b)
      ~ 40 Tcf of natural gas
      ~ 3 billion barrels of NGLs
      ~ 149 million barrels of condensate

Significant inventory of highly prolific
Utica wells extends Range’s dry gas
opportunity

Existing natural gas and NGL
infrastructure de-risks future
development

Contiguous acreage position provides
for operational efficiencies and industry
leading well costs:
▪      Long-lateral development
▪      Efficient water handling and long-term
       infrastructure utilization

(a)   Estimates as of YE2018; based on production history from ~1,000 Range-drilled wells. Includes ~300 locations not shown on map. Based on 10,000 ft lateral length
(b)   As of YE2018. Does not include over 18 Tcfe in proved reserves.

                                                                                                                                                                         4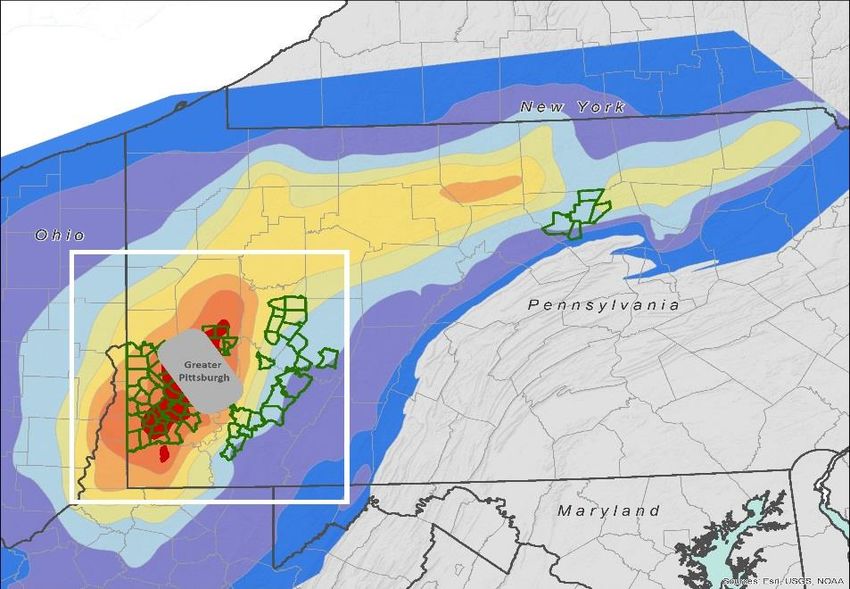
Value of Year-End 2019 Proved Reserves – Over $17 per share

                                                                           Included in SEC Reserves
                                                                           ▪   Only 5 years of development activity
                                                                           ▪   Proved Developed reserves of 9.9 Tcfe
                               Proved Developed                            ▪   Proved Undeveloped reserves of 8.3 Tcfe
                                      9.9 Tcfe                             ▪   Approximately 440 Marcellus locations
                                                Proved Undeveloped
                                                          8.3 Tcfe
                                                                           Reserve Value Ignores Resource Potential
                                                                           ▪   Resource Potential of ~100 Tcfe
                                                                           ▪   Over 3,000 undrilled core Marcellus wells, or over
                                                                               40 years of inventory at current drilling pace
                                                                           ▪   Potential from ~400,000 net acres of both core
                                                                               Utica and Upper Devonian
             Resource Potential
                     ~100 Tcfe                                             Reserve History
                                                                           ▪   PUD Development Costs consistently better than
                                                                               Appalachia peers
                                                                           ▪   Positive performance revisions to reserves each
                                                                               year for the last decade

            Range Currently Has a $100 Million Share Buyback Program
        Designed to Repurchase Shares at a Steep Discount to Intrinsic Value
Note: SEC PV-10 assumes $2.58/Mmbtu NYMEX natural gas and $55.73/bbl WTI

                                                                                                                             5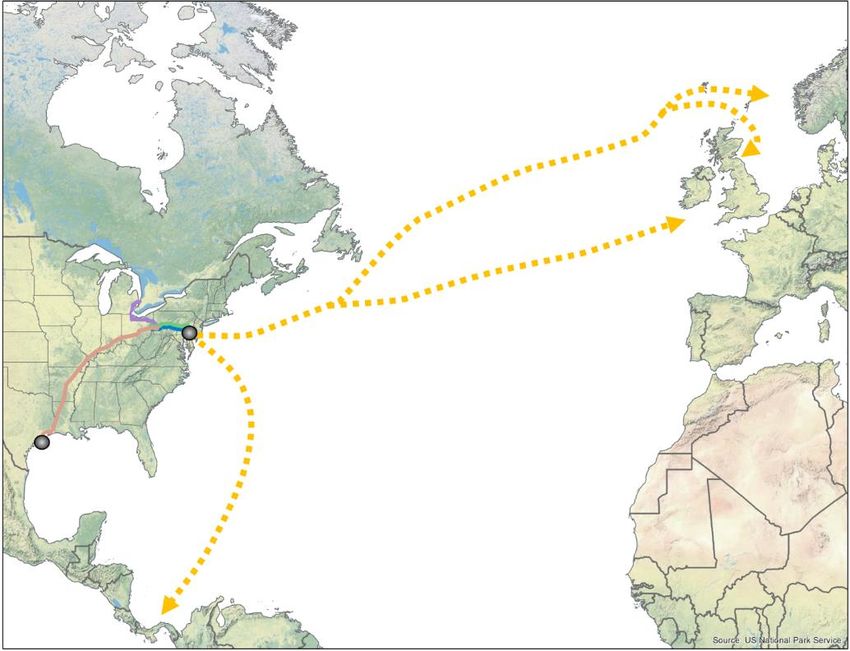
Capital Efficiency Driven by Peer-Leading Well Costs & Decline Rate
              Well Costs per Lateral Foot                                                                               2020 Decline Rate
   $1,400                                                                                          40%

   $1,200                                                                                          35%

   $1,000                                                                                          30%

     $800                                                                                          25%
                                                                                                   20%
     $600
                                                                                                   15%
     $400
                                                                                                   10%
     $200
                                                                                                      5%
       $0
             RRC      RRC    Peer 1 Peer 2 Peer 3 Peer 4 Peer 5 Peer 6                                0%
             2020     2019                                                                                    RRC    Peer 2   Peer 1   Peer 4   Peer 3    Peer 5    Peer 6

                                D&C Capex per Mcfepd Reflects Relative Capital Efficiency
                                            2018                                                                    Year-to-Date 2019
                                                                           $606
                                                       $550      $553
                                            $511
                                  $453
                        $380                                                                                                                                $394
              $377
                                                                                                                                                  $338
                                                                                                                              $301      $306
                                                                                                                    $278
                                                                                                           $259
                                                                                               $239

             Peer 4     RRC      Peer 1     Peer 6    Peer 3    Peer 2    Peer 5               RRC         Peer 4   Peer 2    Peer 3   Peer 6    Peer 1    Peer 5

                 Peer-Leading Development Costs & Decline Rate Drive
            Lowest Development Costs per Unit of Production in Appalachia
Note: Peers include AR, CNX, COG, EQT, GPOR and SWN. Peer estimates from company filings, presentations, transcripts, guidance and Range estimates. SWN estimates for 2018
represent Appalachia production and capital expenditures only.

                                                                                                                                                                             6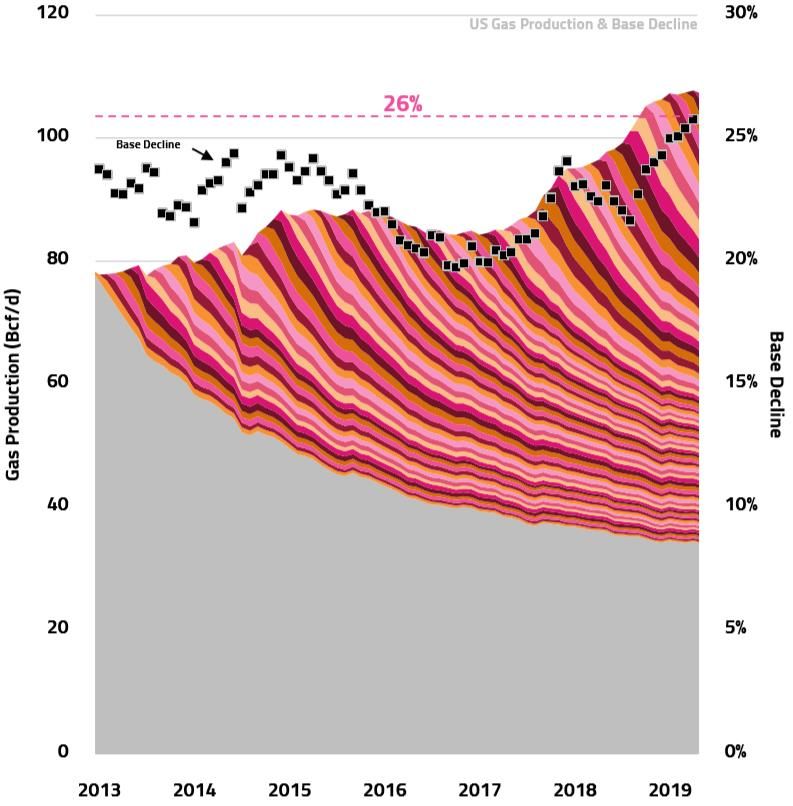
Cash Recycle Ratio Shows Quality and Durability of Asset Base

250%

200%

150%

100%

50%

 0%

                                         Appalachia Gas Peer                                            Oil Peer

 Source: MKM Partners. “Energy/Exploration & Production Outlook”. June 2019. Cash Recycle Ratio = Cash Operating Margin divided by Capital Intensity. Companies shown include
 APC, AR, CHK, CLR, CNX, COG, CRZO, CXO, DVN, ECA, EOG, EQT, GPOR, HES, HPR, LPI, MRO, MTDR, MUR, PDCE, PXD, SM, SRCI, SWN, WLL, WPX and XEC.

                                                                                                                                                                                7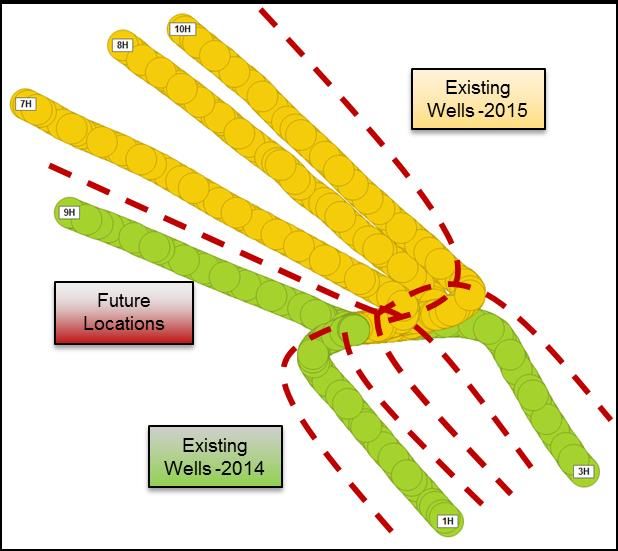
Maintenance Capital Drives Free Cash Flow Through the Cycles

                                    Shallow Base Decline Driven by:
                                    ▪ Core Marcellus position
                                    ▪ 10+ years of drilling history in Marcellus
                                      provides solid base of low-decline wells
                                    ▪ Infrastructure built to maximize returns, not
                                      peak initial rates
Sustainable           Shallow       ▪ 2020 base decline rate of ~20% is
                                      sustainable, even with modest growth in
Free Cash           Base Decline      base production
                                    ▪ Shallow base decline, coupled with efficient
                                      operations allows for low maintenance
                                      capital

                                    Low Maintenance Capital Supports
                                    Sustainable Free Cash Flow
                                    ▪ Minimum capital requirements to maintain
              Low                     existing production levels compared to
          Maintenance                 peers
                                    ▪ Generating free cash flow is priority in
            Capital                   capital allocation process
                                    ▪ Free cash flow is durable given Range’s
                                      multi-decade core Marcellus inventory

                                                                               8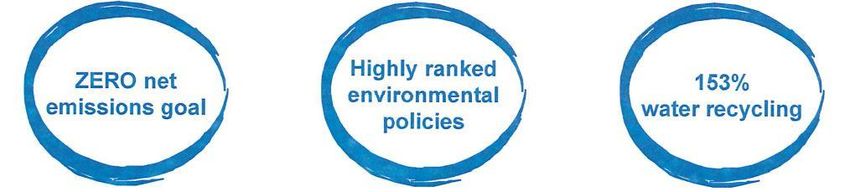
Improving Cost Structure Enhances Cash Flow & Margin Growth

                                    $2.20                                   Over Half of Targeted
                                                                            Savings Have Already
                                    $2.10                                      Been Achieved
Cash Operating Costs ($ per mcfe)

                                    $2.00
                                    $1.90
                                    $1.80
                                    $1.70
                                    $1.60
                                    $1.50
                                    $1.40
                                    $1.30
                                    $1.20
                                            4Q18           1Q19     2Q19               3Q19          4Q19           4Q23
                                                                                                              (Original Target)
                                                   TGP&C      LOE   Production Taxes          Cash G&A      Interest

                                      Q4 2019 Unit Costs Expected to Be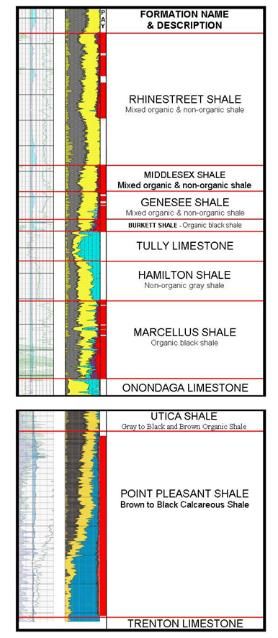
Leading in Sustainability and Environmental Practices

                                                         Environmental Responsibility Highlights

   Range is actively                                                Ranked second among                                                    Range’s water sharing
working to achieve zero                                             top producers on water                                                  program is recycling
 net emissions across                                                    management                                                         153% of its own and
     its operations                                                      and corporate                                                     offset producers water
                                                                    environmental policies1

   1   Rankings according to “Disclosing the Facts 2019: Transparency and Risk in Water & Chemicals Management for Hydraulic Fracturing Operations”

                                                                                                                                                            10
Natural Gas Demand – Increases 21 Bcf/d in Next 5 Years
2019-2024 Demand Outlook U.S. LNG Export Terminal Capacity (Bcf/d)
22
Port Arthur
▪ Total demand growth of +21 Bcf/d through 20
FERC Approved and/or
>70% long-term offtake Magnolia LNG
2024 from LNG and Mexican exports, 18
signed. Potential Next Freeport T4
industrial and electric power demand growth 16 Wave Projects. Cameron T4-T5
▪ LNG export capacity to increase by mid-2020 14 Under Construction
Golden Pass T1-T3
Sabine Pass T6
to 10 Bcf/d from projects under-construction 12 or In-Service
Calcasieu Pass
▪ Second Wave LNG Projects could add 10
Freeport T1-T3
Corpus Christi T3
another +10 Bcf/d of exports by 2025 8
Cameron T1-T3
▪ Continued coal (currently ~30% of power 6
Corpus Christi T1-T2
Elba Island
stack) and nuclear retirements (~20% of 4 Cove Point
power stack) 2 Sabine Pass T1-T5
0
12/16 12/17 12/18 12/19 12/20 12/21 12/22 12/23 12/24
U.S. LNG Export Demand Outlook Source: EIA, LNG Operator announcements
▪ Second Wave of U.S. LNG Projects has Futures Market Indicates LNG Arb is OPEN
started, with 5.1 Bcf/d already under- 8.00
construction and another +5 Bcf/d likely to 7.50
FID in 2019-2020 7.00
▪ Over 30 Bcf/d of Second-Wave LNG projects 6.50
have been proposed 6.00
$/MMbtu
▪ Futures prices support additional LNG 5.50
exports 5.00
▪ Range forecasts U.S. LNG export capacity to 4.50
reach ~13 Bcf/d in 2022 and ~18 Bcf/d by late 4.00
2023-early 2024 3.50
3.00
Nov-19 Nov-20 Nov-21 Nov-22 Nov-23 Nov-24
EU Gas (NBP) $/MMBtu USGC Delivered Full Cost to EU USGC Variable Cost to EU
Bloomberg prices as of 10/21/19.
11Natural Gas Supply - Base Decline & Capital Discipline
Base Declines Offset Current Activity U.S. Natural Gas Base Decline Rate
▪ Average U.S. decline rate of 26% equates to
~27 Bcf/d of new gas required each year to
simply hold production flat
▪ After drawing down DUCs, industry growth
should slow meaningfully into 2H2020 and
2021 if strip prices hold
Producer Discipline Materially
Impacts Supply Forecast
▪ Industry spending being limited to cash flow
in 2019 and beyond
▪ Consensus 4Q-4Q growth forecast now just
~4% (0.8 Bcf/d) for Appalachia peer group,
significantly improving gas macro for late
2020 and 2021
▪ Minimal Appalachia growth expected at
current strip pricing and ~50 rigs
▪ Private Equity-backed operators may shift to
a free cash flow model as traditional exit
strategies become challenged (IPO,
corporate M&A, etc.)
Associated Gas Growth Not Capable
of Offsetting Dry Gas Decline and Source: RS Energy
Expected Demand Growth
12NGL Macro Improving
New Export Infrastructure 2019-2020 Range’s Ability to Export Provides Price Diversity
▪ 2019 export capacity to increase by ~400 Ethane Price Diversity Propane & Butane
MBPD and by ~650 MBPD in 2020 versus EIA
gas plant LPG supply of 2,559 MBPD in Mont
September 2019. Belvieu
Northeast /
▪ U.S. waterborne export capacity increases Mont Belvieu
equivalent to over 40% of U.S. LPG supply, Oil-Linked
which should tighten balances going forward
▪ Local Northeast propane differentials have
narrowed since start up of Mariner East 2 Gas-Linked
Exports
Storage & Supply Note: Represents Appalachia only. Pie chart represents annual average. Range has the ability to
▪ Export-adjusted storage days of supply 18% increase domestic sales in winter months when local prices are strong.
below the five-year average as end of International Price Strength Versus Mont Belvieu
November $0.35
International Propane Arb ($ per gallon)
▪ NGL supply growth to slow in 2020 with $0.30
decreasing U.S. crude and natural gas supply
growth. $0.25
$0.20
$0.15
New Demand
$0.10
▪ Indian LPG import terminal expansions under-
construction/planned of 350 MBPD in 2020-25 $0.05
▪ In 2020, 5 PDH plants scheduled to start up in $0.00
China with combined capacity of 115 MBPD ($0.05)
propane demand
1/5/2018
2/5/2018
3/5/2018
4/5/2018
5/5/2018
6/5/2018
7/5/2018
8/5/2018
9/5/2018
1/5/2019
2/5/2019
3/5/2019
4/5/2019
5/5/2019
6/5/2019
7/5/2019
8/5/2019
9/5/2019
12/5/2018
10/5/2019
10/5/2018
11/5/2018
11/5/2019
12/5/2019
▪ Relative economics support use of LPG over
naphtha for international steam crackers Note: Calculated as front-month European C3 price (ARA), less shipping costs from the U.S. Gulf
Coast to Europe (ARA), relative to Mont Belvieu C3 price
13Range is Positioned Well for Low Commodity Prices
Self-Funded Business Model
$4,500
▪ Flexible capital program as all of Range’s firm
transportation commitments have been met $4,000
▪ Shallow base decline supports low maintenance
capital requirement Max Conforming
$3,500
▪ Low maintenance capital and high capital
efficiency promote free cash flow generation
through the cycles $3,000
▪ Marcellus inventory enables multi-decade, Borrowing Base
sustainable free cash flow profile $2,500
Liquidity Profile $2,000
▪ Ample liquidity given sustainable free cash flow $1,500
profile
▪ Over $1 billion in debt reduction since mid-2018 Elected Commitment
$1,000
▪ Credit facility unanimously ratified in March 2019
▪ $4+ billion max conforming borrowing base
$500
▪ Elected Commitment increased from $2.0 billion
to $2.4 billion in October 2019 Revolver Borrowings
▪ Revolver borrowings expected to be reduced via $0
potential asset sales and free cash flow Borrowings Credit Facility
generation ($ millions) ($ millions)
Note: Revolver borrowings as of 9/30/19.
14Appendix
Peer-Leading Capital Efficiency
         Range’s Estimated 2020 Capital Efficiency Remains Consistent With Prior Year,
             Versus Some Peers Who May Rely on One-Time DUC Drawdowns.
                  $500                                     Implied D&C Maintenance Capital per Mcfepd
                  $450

                  $400                                                                                                $384               $387                           $388

                  $350                                                                    $325
                                                                    $302                                              DUCs?                                             DUCs?
                  $300
                                       $260
                  $250

                  $200

                  $150
                                     RRC                    Peer 1                   Peer 2                   Peer 4                     Peer 3                Peer 5
                                                                           2018       2019       2020          3-Year Average

                                                                                                    2016       2017      2018         2019E       2020E
                                                                                                                                (a)                      (c)
                                                        4Q Production (Mmcfepd)                    1,854      2,170      2,260        2,340       2,300
                                                     Decline Rate from Prior Year 4Q                           24%        23%          20%        20%
                                                     4Q-4Q Base Decline (Mmcfepd)                              449        508          452        468
                                                                                                                                (b)        (b)
                                                        4Q-4Q Growth (Mmcfepd)                                 316        110          135         -40
                                                   Total Production Added (Mmcfepd)                            765        617          587        428
                                                     D&C Costs Incurred ($ millions)                         $1,180      $836         $665        $500
                                                     D&C Capex per Mcfepd Added                              $1,542     $1,354        $1,133     $1,168
                                                   Implied D&C Maintenance Capital                            $692       $688         $512        $547
                                              Implied D&C Maintenance Capital per Mcfepd                      $373       $317         $227        $234
Note: Southwest Appalachia peers include AR, CNX, EQT, GPOR and SWN. Peer estimates based on Company disclosures and Consensus estimates as of 12/31/19. (a) Includes 10 Bcfe of
curtailments in 4Q18 from third-party processing downtime. (b) Pro forma asset sales. (c) Illustrative example based on full-year 2020 guidance. Does not represent quarterly guidance.

                                                                                                                                                                                          16
D&C Capex per Mcfepd Reflects Relative Capital Efficiency
2018 Quarterly Summary
1Q18 2Q18 3Q18 4Q18
$192
$177 $180
$171
$165
$152 $156 $157
$152 $151
$139 $137
$124 $128
$118 $117
$108 $113
$104 $101
$97
$93
$84 $82 $84
$74
$61
$41
2019 Quarterly Summary
1Q19 2Q19 3Q19 4Q19E
$202
$169
$159
$139
$123 $123 $119
$117
$98
$93 $94 $91 $92 $94 $92 $91 $92
$89 $86
$80 $83 $79 $79
$72
$66
$53
$47
$37
Note: Peers include AR, CNX, COG, EQT, GPOR and SWN. Peer estimates from company filings, presentations, transcripts, guidance and Range estimates. SWN estimates for 2018
represent Appalachia production and capital expenditures only. 4Q19 estimates based on FactSet Consensus as of 12/31/19.
17Appalachia Assets – Stacked Pay
▪ ~1.5 million net effective acres(a) in PA
leads to decades of drilling inventory
▪ Gas In Place analysis shows the greatest
potential is in Southwest Pennsylvania
▪ Approximately 1,000 producing Marcellus
wells demonstrate high quality, consistent
results across Range’s position Gas In Place
▪ Near-term activity led by Core Marcellus For All Zones
development in Southwest PA
▪ Range’s Utica wells continue to produce
strongly and our most recent well continues
to be one of the best in the play
Upper
▪ Adequate takeaway capacity in Southwest
PA Devonian
Stacked Pay and Existing Marcellus
Pads Allow for Multiple
Development Opportunities Utica/Point
Pleasant
(a) Assumes stacked pay opportunities in Marcellus, Utica and Upper Devonian
18Targeting / Downspacing Production Results
3,000
2,500
▪ Optimized targeting shows ~50%
Normalized Mmcfe/Day per 1,000 ft.
2,000
increase in cumulative production after
1,300 days
▪ No detrimental production impact seen
1,500 on the original wells
1,000
500
-
0 200 400 600 800 1000 1200 1400
AVERAGE ORIGINAL TARGETING AVERAGE OPTIMIZED TARGETING
19Return to Existing Pads – Marcellus
100,000
Drilled
10,000
Wells - 2015
Additional 3 wells
Wellhead Gas (MCFD)
1,000
Future
Locations 100
10
Drilled
Wells - 2014
1
Mar-14 Oct-14 May-15 Dec-15 Jul-16 Mar-17 Oct-17 May-18 Dec-18
Wellhead Gas
Ability to target our best areas with significant cost savings
20Significant Utica Resource
▪ Range has drilled three Utica
wells
▪ Range’s third well appears to be
one of the best dry gas Utica
wells in the basin (next slide)
▪ Continued improvement in well
performance due to higher sand
concentration and improved
targeting
▪ 400,000 net acres in SW PA
prospective
The Industry Continues
to Delineate the Utica
around Range’s Acreage
Note: Townships where Range holds ~2,000+ or more acres are shown outlined above
21Utica Wells – Wellhead Pressure vs. Cumulative Production
Range’s DMC Properties well one of the best in the Utica
22Innovative NGL Marketing Agreements Enhance Pricing
▪ First-mover on Appalachian NGL exports to Europe via ethane sales
to INEOS using Mariner East capacity
▪ Range’s propane has been sold internationally since 2016 through
Marcus Hook, with option to sell into premium NE winter markets
▪ Mariner West ethane sent to Nova Chemical (Canada)
▪ ATEX moves Appalachia ethane to the Gulf Coast (Mont Belvieu)
Marcus
Hook
Range NGL Transport
20,000
15,000
Bbls/d
Mont 10,000
Belvieu
5,000
0
Mariner East Mariner East Atex Ethane Mariner West
Propane Ethane Ethane (a)
(a) FOB Houston Plant
23High Quality Reserve Base
▪ Proved reserves of 18.2 Tcfe as of year end 2019
▪ Future development costs for proved undeveloped reserves are estimated to be $0.35 per
Mcfe at YE2019
20
2019 SEC PV10
18 of $7.6 billion
16
Total Proved Reserves (Tcfe)
14
12
10
8
6
4
2
0
2010 2011 2012 2013 2014 2015 2016 2017 2018 2019
Positive Performance Revisions for Last Decade Indicate Quality of Reserves
24Natural Gas & NGL Macro Outlook
Natural Gas - 35% of the U.S. Generation Mix in 2018
U.S. Power Generation by Source(a)
Growing Market Share in Power Gen.
40
▪ Gas power demand grew by 11 Bcf/d from
2009-2018, while coal declined 11 Bcf/d(a) and 35
renewables grew 5.3 Bcf/d(a)
30
35%
Bcf per Day Equivalent
33% 34%
32%
25
30% 28%
28%
Market Share Growth Should 20
23%
24% 25%
21%
Continue 15
▪ 25 Bcf/d of coal generation remains to be
10
displaced, or ~27% of U.S. Power Generation 7% 8% 10% 10%
7%
Mix 5
3% 4% 6%
5%
▪ 53 GW of coal plant capacity retired from 0
4% 5%
2013-2018, and another 36 GW of plant 2008 2009 2010 2011 2012 2013 2014 2015 2016 2017 2018
retirements have already been announced for Coal Gas Nuclear Hydro Solar+Wind Other
2019-2024 Source: EIA
▪ More retirement announcements expected Announced Coal & Nuclear Reactor Retirements
to occur in coming months/years
16,000 5.0
▪ Planned nuclear retirements also remove
Displacement (Bcf/d equivalent)
large base-load of power generation 14,000
Retirements (MW) 4.0
12,000
▪ New gas-fired reciprocating engines being 10,000 3.0
added to balance grid instability issues
8,000
created by renewables 2.0
6,000
4,000
1.0
2,000
0 0.0
2019 2020 2021 2022 2023 2024 2025
Coal Nuclear Cumulative Displacement
Source: EIA
(a) Assumes 7x Heat Rate for gas equivalence
26Shale Efficiency Gains Are Slowing
6-Month Daily Oil Production per 1,000 Lateral Ft.
Oil Basins
▪ Limited Tier-1 runway left in Williston, Mid-
Con, DJ Basin and Eagle Ford as cores are
believed to have been heavily drilled
▪ Up-spacing across several plays reduces
core inventory life
▪ Efficiency gains from lateral length and
proppant intensity now seeing diminishing
returns versus three years ago
▪ Parent-child issues becoming more prevalent
as child wells produce materially less than
parent wells
Source: Cowen and Company, Enverus
Haynesville
▪ Well productivity in the Haynesville appears Haynesville Production per 1,000 Lateral Ft.
to have plateaued
▪ Runway for current productivity may be
limited given current pace of development in
the play and that the core is known to be
small
▪ Private operators may be forced to reduce
growth as traditional exit strategies have
become challenged
Source: RS Energy
27Dry Gas Basin Break-Evens Suggest Higher Prices
Supply Growth Needed from Dry Gas Basins
▪ EIA forecasts 6.7 Bcf/d of 2019-2024 supply growth from outside of Northeast (mostly associated gas)
▪ Demand growth forecast of +21 Bcf/d from 2019-2024 will require growth from dry gas basins to
balance market
Higher-Than-Strip Prices Will Be Needed to Support Dry Gas Basin Growth
▪ Northeast PA will face constraints given current lack of infrastructure
▪ Dry gas basins likely require >$3/Mmbtu natural gas to support sustainable growth
Industry Break-Evens Above Current NYMEX Futures Curve
$5.00
$4.50 $4.30
$4.00 $3.75
$3.32 $3.33 $3.37 $3.40
$3.50
$3.07
NYMEX Gas $/mcf
$3.00
$2.43
$2.50
$2.00
$1.50
$1.00
$0.50
$0.00
Marcellus - NE PA Marcellus - SW Marcellus - WV Marcellus - SW Marcellus - Upper Utica - Dry Gas Utica - Wet Gas Marcellus -
PA Dry Dry PA - Wet Marcellus Ohio Central PA
Source: J.P. Morgan. Break-evens assume 25% pre-tax full-cycle rate of return to account for corporate G&A, interest expense and acreage costs.
28L48 Dry Gas Production Growth Slowing
U.S. L48 Pipeline Flows (Bcf/d)
94
92
90
88
86
84
82
80
78
76
74
72
70
68
1-Jan 1-Feb 1-Mar 1-Apr 1-May 1-Jun 1-Jul 1-Aug 1-Sep 1-Oct 1-Nov 1-Dec
2017 2018 2019
Source: Platts
29LNG Growth Expected to Continue
U.S. LNG Export Terminal Capacity (Bcf/d) Second Wave
22 FIDs & Potential
Port Arthur
20
FERC Approved and/or
>70% long-term offtake Magnolia LNG
18
signed. Potential Next Freeport T4
16 Wave Projects. Cameron T4-T5
14 Under Construction
Golden Pass T1-T3
or In-Service Sabine Pass T6
12 Calcasieu Pass
Corpus Christi T3
10
Freeport T1-T3
8
Cameron T1-T3
6
Corpus Christi T1-T2
Elba Island
4 Cove Point
2 Sabine Pass T1-T5
0
12/16 12/17 12/18 12/19 12/20 12/21 12/22 12/23 12/24
Source: Operator Estimates
300.0
0.5
1.0
1.5
2.0
2.5
3.0
3.5
4.0
4.5
5.0
5.5
6.0
6.5
1/5/2014
Source: Bloomberg
4/5/2014
7/5/2014
10/5/2014
1/5/2015
4/5/2015
7/5/2015
10/5/2015
1/5/2016
4/5/2016
7/5/2016
10/5/2016
1/5/2017
4/5/2017
7/5/2017
10/5/2017
1/5/2018
U.S Natural Gas Exports to Mexico (Bcf/d)
4/5/2018
7/5/2018
10/5/2018
U.S. Natural Gas Exports to Mexico Making New Highs
1/5/2019
4/5/2019
7/5/2019
10/5/2019
31NGL Macro Outlook
2017-2040 Change in Global Oil Product Demand by Scenario
NGL Demand
▪ IEA forecasts LPG (propane and butane)
and ethane to be the fastest growing global
oil products over medium and long term
▪ Demand growth driven primarily by
petrochemical feedstock demand and
residential demand in developing countries
▪ U.S. waterborne export capacity increases
in 2019 equivalent to ~15% of U.S. LPG
supply, which should tighten balances
going forward
U.S. Export Bottleneck Relieved Source: IEA World Energy Outlook 2018 (NPS = New Policy Scenario, SDS = Sustainable Development Scenario)
▪ 2019 saw the addition of ~400 MBPD of
new export capacity U.S. LPG Export Capacity (MMBL/D) Set to Increase
2.50
▪ 2020 is scheduled to add another 650
MBPD of new LPG export capacity
2.00
▪ This doesn’t include new ethane and
ethylene export capacity additions in 2019 1.50
and 2020.
1.00
0.50
0.00
2017 2018 2019 2020 2021
Enterprise - Houston Targa - Galena Park Sunoco - Mariner South
Phillips 66 - Freeport Enlink - Riverside Buckeye - Corpus Christi
DCP - Chesapeake Sunoco - Marcus Hook Petrogas - Ferndale
Source: Operator Estimates
32Global LPG Demand Forecast Absorbs Growing U.S. Exports
Global LPG S&D Waterfall (MBL/D)
11,200
11,000
10,800
10,600
10,400
~1.2
10,200
MMBPD
10,000
9,800
9,600
9,400
9,200
2018 Demand ResCom + Industry PDH Ethylene 2023 Demand Non-U.S. Supply Call on U.S. Supply
+Autogas + Other
▪ U.S. LPG Export Capacity to expand by 1,050 MBL/D (78%) by end 2020.
▪ Global LPG demand grew ~4.5% 2013-18, and is forecast to grow ~3% 2018-23, driven by ~700 MBL/D of PDH
and Ethylene plants under-construction or post-FID.
▪ ResComm (~51% of demand in 2018) is driven by continued adoption rates in China, India, Indonesia and
others for those without access to electricity.
▪ Indian LPG import terminal expansions under-construction/planned of 350 MBL/D in 2020-2025
▪ Relative economics support use of LPG over naphtha for international steam crackers. In an oversupply case,
converting just 10% of the global naphtha ethylene cracking fleet would absorb a further 600 MBL/D of LPG.
▪ Call on U.S. Supply is 1,200 MBL/D 2018-23, versus consultant supply growth forecasts of ~750 MLB/D.
Source: EIA, Energy Aspects, Genscape, IEA
33Financial Detail
Well-Structured, Resilient Balance Sheet
▪ $4+ billion max conforming borrowing base
Capital Structure(a)
($3B elected borrowing base, $2.4B committed)
(millions) 3Q19
▪ Simple capital structure
Bank Debt $ 328
▪ Near-term cash flow protected with hedges Senior Notes 2,784
▪ Ample cushion on financial covenants(a) Senior Sub Notes 49
▪ Interest coverage ratio(b) of ~5.0x versus covenant Debt 3,161
of at least 2.5x
▪ Current ratio(c) of ~4.8x versus covenant of at least
1.0x Debt to Capitalization 43%
▪ Asset coverage test(d) of ~2.6x versus covenant of Debt/TTM EBITDAX 3.2x
at least 1.5x
Debt/Proved Developed Reserves Debt Maturity Schedule(a)
$0.90
Net Debt/Proved Developed Reserves ($/mcf)
$0.80 $3,000 $3 Billion Borrowing Base
$0.70 Significant Liquidity
$2,500 $2.4 Billion Bank Commitment Potential of ~$2.4 billion
$0.60
$2,000
($ in Millions)
$0.50
$0.40 $1,500
$0.30 $890
$1,000 $749 $750
$0.20 $444
$328
$500
$0.10
$0.00 $-
2013 2014 2015 2016 2017 2018 2019 2020 2021 2022 2023 2023 2024 2025
RRC Peer Average Range Notes Senior Secured Revolving Credit Facility
Note: Peer average includes AR, CHK, CNX, COG, EQT, GPOR and SWN.
Interest Rate 5.75% 5.3%(e) 5.0% 4.875%
(a) As of 9/30/19 (b) Excludes non-cash interest expense (c) Calculated as (Current assets excluding derivatives + unused revolver capacity) / (current liabilities excluding derivatives) (d) Defined as PV-9 of
reserves divided by total debt (e) Weighted-average interest rate of 2022 notes
35Natural Gas & NGL Hedging Status
Volumes Hedged Average Hedge Prices
Time Period
(Mmbtu/day) ($/Mmbtu)
4Q19 Swaps 1,421,739 $2.82
1Q20 Swaps 1,007,253 $2.68
Natural Gas1 2Q20 Swaps 1,010,000 $2.62
(Henry Hub) 3Q20 Swaps 1,010,000 $2.62
4Q20 Swaps 976,848 $2.63
FY21 Swaps 50,000 $2.62
Volumes Hedged Average Hedge Prices
Time Period
(bbls/day) ($/gal)
Propane (C3) 4Q19 Swaps 5,723 $0.54
Normal Butane (NC4) 4Q19 Swaps 4,804 $0.66
Normal Butane (NC4) 1Q20 Swaps 659 $0.73
Isobutane (iC4) 4Q19 Swaps 337 $0.78
Natural Gasoline (C5) 4Q19 Swaps 6,005 $1.29
Natural Gasoline (C5) 1Q20 Swaps 4,297 $1.21
*As of 12/31/19
1) Range also sold natural gas call swaptions of 140,000 Mmbtu/d for March-December 2020, and 100,000 Mmbtu/d for calendar 2021 at average strike prices of $2.53
and $2.69 per Mmbtu, respectively.
36Oil Hedging Status
Volumes Hedged Average Hedge Prices
Time Period
(bbl/day) ($/bbl)
4Q19 Collars 1,000 $63 x 73
4Q19 Swaps 9,168 $56.11
1Q20 Swaps 9,000 $58.62
Oil (WTI)1 2Q20 Swaps 9,000 $58.18
3Q20 Swaps 8,500 $58.15
4Q20 Swaps 5,500 $58.00
FY21 Swaps 1,000 $55.00
*As of 12/31/19
1) Range also sold WTI calls of 500 Bbls/d for 2Q-3Q 2020 at a strike price of $59 per Bbl and WTI call swaptions of 3,000 Bbls/d for calendar 2021 at an average strike
price of $56.50 per Bbl.
37Contact Information
Range Resources Corporation
100 Throckmorton St., Suite 1200
Fort Worth, Texas 76102
Laith Sando, Vice President – Investor Relations
(817) 869-4267
lsando@rangeresources.com
Michael Freeman, Director – Investor Relations & Hedging
(817) 869-4264
mfreeman@rangeresources.com
John Durham, Senior Financial Analyst
(817) 869-1538
jdurham@rangeresources.com
www.rangeresources.com
38You can also read