International Petroleum Corp - Internationally Focused Upstream Company February 2020
←
→
Page content transcription
If your browser does not render page correctly, please read the page content below
International Petroleum Corp.
                Internationally Focused Upstream Company

                February 2020

NC00114 02.20
International Petroleum Corp.
                           Strongly Positioned to Create Shareholder Value(1)
                                                                            2020-2024

                                                                               ~50 Mboepd       (1)

                                                                                                                                                               Grow  th
                                                                                                                                                         ganic          rces(1)
                                                                                                                                                       Or        oeresou
                                                                                                                                                                    of
                                                                                                                                                            ion b
                                                                                                                                                       Bi ll
                                                                                   >210%                                                        ~1.4
                                                            75                   44% p.a.(4)

                                                                     >1,300 MUSD FCF(1,2,3)
                                                                                                                                                       Stakeholder Returns
                                                                                                                                      Debt reduction, share buybacks & dividends
                                                                                 >150%
                                                           65                    30% p.a.(4)
                                                                      >900 MUSD FCF(1,2,3)
                                                                                 >80%                                                    3 tr
                                                                                                                                             ans
                                                           55                    17% p.a.(4)                                                    actio M & A
                                                                                                                                                     ns in
                                                                                                                                                           less              than 3 ye
                                                         Brent(3)    >500 MUSD FCF(1,2,3)                                                                                             ars
                                                         USD/bbl
NCF00162 p18 01.20

                     (1)
                         See Reader Advisory. Estimates are based on IPC’s current business plans. Includes Granite Oil Corp. acquisition from 01/01/2020    (2)
                                                                                                                                                                 Non-IFRS measure, see Reader Advisory and MD&A.
                     (3)
                         Average Brent oil price assumption, escalating +2% p.a., Brent to Western Canadian Select (WCS) differentials as per IPC’s independent reserves evaluator. Average gas price assumption of 2.5 CAD/mcf.
                     (4)
                         FCF yield based on IPC market capitalisation at close February 5, 2020; 36.4 SEK/share, 9.58 SEK/USD, 597 MUSD

                                                                                                                                                                                                                                   2
Reserves Replacement (MMboe)

                     International Petroleum Corp.                                                                           >30 MMboe Replaced
                                                                                                                                     103%
                                                                                                                                                          89%
                                                                                                                                                          14.8
                     Reserves Growth                                                                                                 12.9

                                                                                                                   76%
                                                                                                                   2.9

                                                                                                                   2017             2018                 2019(1)

                           Reserves growth continues
                                  89% reserves replacement excluding acquisitions (1)                                    Net Reserves (MMboe)

                                  173% reserves replacement including Granite acquisition(1,2)                                                Granite     300
                                                                                                                                     288

                           2P reserves of 300 MMboe (1,2)
                           Reserves life index (RLI) of 17 years (1,2)

                                                                                                                BlackPearl
                            Reserves Life Index

                      YE 2016                                 8
                                                                                                                 129

                      YE 2019(1)                                                          17
                                                                                                     Suffield

                                                                                                   29
NCF00161 p08 01.20

                            (1)
                                   As at December 31, 2019. See Reader Advisory and MCR
                            (2
                                  Includes Granite Oil Corp. acquisition                         YE 2016        YE 2017             YE 2018             YE 2019(1,2)

                                                                                                                                                                       3
International Petroleum Corp.
                     Contingent Resources(1)
                                                                                                                             Net Contingent Resources (MMboe)
                                                                                                                                                                  1,089

                                                                                                                                                                   102

                        Contingent resource base >1 billion boe(1,2)
                                                                                                                                               849

                                                                                                                                               105
                        Maturing resources in all countries
                              Canada   - Blackrod pilot
                                       - Granite field development
                                                                                                                                                                   987
                              Malaysia - Phase IV infill drilling
                              France - Build on horizontal drilling success
                                                                                                                                               744

                                                                                                                              63

                                                                                                              0
                                                                                                            YE 2016          YE 2017         YE 2018            YE 2019 (1,2)
NCF00161 p17 01.20

                                                                                                                  Other
                        (1)
                            As at December 31, 2019. See Reader Advisory and MCR. Best estimate, unrisked
                                                                                                                  Blackrod
                        (2
                           Includes Granite Oil Corp. acquisition

                                                                                                                                                                                4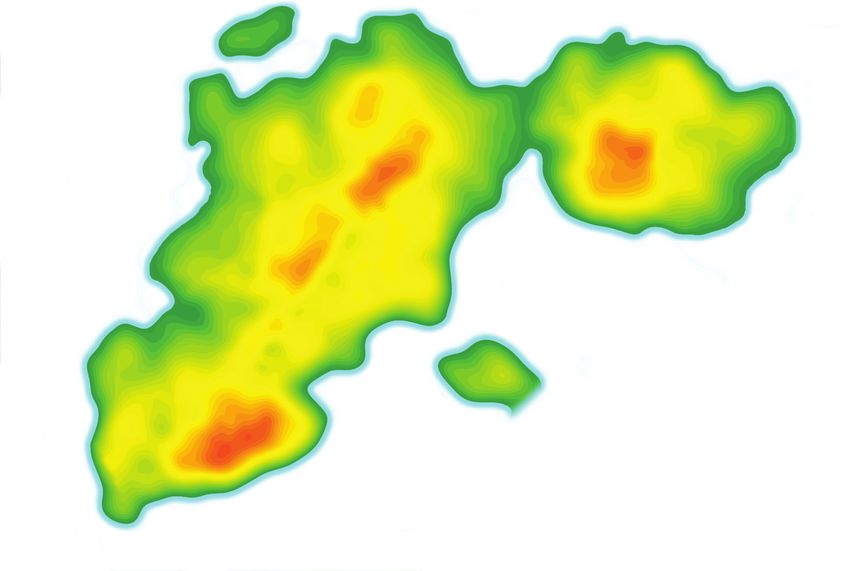
International Petroleum Corp.
                     Production Growth

                                                                                                                                     Production Growth Through Time

                                                                                                                                50
                                                                                                                                                                         50
                                                                                                                                                              46         46          ~ 50 Mboepd
                            Year on year production growth since inception
                                                                                                                                40

                                                                                                                                                   34
                            2020 production guidance of 46,000 to 50,000 boepd                                  (1)

                                  Assumes full year of production from Granite acquisition                                      30

                                                                                                                       Mboepd
                                                                                                                                20
                            Potential to sustain ~50,000 boepd through to 2024                                 (1)

                                                                                                                                10
                                                                                                                                         10

                                                                                                                                 0
                                                                                                                                        2017      2018       2019       2020     2021   2022      2023   2024
                                                                                                                                                                      Guidance
                                                                                                                                                             Canada Northern     Long Term Guidance
                                                                                                                                                             Canada Southern     Guidance Range
NCF00161 p09 01.20

                                                                                                                                                             International

                     1)
                          See Reader Advisory. Estimates are based on IPC’s current business plans. Includes Granite Oil Corp. acquisition from 01/01/2020

                                                                                                                                                                                                                5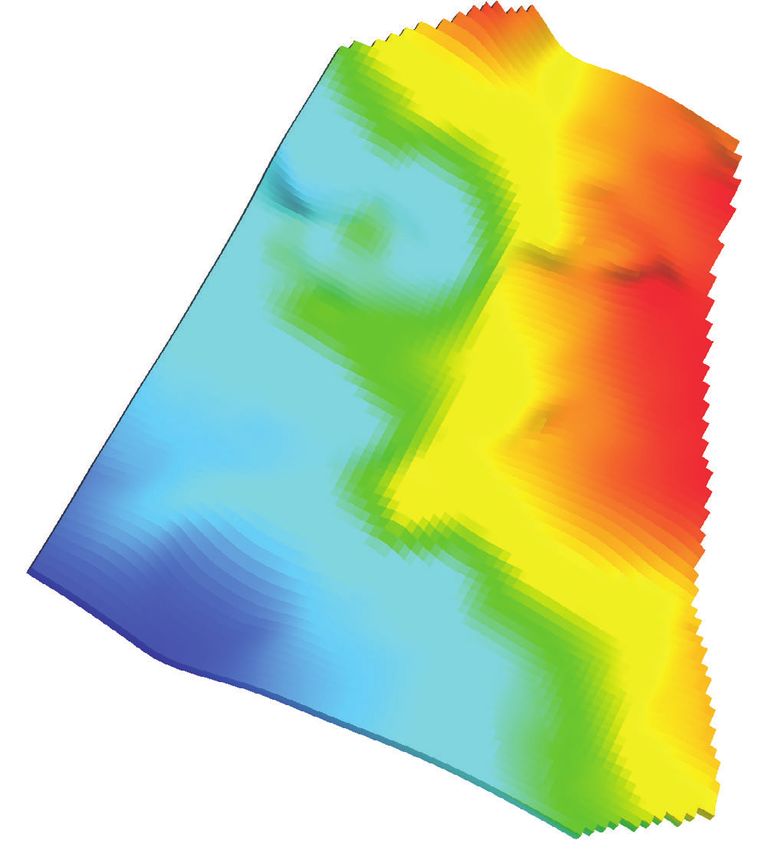
International Petroleum Corp.
                            Operating Cash Flow (MUSD) (1)
                                                                                                                                                                           WTI-WCS               WTI-WCS
                                                                                                                                                                          differential          differential
                                                                                                                                                                               -20                   -15

                                                                                                                               332                                                                  325
                                                                                                                                             308                                                70 USD/bbl
                                                                                                         279(2)                                                               293
                                                                                                         265                                                              70 USD/bbl

                                                                                                                            2019
                                                                                                                          Guidance                                                                  240
                                                                                          233
                                                                                                                                                                                                60 USD/bbl
                                                                                        2018                                                                                   208
                                                                                      Guidance                                                                             60 USD/bbl

                                                                                          161                                  163                                                                  157
                                                                  138                                                                                                                           50 USD/bbl
                                                                                                                                                                               125
                                                                                                                                                                           50 USD/bbl

                                                                   2017                              2018                                    2019                                        2020 (3)
NCF00161 p11 01.20

                                                                  Actual                            Actual                                  Actual
                     (1)
                           Non-IFRS measure, see Reader Advisory and MD&A
                     (2)
                           Including OCF related to Netherlands assets disposed in December 2018
                                                                                                   (3)
                                                                                                         At mid-point of 2020 production guidance. Includes Granite Oil Corp. acquisition from 01/01/2020

                                                                                                                                                                                                               6
International Petroleum Corp.
                            2020 - Investment Strategy

                               Forecast capital expenditure down 18% to 149 MUSD
                                  Includes 3 MUSD of 2019 carry over and 10 MUSD Granite adds

                                                                                                                       CAPEX 149 MUSD
                               Investment Strategy
                                  Develop on success in France
                                                                                                               Malaysia 14%
                                  Continued focus on Suffield gas optimisation and oil drilling
                                  Growth capital spend on Onion Lake Thermal                                                            Canada 62%
                                  Minimal investment in Malaysia

                               2020 Expenditure program fully funded at 60 USD/bbl Brent          France 24%

                               and WCS differential of 20 USD(1)

                               Operated assets with high degree of discretion
                               provides significant capital program flexibility
NCF00161 p05 01.20

                     (1)
                           See Reader Advisory and MD&A

                                                                                                                                                     7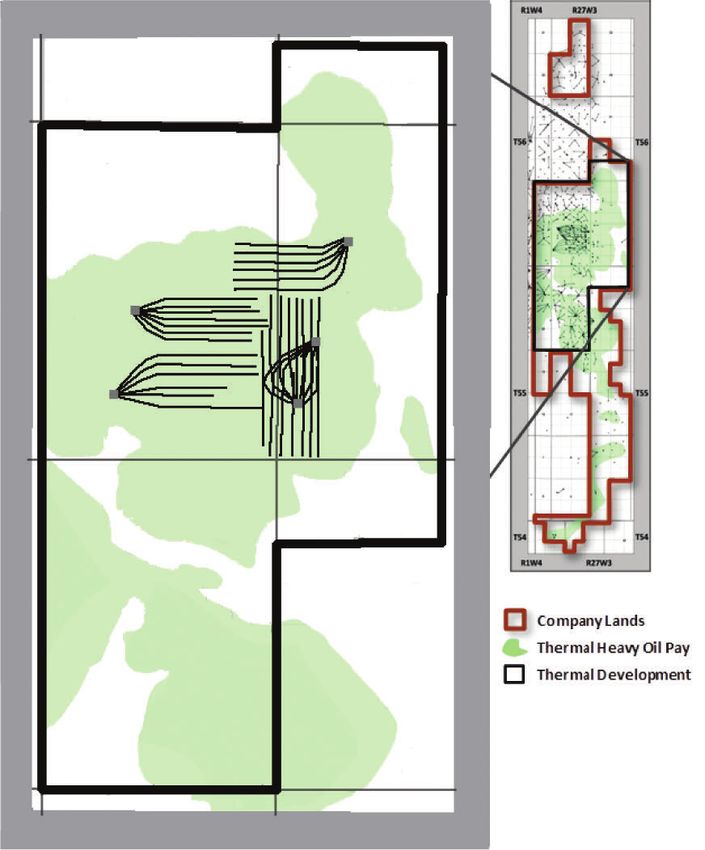
International Petroleum Corp.
                     Forecast 2P Reserves Capital Expenditure (1)

                                                                                181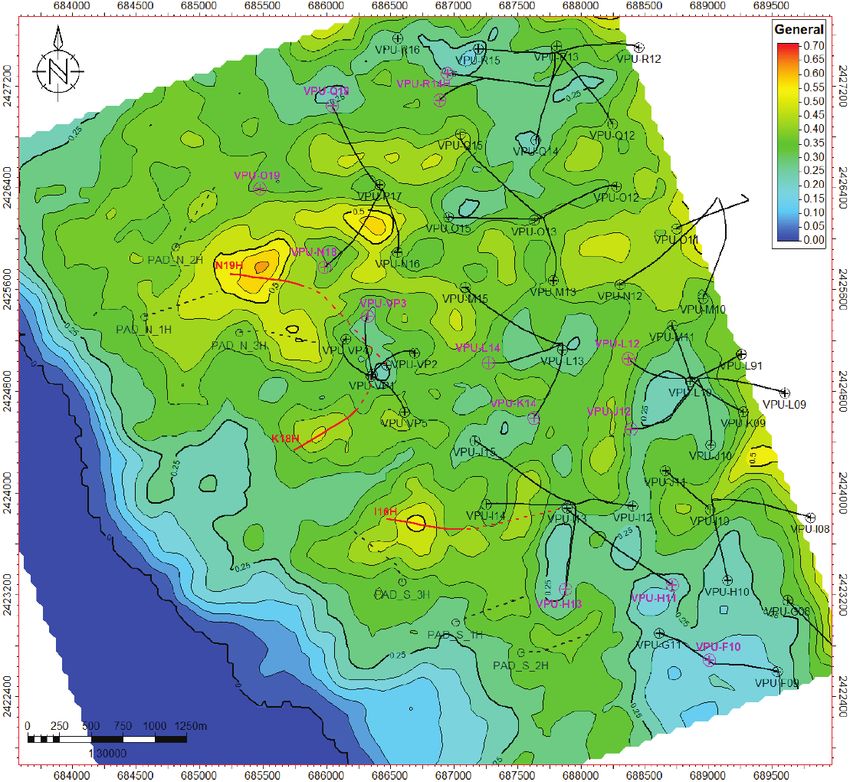
International Petroleum Corp.
                     Sustainability & ESG

                      ESG strategy – Carbon Footprint Reductions
                       Lowering IPC’s carbon footprint over the next 5 years to global average                                                                                                 Emission Intensity, Upstream O&G, kg CO2e/boe1

                                                                                                                                                                                                                Canadian
                                                                                                                                                                                                              Industry Average
                      Operation emissions reductions
                       Over 150,000 tonnes per year of CO2 already removed through technology choices                                                                                                              59
                       Actively screening further opportunities to reduce operational footprint

                      Providing clean energy
                                                                                                                                                                                                                                 IPC
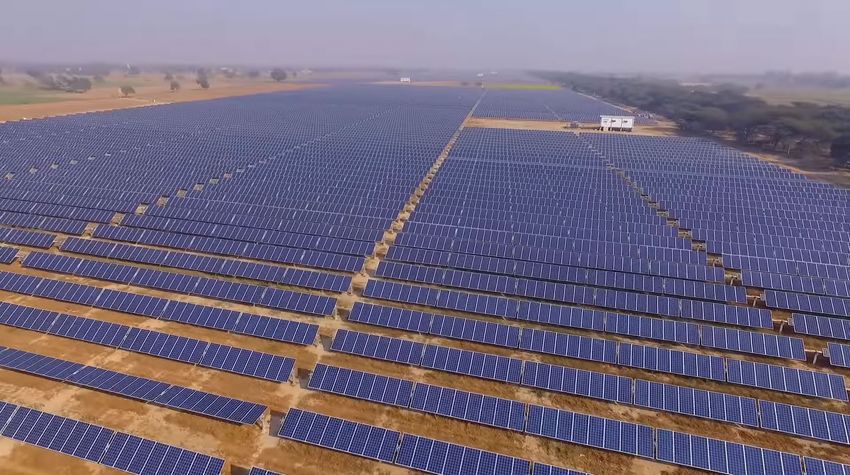
                       Partnership with First Climate to provide 100 MW solar energy to over 200,000 people
                       50,000 tonnes of CO2 offset by displacing coal fired power generation with renewables                                                                                                                     31        IPC
                                                                                                                                                                                                    Global                             post footprint
                                                                                                                                                                                                    Average                             reduction 2

                                                                      2020 Carbon Offset                                           50,000 tonnes CO2
                                                                                                                                                                                                     20                                   20
NCF00161 p07 01.20

                       (1)
                             Sources National Inventory Report Canada and International Association of Oil & Gas Producers   (2)
                                                                                                                                   Assumes after five years and offsetting ~1/3 of emissions

                                                                                                                                                                                                                                                        9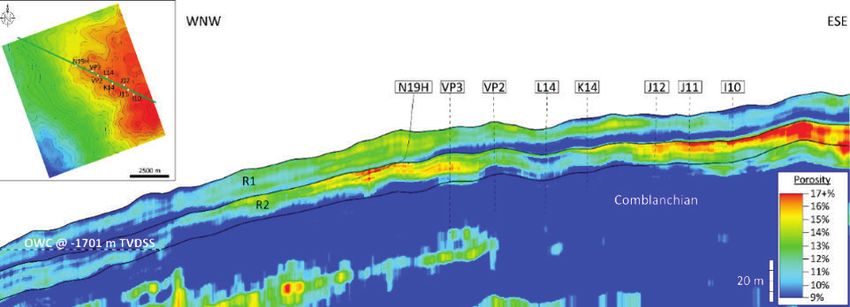
International Petroleum Corp.
                           Free Cash Flow Generation (1,2)
                                                                           2017                                   2018                                   2019                                                      2020-2024

                                   Production (1)
                                    Mboepd
                                                                                                                                                            46                                                           ~50
                                                                              10                                    34

                                                                                                                                                                                                                                    >210%
                                                                                                                                                                                             75                                     44% p.a.(5)
                                      Brent
                                                 (1)
                                                                                                                                                                                                                            >1,300 MUSD FCF (1,2,3)
                                                                             55                                    72                                       64
                                     USD/bbl

                                                                                                                                                                                                                                    >150%
                                                                                                                                                                                             65                                     30% p.a.(5)
                                                                                                                                                                                                                              >900 MUSD FCF                  (1,2,3)

                             Free Cash Flow(1,2,3)                           99       26% (4)                     203          38% (4)                     89       12% (4)                                                           >80%
                                   MUSD                                                                                                                                                      55                                      17% p.a.(5)
                                                                                                                                                                                          Brent (3)                            >500 MUSD FCF (1,2,3)
                                                                                                                                                                                          USD/bbl
NCF00162 p17 01.20

                     (1)
                         See Reader Advisory. Estimates are based on IPC’s current business plans. Includes Granite Oil corp. acquisition from 01/01/2020 (4) Free cash flow/ year end market capitalisation
                     (2)
                         Non-IFRS measure, see Reader Advisory and MD&A. Includes Granite Oil corp. acquisition from 01/01/2020            (5)
                                                                                                                                               FCF yield based on market capitalisation at close February 5, 2020 ; 36.4 SEK/share, 9.58 SEK/USD, 597 MUSD
                     (3)
                         Average Brent oil price assumption, escalating +2% p.a., Brent to Western Canadian Select (WCS) differentials as per IPC’s independent reserves evaluator. Average gas price assumption of 2.5 CAD/mcf.

                                                                                                                                                                                                                                                                       10
International Petroleum Corp.
Net Asset Value (MUSD) (1)
NPV
2,576
2,410
291 With YE 2018 Pricing
2,314 2,120
......
d 71% discount to NAV
dde
e a
valu
1,151
USD
1.5 B
> .....
597
543
......
2017 2018 2019 2020 2020 (1) Net Debt (2) NAV (1) IPCO
(YE 2018 (YE 2019 Market Cap (3)
pricing) pricing)
NCF00161 p14 01.20
(1)
As at December 31, 2019, see Reader Advisory, MCR and press release of February 11, 2020 (3) Based closing IPC share price on February 5, 2020, converted to USD (SEK 36.4 ; SEK/USD 9.58)
(2)
Non-IFRS measure, see Reader Advisory and MD&A. Includes 59 MUSD Granite Oil Corp. acquisition cost
11International Petroleum Corp.
Net Asset Value Per Share vs Share Price (1)
01/01/20
14 14
USD 13.3
NAV per share IPCO USD share price
13 01/01/19 13
USD 12.4
12 12
11 11
10 01/01/18 10
USD 9.1
AG R
9
C 9 >71%
USD per share
8 ~ 4 0 % 8
discount
to NAV
7 7
USD per share
6 6
01/01/17
5USD 4.8 5
~26%
discount 4
to NAV
3 3
2 2
1 1
0 0
Apr May Jun Jul Aug Sep Oct Nov Dec Jan Feb Mar Apr May Jun Jul Aug Sep Oct Nov Dec Jan Feb Mar Apr May Jun Jul Aug Sep Oct Nov Dec Jan Feb
2017 2018 2019
NCF00161 p15 01.20
(1)
As at December 31, 2019, see Reader Advisory, MCR and press release of February 11, 2020
12International Petroleum Corp.
Adding Shareholder Value - Looking Back
-25.5
-7.6
156.2
+75.8
Million IPC shares outstanding
38% ~5x production
Dilution
113.5
>10x 2P Reserves(1)
>9 Years added to Reserves Life(1)
>1 Billion boe (CR)(1)
>2x OCF(2)
Shares Outstanding BlackPearl Share Share Shares
at Spin off Acquisition Buy-Back Buy-Back Outstanding(3) Added >1,500 MUSD NAV(1)
April 2017 December 2018 June 2017 2019/2020
NCF00161 p22 01.20
1) As at December 31, 2019, see Reader Advisory, MCR and press release of February 11, 2020 3) Includes current shares outstanding and repurchased shares held for cancellation.
2) Non-IFRS measure, see Reader Advisory and MD&A.
13International Petroleum Corp.
Adding Shareholder Value - Looking Forward
2020-2024
~50 Mboepd (1)
Grow th
ganic rces(1)
Or oeresou
of
ion b
Bi ll
>210% ~1.4
75 44% p.a.(4)
>1,300 MUSD FCF(1,2,3)
Stakeholder Returns
Debt reduction, share buybacks & dividends
>150%
65 30% p.a.(4)
>900 MUSD FCF(1,2,3)
>80% 3 tr
ans
55 17% p.a.(4) actio M & A
ns in
less than 3 ye
Brent(3) >500 MUSD FCF(1,2,3) ars
USD/bbl
NCF00162 p18 01.20
(1)
See Reader Advisory. Estimates are based on IPC’s current business plans. Includes Granite Oil Corp. acquisition from 01/01/2020 (2)
Non-IFRS measure, see Reader Advisory and MD&A.
(3)
Average Brent oil price assumption, escalating +2% p.a., Brent to Western Canadian Select (WCS) differentials as per IPC’s independent reserves evaluator. Average gas price assumption of 2.5 CAD/mcf.
(4)
FCF yield based on IPC market capitalisation at close February 5, 2020; 36.4 SEK/share, 9.58 SEK/USD, 597 MUSD
14Appendix
2020 Activity
15International Petroleum Corp.
2020 Guidance
2020 Overview
Production Production
5 year business plan targeting ~50 Mboepd (1)
46 to 50 Mboepd
Based on delivering our 2P reserve position (2)
Excludes contingent resource maturation
Investments
Capital
Building on success in France
149 MUSD
Production growth through investments in Canada
Mature Malaysia Phase IV infills
Reserves(2) Resources(2)
173% reserves replacement in 2019 ~1.4 billion boe
Multiple organic growth opportunities for future development 300 1,089
2P 2C
Actively screening acquisition candidates
NCF00162 p13 01.20
(1)
See Reader Advisory. Estimates are based on IPC’s current business plans. Includes Granite Oil Corp. acquisition from 01/01/2020
(2)
As at December 31, 2019. See Reader Advisory and MCR. Best estimate, unrisked
16International Petroleum Corp. 2020 Production
Production Guidance International, 18%
France
sia
Canada Gas, 35%
y
ala
M
Suffield ther
Gas d a O
Cana
2020 Production guidance: 46,000 to 50,000 boepd net(1) Granite
Assumes full year of Granite production
Onion Lake
Projects ramping up through 2020 Thermal
- Suffield, Onion Lake Thermal, Granite and France Suffield
Oil
Canada Oil, 47%
Production (Mboepd) High guidance
50 50
46 Low guidance
46
40
34
34
30 30
20
~5x
Guidance
range 10
11
10 9
Gas
Oil WCS
NCF00162 p09 01.20
Oil Brent 0
Q1 Q2 Q3 Q4
2017 2018 2019
2020
(1)
See Reader Advisory. Includes Granite Oil Corp. acquisition from 01/01/2020
17International Petroleum Corp.
Operating Costs (1)
2020 full year operating cost forecast – 13.7 USD/boe
OPEX reduced by ~15% since spin-off
2020 Guidance
Operating Costs 2020 Guidance
(USD/boe)
International, 29% Canada, 71%
France
Canada Southern Assets
Malaysia
Canada Northern Assets
NCF00162 p10 01.20
(1)
Non-IFRS measure, see Reader Advisory and MD&A. Includes Granite Oil Corp. acquisition from 01/01/2020 OPEX shown is net of self to self lease payments and exclusive of diluent costs in Canada
18International Petroleum Corp.
2020 Capital Allocation
Capital Expenditure
France, 24% Canada, 62%
2020 Guidance: 149 MUSD(1)
Ability to increase or decrease spend depending on commodity pricing Malaysia, 14%
Projects ramping up during 2H 2020
Northern Assets
- Onion Lake Thermal Pad D’
Southern Assets Paris Basin
- Suffield Oil drilling - Vert-La-Gravelle
- Suffield Gas optimisation - Villeperdue West
- Granite Oil drilling - Maintenance capital
Bertam
- Infill well carryover
- A15 remediation
NCF00162 p11 01.20
(1)
See Reader Advisory and MD&A.
Includes Granite Oil Corp. acquisition
19Appendix
Canada
20International Petroleum Corp.
Canadian Supply and Egress W. CDA total oil supply to market
Keystone XL (830)
TMX (590)
ENB L3R (370)
Others (690)
AB & SK refineries, industry demand
Existing crude & pipelines (4,298)
by rail capacity ~500,000 bopd
7.0
6.5
Keystone XL (830)
6.0
Facility optimisations 270,000 bopd
and refining capacity in 2020 5.5 Production TMX (590)
Curtailment
pipeline egress, million bbl/d
R (370)
W. Canada oil supply vs.
5.0
ENB L3
4.5 Others (690)
Enbridge Line 3 370,000 bopd 4.0
Replacement in 2020/21
3.5
3.0
Trans Mountain 590,000 bopd 2.5
Expansion in 2022 2.0
AB & SK refineries & industry demand + existing pipeline (4,298)
1.5
1.0
Keystone XL 830,000 bopd
in 2022/23 0.5
0.0
NCF00161 p13 01.20
2016 2017 2018 2019 2020 2021 2022 2023 2024
Source: Stifel FirstEnergy, CAPP, Alberta Energy Regulator,Company disclosures
21Suffield Area Assets
IPC Canada
Suffield
Suffield Asset 2020 oil drilling
focus area
Deliver 2020 development programme 2020 gas recompletion
focus areas
20 well oil drilling programme
200 gas well recompletions CFB Suffield
Gas optimisation programme continues Alderson
0 KM 20
Develop 2021 organic growth programme Redcliff
IPC Licences
Operated / Shallow Gas
Hydrocarbon fields/discoveries
Medicine Hat Oil pools
Canada Suffield Gas Production Canada Suffield Oil Production
10,000
140,000
Average annual decline 9%
IPC Average annual decline 11%
Acquisition
120,000
IPC
8,000
Acquisition
Production (boepd)
Production (Mscf/d)
100,000
6,000
80,000
Winter freeze-offs
NCF00164 p16 01.20
60,000 4,000
Jan Mar May Jul Sep Nov Jan Mar May Jul Sep Nov Jan Mar May Jul Sep Nov Jan Mar May Jul Sep Nov Jan
Jan
Feb
Mar
Apr
May
Jun
Jul
Aug
Sep
Oct
Nov
Dec
Jan
Feb
Mar
Apr
May
Jun
Jul
Aug
Sep
Oct
Nov
Dec
Jan
Feb
Mar
Apr
May
Jun
Jul
Aug
Sep
Oct
Nov
Dec
Jan
Feb
Mar
Apr
May
Jun
Jul
Aug
Sep
Oct
Nov
Dec
Jan
Feb
2016 2017 2018 2019 2016 2017 2018 2019
22IPC Canada
Onion Lake Thermal Asset
Onion Lake Thermal
R1W4 R27W3
Facility upgrades completed in 2019
D’ Pad
F Pad online, field production ~ 12,000 bopd
D’ E L
T56
A C
T56
D’ Pad drilling ongoing, steam injection from Q3 2019 B
Increases production towards 14,000 bopd F
F Pad
Evaluation ongoing for further facility expansions and T55 T55
production acceleration
NCF00164 p08 01.20
R1W4 R27W3
23IPC Canada
Ferguson Asset (Granite) (1)
0 50 KM 200 Major Oil pipeline
Major Gas pipeline
0 20 Miles 100
IPC asset
High margin, light oil production
Blackrod
Historically assets have been capital constrained
Saskatchewan
Mooney
Fishing Lake
35 drilling locations identified in 2P reserves (1) Reita Lake
Further opportunities in contingent resources John Lake Onion Lake
6 development wells planned in 2020 Alberta
Ability to double production in 2-3 years
British Columbia
Graindale/Hudson
Calgary Office
Suffield/Alderson Assets
Redcliff Office
Ferguson (Granite)
USA
NCF00164 p06 01.20
(1)
As at December 31, 2019, see Reader Advisory and MCR.
24IPC Canada
Blackrod Growth Opportunity 12
18
26
10
28
8
16
WP3 26
22
WP2
~ 1 billion barrels of 2C contingent resource(1) 20 24
22
243 MMbbl acquired in 2019 8
12
20
26
26
Blackrod
16 T78
22
WP1 24 22
4
20
18
Well pair 2 pilot produced in excess of 900 Mbbl
26
18
26 16
Acquired Lands
4
sca River
ba
proving commercial productivity
a
14
Ath
18
Lands
Aquired 8
10
6
6
T77
8
20 12
14
10
12
14
14 16
12
3rd well pair drilled with extended reach to 1,400m
18
12
14 10
26
28
Production ramp up 2H 2020 16
8
22
16
26
20 24
12 22
20 26
8
12 26
16
Pilot wells and studies aim to increase productivity,
22 24 22
20
26 18
18
26 16
16 18 Acquired Lands
14
reduce costs and reduce breakeven oil price
18
NLA
14 20 T76
12 14
12
NLA
14
18
16
12
12 NLA
NLA
16 16 18
NLA
NCF00164 p11 01.20
14
12
NLA
18
Blackrod
12 NLA
NLA 16
T75
NLA NLA
NLA
(1)
As at December 31, 2019, see Reader Advisory andR19
MCR. Best estimate, unrisked. R18 R19 R18 R17W4
25Appendix
Malaysia
26IPC Malaysia
Bertam Performance Update
Phase 3 programme on track with pre-drill prognosis
A20 is the largest contributor –> above expectation
Infills account for ~70% of 2020 average production
Bertam Infill Wells Ultimate Recovery
Pre drill YE 2019 remaining reserves
Bertam Field Gross Production Produced
14,000
Phase 1 infill Phase 3 infill
12,000
Base Phase 2 infill
Actual Forecast
10,000
A15 potential
8,000
MMboe
bopd
6,000
4,000
2,000
NCF00165 p02 01.20
0
Apr
Aug
Nov
Apr
Aug
Nov
Apr
Aug
Nov
Apr
Aug
Jun
Jul
Dec
Nov
Apr
Aug
Jun
Jul
Dec
Nov
Jun
Jul
Dec
Jun
Jul
Dec
Jun
Jul
Dec
Mar
May
Jan
Mar
May
Jan
Mar
May
Jan
Mar
May
Jan
Mar
May
Jan
Oct
Oct
Oct
Sep
Feb
Oct
Sep
Feb
Oct
Sep
Feb
Sep
Feb
Sep
Feb
2015 2016 2017 2018 2019 2020 Phase 1 Phase 2 Phase 3
(A15) (A16, A17) (A18/A19/A20)
27IPC Malaysia Bertam – A15 Area
Malaysia – Bertam K10.1 Base
Bertam North East Region
A20
Bertam-2
Bertam-3
A19
10
-16
Bertam-5
Further upside potential in A15/A20 area
Infill drilling locations being matured for potential 2021 execution A15
-1610
-1620
-163
0
A20 -1
61
0
Online since mid-January 2020
Bertam - 5
Clean up and stabilisation phase ongoing
Potential upside as structure flattens towards the east
Bertam-4 Bertam - A20
A15 Bertam-1
-1
62
0
Reserves upgrades year on year since 2016
Remedial works ongoing, back online early Q2 2020
0
-162
K10.1
-1610
K10.2
K10.3
NCF00165 p03 01.20
0 Hz Scale 500 m
28Appendix
France
29Villeperdue West - Execution Q2 2020
IPC – France
Resource Maturation (1)
rage
Cove
Proven track record of resource growth
ic
ism
D Se
Horizontal wells unlock further potential
3
Phase I
development
Villeperdue 3.4 MMboe targets
Largest single contingent resource in France
Villeperdue
Phase I targets 1.6 MMboe of undeveloped reserves producing well
60 extent
Villeperdue
50
Reservoir Thickness
+130% Aquitaine, 2.2
40 2P+2C 14%
Vert-la-Gravelle - Horizontal well concept proven
Growth 22%
MMboe
30
18% 2C Contingent Resources Existing wells
Merisier, 2.7 Phase 1 producers
20 15.2 MMboe(1) Water injectors
46%
10
VGR7
VGR4
VGR8
2002 2019 VGR113H
VGR1
2C Contingent Resources Rhaetian Opportunities, 6.9 MMboe VGR5
VGR109H
Cumulative Production Horizontal wells proven at >1,000bbls/d potential VGR6
Future Rhaetian opportunity screening ongoing
2P Reserves
VGR10D
NCF00166 p02 01.20
(1)
As at December 31, 2019. See Reader Advisory and MCR. Best estimate, unrisked
30IPC France
Vert-la-Gravelle Project Update
Vert-la-Gravelle Top Reservoir Structure Map
Successful delivery of first Rhaetian horizontal producer
Initial rates of up to 1,500 bopd from VGR113, stable rates ~ 1,000 bopd
Pressure support required to maximise potential, field optimisation ongoing
VGR7
Further potential for development
VGR4
Secondary reservoir confirmed in multiple wells
VGR8
Optimisation, infill drilling, injection and subsurface studies ongoing
VGR113H
360m horizontal section completed
VGR1
VGR5
Other Rhaetian opportunities now being high graded for development
VGR6
VGR109H
430m horizontal section completed
VGR10D
Existing wells
Phase 1 producers
NCF00166 p03 01.20
Water injectors
31Villeperdue West
IPC France
Villeperdue West Development Overview
NW
N19H
Development targets reservoir extensions in undeveloped area
SE
Potentially large unswept area to the west
2017 3D seismic programme helps to define optimal well placement
K18H
Drilling programme optimised to maximise well productivity
3 horizontal wells utilising existing pads and facilities I16H
Planned Q2 2020 execution, first oil expected in Q3 2020
Porosity from 3D Seismic
NW N19H VP3 VP2 L14 K14 SE
NCF00166 p04 01.20
Oil water contact
32Appendix
Financial
33International Petroleum Corp.
Long-term Brent Price (1)
Price Decks Brent USD/bbl (1)
80
77
75
74
73
71 71 71
70
70
68 68
65
64
60
50
2018 2019 2020 2021 2022 2023 2024
NC00167 p15 01.19
Year End 2018 Reserves Price Deck (McDaniel)
Realised Price Year End 2019 Price Deck (Sproule)
(1)
See Reader Advisory and MCR
34International Petroleum Corp.
Long-term Canadian Pricing (1)
Western Canadian Select (WCS) USD/bbl Empress Gas Price CAD/MMbtu
75 4.5
70
4.0
65
60 3.5
CAD/MMbtu
USD/bbl
55
3.0
50 2.77
2.54
45 44 2.5
40 39
2.0
35
30 1.5
2018 2019 2020 2021 2022 2023 2024 2018 2019 2020 2021 2022 2023 2024
Realised Price Year End 2018 Realised Price Year End 2018
Year End 2019 Year End 2019
NC00167 p16 01.19
(1)
See Reader Advisory and MCR
35International Petroleum Corp.
Economic Assumptions (1)
Low Case Base Case High Case
Oil in USD/bbl
Brent 50 60 70
WTI 45 54 63
WCS (-20 USD/bbl) 25 34 43
Gas in CAD/mcf
Empress 2.25 2.25 2.25
Sensitivities
WTI-WCS differential (USD/bbl) +/- 5 USD/bbl
Empress gas price (CAD/mcf) +/- 0.25 CAD/mcf
NC00167 p13 01.19
(1)
Note that the WTI-WCS differential for Q1 2020 takes actuals into account
36International Petroleum Corp.
Margin Netback (1,2) (USD/boe)
2020 Forecast 2019
Low Base High Actual
USD/bbl Brent/WTI/WCS 50/45/25 60/54/34 70/63/43 64/57/44
Production guidance 46,000–50,000 boepd 46,000 boepd
Revenue 22.3 27.4 32.5 33.1
Cost of operations -11.3 -11.3 -11.3 -10.8
Tariff and transportation expenses -1.8 -1.8 -1.8 -1.5
Direct production taxes -0.6 -0.6 -0.6 -0.5
Operating costs (2) -13.7 -13.7 -13.7 -12.8
Cost of blending (3) -1.3 -1.4 -1.6 -1.6
Cash Margin Netback 7.3 12.3 17.2 18.7
NC00167 p02 01.19
(1)
See Reader Advisory
(2)
Non-IFRS measure, see Reader Advisory and MD&A
(3)
Including change in inventory position
37International Petroleum Corp.
Operating Cash Flow (1,2) and EBITDA Netback (1,2) (USD/boe)
2020
Forecast
Brent oil price (USD/bbl) 50 60 (Base) 70
Cash Margin Netback 7.3 12.3 17.2
Cash Taxes -0.3 -0.6 -0.8
Operating Cash Flow Netback 7.0 11.7 16.4
EBITDA Netback 6.7 11.6 16.5
NC00167 p05 01.19
(1)
Non-IFRS measure, see Reader Advisory and MD&A
(2)
See Reader Advisory and MD&A. At mid-point of 2020 production guidance
38International Petroleum Corp.
Oil Sensitivity to WTI/WCS Differential
2020 Forecast
Base Case
Brent oil price (USD/bbl) 60 60
WTI/WCS Differential (USD/bbl) 20 15 Difference
Total Revenue (USD/boe) 27.4 29.2 + 1.8
Operating Cash Flow (1) (USD/boe) 11.7 13.5 + 1.8
EBITDA (1) (USD/boe) 11.6 13.4 + 1.8
Same difference applies when differential changes by 5 USD/bbl at Brent prices of 50 or 70 USD/bbl
NC00167 p08 01.19
(1)
Non-IFRS measure, see Reader Advisory and MD&A
39International Petroleum Corp.
Gas Sensitivity to Realised Canadian Gas Price
2020 Forecast
Base Case
Brent oil price (USD/bbl) 60 60
WTI/WCS Differential (USD/bbl) 20 20
Gas price (CAD/mcf) 2.25 2.50 Difference
Total Revenue (USD/boe) 27.4 27.8 + 0.4
Operating Cash Flow (1) (USD/boe) 11.7 12.0 + 0.4
EBITDA (1) (USD/boe) 11.6 11.9 + 0.4
NC00167 p09 01.19
(1)
Non-IFRS measure, see Reader Advisory and MD&A
40International Petroleum Corp.
Liquidity and Funding (USD/boe)
2020 Forecast
Brent oil price (USD/bbl) 50 60 (Base) 70
Operating Cash Flow Netback(1) 7.0 11.7 16.4
General and Administration Costs -0.7 -0.7 -0.7
Cash Financial Items -1.0 -1.0 -0.9
Cash Flow Available for Investment 5.3 10.0 14.8
Development Capex 7.9 7.9 7.9
Exploration & Appraisal Capex(2) 1.2 1.2 1.2
9.1 9.1 9.1
Free Cash Flow(1) -3.8 0.9 5.7
NC00167 p10 01.19
(1)
Non-IFRS measure, see Reader Advisory and MD&A
(2)
Includes decommissioning
41Reader Advisory
Forward Looking Statements
This presentation contains statements and information which constitute “forward-looking statements” or “forward-looking information” (within the meaning of applicable securities legislation). Such statements and information (together, “forward-looking statements”) relate to future
events, including the Corporation’s future performance, business prospects or opportunities. Actual results may differ materially from those expressed or implied by forward-looking statements. The forward-looking statements contained in this presentation are expressly qualified by this
cautionary statement. Forward-looking statements speak only as of the date of this presentation, unless otherwise indicated. IPC does not intend, and does not assume any obligation, to update these forward-looking statements, except as required by applicable laws.
All statements other than statements of historical fact may be forward-looking statements. Any statements that express or involve discussions with respect to predictions, expectations, beliefs, plans, projections, forecasts, guidance, budgets, objectives, assumptions or future events or
performance (often, but not always, using words or phrases such as “seek”, “anticipate”, “plan”, “continue”, “estimate”, “expect”, “may”, “will”, “project”, “forecast”, “predict”, “potential”, “targeting”, “intend”, “could”, “might”, “should”, “believe”, “budget” and similar expressions)
are not statements of historical fact and may be “forward-looking statements”. Forward-looking statements include, but are not limited to, statements with respect to: IPC’s intention and ability to continue to implement our strategies to build long-term shareholder value; IPC’s intention to
review future potential growth opportunities; the ability of IPC’s portfolio of assets to provide a solid foundation for organic and inorganic growth; the continued facility uptime and reservoir performance in IPC’s areas of operation; the timing and success of the Villeperdue West develop-
ment project, including drilling and related production rates as well as future phases of the Vert La Gravelle redevelopment project, and other organic growth opportunities in France; future development potential of Rhaetian reservoirs in France and the ability to maintain current and
forecast production in France; the ability of IPC to achieve and maintain current and forecast production from the third phase of infill drilling in Malaysia and the ability to identify, mature and drill additional infill drilling locations; the success and timing of remedial works in respect of the
A-15 well in Malaysia; future development potential of the Suffield operations, including continued and future oil drilling and gas optimization programs, the ability to offset natural declines and the N2N EOR development project; the proposed further conventional oil drilling in Canada,
including the ability of such drilling to identify further drilling or development opportunities; development of the Blackrod project in Canada, including continued current operations at the project and steam injection in the third well pair; the results of the facility optimization program, the
work to debottleneck the facilities and injection capability and the F-Pad production, as well as water intake and steam generation issues, at Onion Lake Thermal; the plan to add another drilling pad in 2020 at Onion Lake Thermal and the production resulting from such pad; the timing and
certainty regarding completion of the proposed acquisition of Granite (the Granite Acquisition), including the ability of the IPC and Granite to obtain necessary approvals and otherwise satisfy the conditions to such completion and the absence of material events which may interfere with
such completion; the ability of IPC to achieve and maintain current and forecast production and take advantage of production growth and development upside opportunities related to Granite’s assets post-completion of the Granite Acquisition; the ability of IPC to integrate Granite’s as-
sets into its current operations; the ability of Granite’s existing infrastructure to enable EOR projects, as well as capacity to allow for potential further field development opportunities in respect of Granite’s assets; the existence of drill-ready opportunities in respect of Granite’s assets and
their ability to add further near-term production of high netback, light oil barrels; the ability to IPC to acquire further common shares under the share repurchase program, including the timing of any such purchases; the return of value to IPC’s shareholders as a result of the share repur-
chase program; 2020 production range, operating costs and capital expenditure estimates; estimates of future production, cash flows, operating costs and capital expenditures that are based on IPC’s current business plans and assumptions regarding the business environment, which
are subject to change; potential further acquisition opportunities; estimates of reserves; estimates of contingent resources; the ability to generate free cash flows and use that cash to repay debt and to continue to deleverage; and future drilling and other exploration and development
activities. Statements relating to “reserves” and “contingent resources” are also deemed to be forward-looking statements, as they involve the implied assessment, based on certain estimates and assumptions, that the reserves and resources described exist in the quantities predicted
or estimated and that the reserves and resources can be profitably produced in the future. Ultimate recovery of reserves or resources is based on forecasts of future results, estimates of amounts not yet determinable and assumptions of management.
The forward-looking statements are based on certain key expectations and assumptions made by IPC, including expectations and assumptions concerning: prevailing commodity prices and currency exchange rates; applicable royalty rates and tax laws; interest rates; future well produc-
tion rates and reserve and contingent resource volumes; operating costs; the timing of receipt of regulatory approvals; the performance of existing wells; the success obtained in drilling new wells; anticipated timing and results of capital expenditures; the sufficiency of budgeted capital
expenditures in carrying out planned activities; the timing, location and extent of future drilling operations; the successful completion of acquisitions and dispositions; the benefits of acquisitions; the state of the economy and the exploration and production business in the jurisdictions in
which IPC operates and globally; the availability and cost of financing, labour and services; and the ability to market crude oil, natural gas and natural gas liquids successfully.
Although IPC believes that the expectations and assumptions on which such forward-looking statements are based are reasonable, undue reliance should not be placed on the forward-looking statements because IPC can give no assurances that they will prove to be correct. Since
forward-looking statements address future events and conditions, by their very nature they involve inherent risks and uncertainties. Actual results could differ materially from those currently anticipated due to a number of factors and risks. These include, but are not limited to: the risks
associated with the oil and gas industry in general such as operational risks in development, exploration and production; delays or changes in plans with respect to exploration or development projects or capital expenditures; the uncertainty of estimates and projections relating to
reserves, resources, production, revenues, costs and expenses; health, safety and environmental risks; commodity price and exchange rate fluctuations; interest rate fluctuations; marketing and transportation; loss of markets; environmental risks; competition; incorrect assessment of
the value of acquisitions; failure to complete or realize the anticipated benefits of acquisitions or dispositions; the ability to access sufficient capital from internal and external sources; failure to obtain required regulatory and other approvals; and changes in legislation, including but not
limited to tax laws, royalties, environmental and abandonment regulations. Readers are cautioned that the foregoing list of factors is not exhaustive.
Additional information on these and other factors that could affect IPC, or its operations or financial results, are included in the Corporation’s material change report dated February 11, 2020 (MCR), the Corporation’s management’s discussion and analysis for the year ended December 31,
2019 (MD&A) (See “Cautionary Statement Regarding Forward-Looking Information” therein), the Corporation’s Annual Information Form (AIF) for the year ended December 31, 2018 (See “Cautionary Statement Regarding Forward-Looking Information”, “Reserves and Resources Advisory”
and “ Risk Factors” therein) and other reports on file with applicable securities regulatory authorities, including previous financial reports, management’s discussion and analysis and material change reports, which may be accessed through the SEDAR website (www.sedar.com) or IPC’s
website (www.international-petroleum.com).
Non-IFRS Measures
References are made in this presentation to “operating cash flow” (OCF), “free cash flow” (FCF), “Earnings Before Interest, Tax, Depreciation and Amortization” (EBITDA), “operating costs” and “net debt”/”net cash”, which are not generally accepted accounting measures under
International Financial Reporting Standards (IFRS) and do not have any standardized meaning prescribed by IFRS and, therefore, may not be comparable with definitions of OCF, FCF, EBITDA, operating costs and net debt/net cash that may be used by other public companies. Non-IFRS
measures should not be considered in isolation or as a substitute for measures prepared in accordance with IFRS.
Management believes that non-IFRS measures are useful supplemental measures that may assist shareholders and investors in assessing the cash generated by and the financial performance and position of the Corporation. Management also uses non-IFRS measures internally in order
to facilitate operating performance comparisons from period to period, prepare annual operating budgets and assess the Corporation’s ability to meet its future capital expenditure and working capital requirements. Management believes these non-IFRS measures are important supple-
mental measures of operating performance because they highlight trends in the core business that may not otherwise be apparent when relying solely on IFRS financial measures. Management believes such measures allow for assessment of the Corporation’s operating performance
and financial condition on a basis that is more consistent and comparable between reporting periods. The Corporation also believes that securities analysts, investors and other interested parties frequently use non-IFRS measures in the evaluation of issuers. Forward-looking statements
are provided for the purpose of presenting information about management’s current expectations and plans relating to the future and readers are cautioned that such statements may not be appropriate for other purposes.
The definition and reconciliation of each non-IFRS measure is presented in IPC’s MD&A (See “Non-IFRS Measures” therein).
Estimated free cash flow generation is based on IPC’s current business plans over the period of 2020 to 2024. Assumptions include average net production of a variance around 50 Mboepd, average Brent oil prices of USD 55 to 75 per boe escalating by 2% per year, average gas prices of
CAD 2.50 per thousand cubic feet, and average Brent to Western Canadian Select differentials as estimated by IPC’s independent reserves evaluator and as further described in the MCR. IPC’s current business plans and assumptions, and the business environment, are subject to change.
Actual results may differ materially from forward-looking estimates and forecasts. See “Forward-Looking Statements” above.
42Reader Advisory
Disclosure of Oil and Gas Information
This presentation contains references to estimates of gross and net reserves and resources attributed to the Corporation’s and Granite’s oil and gas assets. Gross reserves / resources are the working interest (operating or non-operating) share before deduction of royalties and without
including any royalty interests. Net reserves / resources are the working interest (operating or non-operating) share after deduction of royalty obligations, plus royalty interests in reserves/resources, and in respect of PSCs in Malaysia, adjusted for cost and profit oil. Unless otherwise
indicated, reserves / resource volumes are presented on a gross basis.
Reserve estimates, contingent resource estimates and estimates of future net revenue in respect of IPC’s oil and gas assets in Canada are effective as of December 31, 2019, and are included in reports prepared by Sproule Associates Limited (Sproule), an independent qualified reserves
evaluator, in accordance with National Instrument 51-101 – Standards of Disclosure for Oil and Gas Activities (NI 51-101) and the Canadian Oil and Gas Evaluation Handbook (the COGE Handbook) and using Sproule’s December 31, 2019, price forecasts.
Reserve estimates, contingent resource estimates and estimates of future net revenue in respect of IPC’s oil and gas assets in France and Malaysia are effective as of December 31, 2019, and are included in the report prepared by ERC Equipoise Ltd. (ERCE), an independent qualified
reserves auditor, in accordance with NI 51-101 and the COGE Handbook, and using Sproule’s December 31, 2019, price forecasts.
Reserve estimates, contingent resource estimates and estimates of future net revenue in respect of the oil and gas assets of Granite Oil Corp. (Granite) are effective as of December 31, 2019, and are included in reports prepared by Sproule on behalf of IPC, in accordance with NI 51-101
and the COGE Handbook, and using Sproule’s December 31, 2019, price forecasts.
The price forecasts used in the Sproule and ERCE reports are available on the website of Sproule (sproule.com) and are contained in the MCR.
2P reserves as at December 31, 2019 of 300 MMboe includes 286.2 MMboe attributable to IPC’s oil and gas assets and 14.0 MMboe attributable to Granite’s oil and gas assets. Contingent resources (best estimate, unrisked) as at December 31, 2019 of 1,089 MMboe includes 1,082.5 MMboe
attributable to IPC’s oil and gas assets and 6.2 MMboe attributable to Granite’s oil and gas assets.
Net present value (NPV) as at December 31, 2019 is after tax, discounted at 8% and based upon the forecast prices and other assumptions further described in the MCR. NPV of the 2P reserves as at December 31, 2019 of USD 2,410 million includes USD 2,202.5 million attributable to IPC’s
oil and gas assets and USD 207.6 million attributable to Granite’s oil and gas assets.
The reserve life index (RLI) is calculated by dividing the 2P reserves of 300 MMboe as at December 31, 2019 (including the 2P reserves attributable to the Granite Acquisition which is expected to be completed in March 2020), by the mid-point of the 2020 production guidance of 46,000 to
50,000 boepd. The reserves replacement ratio is based on 2P reserves of 288 MMboe as at December 31, 2018, production during 2019 of 16.7 MMboe, additions to 2P reserves during 2019 of 14.8 MMboe (or 28.8 MMboe including the 2P reserves attributable to the acquisition of the Gran-
ite assets which is expected to be completed in early March 2020) and 2P reserves of 286.2 MMboe (or 300 MMboe including the 2P reserves attributable to the Granite Acquisition which is expected to be completed in March 2020) as at December 31, 2020.
Light, medium and heavy crude oil reserves/resources disclosed in this presentation include solution gas and other by-products.
“2P reserves” means proved plus probable reserves. “Proved reserves” are those reserves that can be estimated with a high degree of certainty to be recoverable. It is likely that the actual remaining quantities recovered will exceed the estimated proved reserves. “Probable reserves”
are those additional reserves that are less certain to be recovered than proved reserves. It is equally likely that the actual remaining quantities recovered will be greater or less than the sum of the estimated proved plus probable reserves.
Each of the reserves categories reported (proved and probable) may be divided into developed and undeveloped categories. “Developed reserves” are those reserves that are expected to be recovered from existing wells and installed facilities or, if facilities have not been installed, that
would involve a low expenditure (for example, when compared to the cost of drilling a well) to put the reserves on production. The developed category may be subdivided into producing and non-producing. “Developed producing reserves” are those reserves that are expected to be
recovered from completion intervals open at the time of the estimate. These reserves may be currently producing or, if shut-in, they must have previously been on production, and the date of resumption of production must be known with reasonable certainty. “Developed non-producing
reserves” are those reserves that either have not been on production, or have previously been on production, but are shut-in, and the date of resumption of production is unknown. “Undeveloped reserves” are those reserves expected to be recovered from known accumulations where a
significant expenditure (for example, when compared to the cost of drilling a well) is required to render them capable of production. They must fully meet the requirements of the reserves classification (proved, probable) to which they are assigned.
Contingent resources are those quantities of petroleum estimated, as of a given date, to be potentially recoverable from known accumulations using established technology or technology under development, but which are not currently considered to be commercially recoverable due
to one or more contingencies. Contingencies are conditions that must be satisfied for a portion of contingent resources to be classified as reserves that are: (a) specific to the project being evaluated; and (b) expected to be resolved within a reasonable timeframe. Contingencies may
include factors such as economic, legal, environmental, political, and regulatory matters, or a lack of markets. It is also appropriate to classify as contingent resources the estimated discovered recoverable quantities associated with a project in the early evaluation stage. Contingent
resources are further classified in accordance with the level of certainty associated with the estimates and may be sub-classified based on a project maturity and/or characterized by their economic status.
There are three classifications of contingent resources: low estimate, best estimate and high estimate. Best estimate is a classification of estimated resources described in the COGE Handbook as being considered to be the best estimate of the quantity that will be actually recovered. It is
equally likely that the actual remaining quantities recovered will be greater or less than the best estimate. If probabilistic methods are used, there should be at least a 50% probability that the quantities actually recovered will equal or exceed the best estimate.
Contingent resources are further classified based on project maturity. The project maturity subclasses include development pending, development on hold, development unclarified and development not viable. All of the Corporation’s contingent resources are classified as either develop-
ment on hold or development unclarified. Development on hold is defined as a contingent resource where there is a reasonable chance of development, but there are major non-technical contingencies to be resolved that are usually beyond the control of the operator. Development un-
clarified is defined as a contingent resource that requires further appraisal to clarify the potential for development and has been assigned a lower chance of development until contingencies can be clearly defined. Chance of development is the probability of a project being commercially
viable.
The reserve estimates and contingent resource estimates included in the Sproule reports related to Granite’s oil and gas assets are based on IPC’s assessment of potential development activities related to these assets which may differ from Granite’s assessment and reported figures. All
of Granite’s contingent resources are classified by IPC as development unclarified. The chance of development risk of 70% has been applied by IPC to all of Granite’s contingent resources. The risked contingent resources (best estimate) as at December 31, 2019 is 4.3 MMboe. The contin-
gency for all of the unrisked best estimate contingent resources is IPC’s corporate commitment whether to proceed with the specific opportunities, following completion of the Granite Acquisition.
References to “unrisked” contingent resources volumes means that the reported volumes of contingent resources have not been risked (or adjusted) based on the chance of commerciality of such resources. In accordance with the COGE Handbook for contingent resources, the chance
of commerciality is solely based on the chance of development based on all contingencies required for the re-classification of the contingent resources as reserves being resolved. Therefore unrisked reported volumes of contingent resources do not reflect the risking (or adjustment) of
such volumes based on the chance of development of such resources.
43Reader Advisory
The contingent resources reported in this presentation are estimates only. The estimates are based upon a number of factors and assumptions each of which contains estimation error which could result in future revisions of the estimates as more technical and commercial information
becomes available. The estimation factors include, but are not limited to, the mapped extent of the oil and gas accumulations, geologic characteristics of the reservoirs, and dynamic reservoir performance. There are numerous risks and uncertainties associated with recovery of such
resources, including many factors beyond the Corporation’s control. There is uncertainty that it will be commercially viable to produce any portion of the contingent resources referred to in this presentation. References to “contingent resources” do not constitute, and should be distin-
guished from, references to “reserves”.
2P reserves and contingent resources included in the reports prepared by Sproule and ERCE in respect of IPC’s oil and gas assets in Canada, France and Malaysia have been aggregated by IPC and may also be aggregated by IPC with the 2P reserves and contingent resources of Granite
included in the reports prepared by Sproule on behalf of IPC. Estimates of reserves, resources and future net revenue for individual properties may not reflect the same level of confidence as estimates of reserves, resources and future net revenue for all properties, due to aggregation.
This presentation contains estimates of the net present value of the future net revenue from IPC’s reserves, as well as estimates of the net present value of the future net revenue from Granite’s reserves prepared on behalf of IPC. The estimated values of future net revenue disclosed in
this presentation do not represent fair market value. There is no assurance that the forecast prices and cost assumptions used in the reserve evaluations will be attained and variances could be material.
The reserves and resources information and data provided in this presentation presents only a portion of the disclosure required under NI 51-101. All of the required information will be contained in the Corporation’s Annual Information Form for the year ended December 31, 2019, which
will be filed on SEDAR (accessible at www.sedar.com) on or before April 1, 2020. Further information with respect to IPC’s and Granite’s 2P reserves, contingent resources and estimates of future net revenue, including assumptions relating to the calculation of net present value and other
relevant information related to the contingent resources disclosed, is disclosed in the MCR available under IPC’s profile on www.sedar.com and on IPC’s website at www.international-petroleum.com.
BOEs may be misleading, particularly if used in isolation. A BOE conversion ratio of 6 thousand cubic feet (Mcf) per 1 barrel (bbl) is based on an energy equivalency conversion method primarily applicable at the burner tip and does not represent a value equivalency at the wellhead. As
the value ratio between natural gas and crude oil based on the current prices of natural gas and crude oil is significantly different from the energy equivalency of 6:1, utilizing a 6:1 conversion basis may be misleading as an indication of value.
This presentation includes oil and gas metrics including “cash margin netback”, “taxation netback”, “operating cash flow netback”, “cash taxes”, “EBITDA netback” and “profit netback”. Such metrics do not have a standardized meaning under IFRS or otherwise, and as such may not
be reliable. This information should not be used to make comparisons
.
“Cash margin netback” is calculated on a per boe basis as oil and gas sales, less operating, tariff/transportation and production tax expenses. Netback is a common metric used in the oil and gas industry and is used by management to measure operating results on a per boe basis to bet-
ter analyze performance against prior periods on a comparable basis.
“Taxation netback” is calculated on a per boe basis as current tax charge/credit less deferred tax charge/credit. Taxation netback is used to measure taxation on a per boe basis.
“Operating cash flow netback” is calculated as cash margin netback less cash taxes. Operating cash flow netback is used to measure operating results on a per boe basis of cash flow.
“Cash taxes” is calculated as taxes payable in cash, and not only for accounting purposes. Cash taxes is used to measure cash flow.
“EBITDA netback” is calculated as cash margin netback less general and administration expenses. EBITDA netback is used by management to measure operating results on a per boe basis.
“Profit netback” is calculated as cash margin netback less depletion/depreciation, general and administration expenses and financial items. Profit netback is used by management to measure operating results on a per boe basis.
Currency
All dollar amounts in this presentation are expressed in United States dollars, except where otherwise noted. References herein to USD mean United States dollars. References herein to CAD mean Canadian dollars.
4445
You can also read


