BW OFFSHORE DNB Markets High Yield Conference - CFO Ståle Andreassen

Page created by Reginald Riley
 
CONTINUE READING
BW OFFSHORE DNB Markets High Yield Conference - CFO Ståle Andreassen
BW OFFSHORE
DNB Markets
High Yield Conference
CFO Ståle Andreassen
10 October 2019

SMARTER TOGETHER
BW OFFSHORE DNB Markets High Yield Conference - CFO Ståle Andreassen
Disclaimer
This Presentation has been produced by BW Offshore Limited exclusively for information purposes. This presentation may not be redistributed, in whole or in part, to any other
person.

This document contains certain forward-looking statements relating to the business, financial performance and results of BW Offshore and/or the industry in which it operates.
Forward-looking statements concern future circumstances and results and other statements that are not historical facts, sometimes identified by the words “believes”,
expects”, “predicts”, “intends”, “projects”, “plans”, “estimates”, “aims”, “foresees”, “anticipates”, “targets”, and similar expressions. The forward-looking statements contained in
this Presentation, including assumptions, opinions and views of BW Offshore or cited from third party sources are solely opinions and forecasts which are subject to risks,
uncertainties and other factors that may cause actual events to differ materially from any anticipated development. None of B W Offshore or any of its parent or subsidiary
undertakings or any such person’s officers or employees provides any assurance that the assumptions underlying such forward -looking statements are free from errors nor
does any of them accept any responsibility for the future accuracy of the opinions expressed in this Presentation or the actu al occurrence of the forecasted developments. BW
Offshore assumes no obligation, except as required by law, to update any forward-looking statements or to conform these forward-looking statements to our actual results.
No representation or warranty (express or implied) is made as to, and no reliance should be placed on, any information, inclu ding projections, estimates, targets and opinions,
contained herein, and no liability whatsoever is accepted as to any errors, omissions or misstatements contained herein, and, accordingly, neither BW Offshore nor any of its
parent or subsidiary undertakings or any such person’s officers or employees accepts any liability whatsoever arising directly or indirectly from the use of this document. Actual
experience may differ, and those differences man be material.

By attending this Presentation you acknowledge that you will be solely responsible for your own assessment of the market and the market position of BW Offshore and that
you will conduct your own analysis and be solely responsible for forming your own view of the potential future performance of the businesses of BW Offshore. This
presentation must be read in conjunction with the recent Financial Information and the disclosures therein.
This announcement is not an offer for sale or purchase of securities in the United States or any other country. The securities referred to herein have not been registered under
the U.S. Securities Act of 1933, as amended (the “U.S. Securities Act”), and may not be sold in the United States absent registration or pursuant to an exemption from
registration under the U.S. Securities Act. BW Offshore has not registered and does not intend to register its securities in the United States or to conduct a public offering of its
securities in the United States. Any offer for sale or purchase of securities will be made by means of an offer document that may be obtained by certain qualified investors from
BW Offshore. Copies of this Presentation are not being made and may not be distributed or sent into the United States, Canada , Australia, Japan or any other jurisdiction in
which such distribution would be unlawful or would require registration or other measures.

In any EEA Member State that has implemented Directive 2003/71/EC (together with any applicable implementing measures in any member State, the “Prospectus Directive”),
this communication is only addressed to and is only directed at qualified investors in that Member State within the meaning o f the Prospectus Directive.
This Presentation is only directed at (a) persons who are outside the United Kingdom; or (b) investment professionals within the meaning of Article 19 of the Financial Services
and Markets Act 2000 (Financial Promotion) Order 2005 (the “Order”); or (c) persons falling within Article 49(2)(a) to (d) of the Order; or (d) persons to whom any invitation or
inducement to engage in investment activity can be communicated in circumstances where Section 21(1) of the Financial Service s and Markets Act 2000 does not apply.

                                                                                                                                                                                   2
BW OFFSHORE DNB Markets High Yield Conference - CFO Ståle Andreassen
Credit investment highlights

     n
                   1   Leading global FPSO operator with track record of over 35 years and 40 projects

                   2   USD 6 billion backlog, strong cash generation and modest gearing with a Net Debt/EBITDA of 1.6x

                   3   High operational stability and selective approach to new investments

                   4   Differentiated strategy and resilient business model support long-term cash-flow generation

                   5   Highly competent board and management team supported by strong and committed main owner

                                                                                                                         3
BW OFFSHORE DNB Markets High Yield Conference - CFO Ståle Andreassen
1   Company overview

2      BW Energy

3      Financials

4      Summary

5       Appendix
BW OFFSHORE DNB Markets High Yield Conference - CFO Ståle Andreassen
Specialist in offshore field development and production

   Significant experience from almost every oil producing                                                                                                FPSO Units
   region globally                                                                                                                                       Fields
                                                                                                      BW Catcher | UK | Premier Oil                      Offices
   Delivered 40 projects worldwide since 1983
                                                                                                      BW Athena | lay-up                                 Crew centers
   12 FPSOs in operation producing ~600,000 boe per day
   Strong fleet performance with 99% average uptime over
   last five years
                                                                     BW Pioneer | U.S. | Murphy Oil
   Revenue backlog of USD 6 billion (including probable              Yùum K'ak'nàab | Mexico | Pemex
   options)                                                                                                       Europe
   Listed on the Oslo Stock Exchange with a market                            The U.S.
   capitalisation of ~USD 1.4 billion

                                                                                                                    Africa
BW Offshore (‘BWO’) core expertise
                                                                                             Brazil
        Onshore staff including design and delivery
        (~800 FTEs)                                                                                                                                Oceania
                                                                                                                             BW Joko Tole | Indonesia | KEI
        Offshore operations                                                                                                  Umuroa | New Zealand | Tamarind
        (1,400 offshore operators)                                                                                           FPSO Cidade de São Mateus
                                                      BW Cidade de São Vicente | Petrobras                                   Berge Helene
                                                      FPSO Polvo | PetroRio
        Subsurface interpretation                                                            Sendje Berge | Nigeria | Addax
                                                      Maromba field investment
        (10+ geologist/geophysicist/RE)                                                      Abo FPSO | Nigeria | AGIP/ENI
                                                                                             Espoir Ivoirien | Ivory Coast | CNR
        Drilling                                                                             BW Adolo | Gabon | BW Energy
        (20+ drilling team)                                                                  Petróleo Nautipa | Gabon | VAALCO
                                                                                             Dussafu field investment
                                                                                             Kudu field investment
        Field development
        (15+ development managers)

                                                                                                                                                                        5
BW OFFSHORE DNB Markets High Yield Conference - CFO Ståle Andreassen
Supportive main owner with a long-term perspective

                             BW Offshore                                   BW Energy

                               FPSO Units                                     E&P
                            49.9% ownership                        30.5% BW Group / 68.6% BWO

                                  15
            BW LPG                                    DHT                                           Epic Gas

                                                                                                                         BW Group is a global maritime company engaged
         LPG carriers                           Crude carriers                           LPG and chemical carriers
       47.6% ownership                          35% ownership                                83.3% ownership         1   in shipping, floating gas infrastructure and offshore
                                                                                                                         oil & gas production

              49                                        27                                             32
                                                                                                                         Operates over 400 vessels including the world’s
        BW Dry Cargo                               BW LNG                                            Hafnia          2   largest gas shipping fleet

       Dry cargo carriers                        LNG Carriers                                  Product tankers
        100% ownership                          100% ownership                                 65.1% ownership

                                                                                                                         The Sohmen-Pao family owns 100% of holding
                                                                                                                     3   company BW Group Limited
              18                                        23                                            102

        #   Number of vessels    To be listed    Publicly listed      OTC listed   Privately held

2019                                                                                                                                                                             6
BW OFFSHORE DNB Markets High Yield Conference - CFO Ståle Andreassen
Experienced management and board with proven track record

                                             Board of Directors

   Andreas         Christophe          Clare               Maarten R.   René Kofod-Olsen      Carl K. Arnet
 Sohmen-Pao     Pettenati-Auzière   Spottiswoode            Scholten          Director          Director
  Chairman       Vice Chairman        Director               Director

                                               Management

 Marco Beenen   Ståle Andreassen    Rune Bjorbekk           Kei Ikeda      Magda Vakil       Lin G. Espey
     CEO               CFO              CCO                   COO         General Counsel   Chief E&P Officer

                                                                                                                7
BW OFFSHORE DNB Markets High Yield Conference - CFO Ståle Andreassen
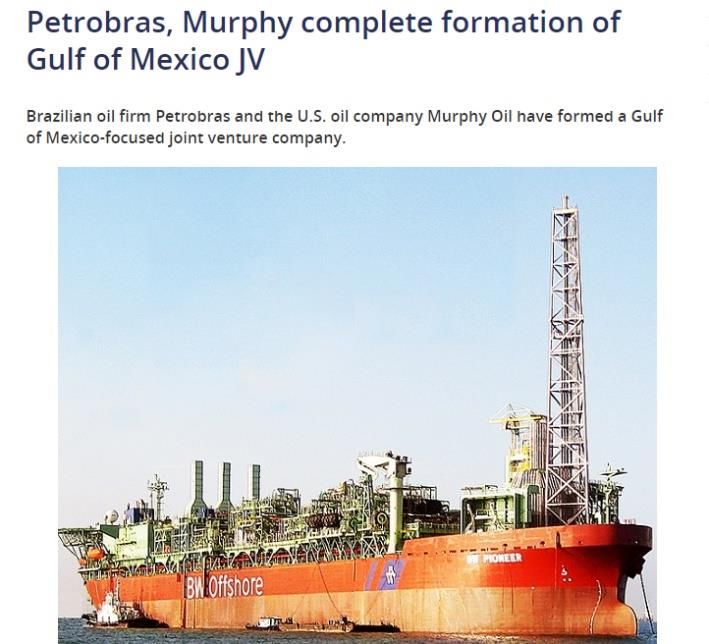
FPSOs are a critical component of O&G field infrastructure

   Exploration – more sensitive to oil prices                                      Production – less sensitive to oil prices

                        Exploration
        Seismic
                         / Drilling           Subsea                        Production                         Storage         Transportation   Terminals

   1                          2                        3                       4                          5
                                                            Construction
         Business                     Engineering
                                                             installation            Production               Re-deployment
        development                   procurement
                                                           commissioning

  BWO enables safe and cost-effective operations and delivery of oil & gas products, allowing oil companies to produce oil in remote areas
  After processing, FPSOs store oil or gas before offloading to shuttle tankers or transmitting processed petroleum via pipelines
  FPSOs are relatively easy to move and consequently a viable option for marginal fields and development fields with no existing pipelines or infrastructure

           BWO operates in the less volatile production part of the oil supply chain which provides cash flow visibility

                                                                                                                                                               8
BW OFFSHORE DNB Markets High Yield Conference - CFO Ståle Andreassen
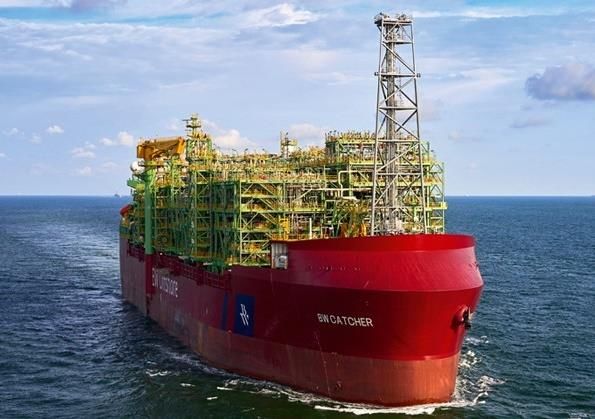
Proven reservoir + FPSO redeployment = value creation

                 Key field investment criteria                             The BWE model solves the traditional E&P challenge

 Access to attractive projects
 ‒ Major divestment efforts of offshore assets by large players
 ‒ Developments not prioritised by established E&P companies due to
   their size failing to meet return requirements under the traditional                   The right         Extensive
   development model                                                                       FPSO                local
                                                                                                            knowledge

 Leverage BWO’s global operating experience
 ‒ FPSO related oil & gas assets
 ‒ Located in countries and geologies well known to us
                                                                                Sharing
                                                                                  risk/         Creating the
 Solid understanding of the field’s subsurface                                                                    Phased
                                                                                 reward         opportunity      approach

 Deploy existing FPSOs
 ‒ Lower cost of initial infrastructure
 ‒ Potential for phased development / de-risking development
                                                                                              Minimising capex
 ‒ Robust base case with significant upside

             Combined strategy increases ability and probability of BWO extending and redeploying existing FPSOs
                                          Integrated approach unaffected by planned BWE spin-off
                                                                                                                                9
BW OFFSHORE DNB Markets High Yield Conference - CFO Ståle Andreassen
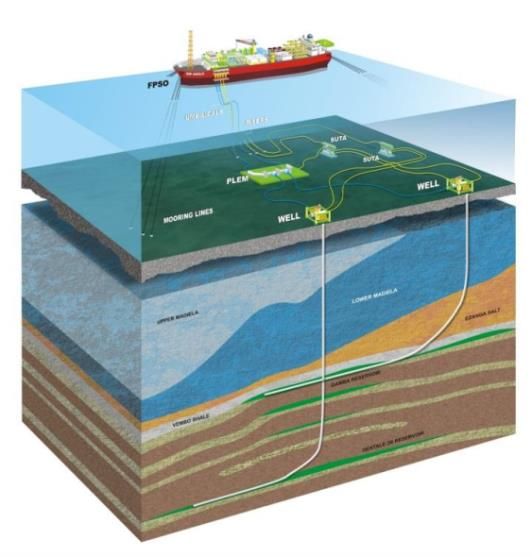
Understanding field risk and reward is key

  E&P competence adds visibility to options likely to be
  exercised

  Strengthened position in negotiations for life-of-field
  extensions beyond firm and option periods

  Enabler for FPSO redeployment strategy

  Improved commercial assessment for new projects

                                                            Sources: The Herald, Offshore Energy Today

                                                                                                         10
Combined strategy unlocks value in existing fleet

Four out of six 2019 extensions confirmed
      BW Cidade de
                                  FPSO Polvo                  Abo FPSO                Petróleo Nautipa                  Umuroa            BW Pioneer
       São Vicente

                                                                                                                                        Discussing further
  Extended until Q2 2020      Extended until Q3 2020    Extended until end 2019     Extended until Q3 2021         Ongoing discussion
                                                                                                                                           extensions

Bringing redeployment candidates on contract
        BW Adolo                 Berge Helene                BW Athena
       In operation          Redeployment candidate    Redeployment candidate

                                                                                                         Confirmed / reserved

 On Dussafu field offshore    Reserved for Maromba
                                                       Mainly targeting North Sea                        Pending
         Gabon                 field offshore Brazil

                                                                                                                                                             11
Significant value beyond firm period from options and redeployments

                                  First oil 2017
   BW Catcher
                                         Firm period                       Probable options         Possible options      New contract

                                                                                5x1                     13 x 1
                                             7 years                                                                      Redeployment
                                                                           12-month options         12-month options

                                  First oil 2006                                                                        First oil 2022

  Berge Helene                           Firm period                       Options declared         Open / conversion    BWE Maromba*

                                                                                2 + 2 years
                                             7 years                                                    3 years           Redeployment
                                                                                + 7 months

* Berge Helene is reserved pending agreement for use on BW Energy’s Maromba field offshore Brazil
                                                                                                                                         12
FPSO business providing strong long-term cash generation

Unit                               2013        2014        2015          2016   2017       2018        2019       2020        2021    2022     2023       2024   2025   2026

BW Adolo*                          BW Energy, Gabon: 2018-2028 (2038)

BW Catcher                         Premier Oil, UK: 2018-2025 (2043)

Yúum K’ak’ Náab                    Pemex, Mexico: 2007-2022 (2025)

BW Joko Tole                       Kangean, Indonesia: 2012-2022 (2026)

Espoir Ivoirien                    CNR, Ivory Coast: 2002-2022 (2036)

Sendje Berge                       Addax/Sinopec, Nigeria: 2012-2021 (2023)

Petróleo Nautipa                   VAALCO, Gabon: 2002-2021 (2022)

BW Cidade de São Vicente           Petrobras, Brazil: 2009-2020 (2024)

FPSO Polvo                         PetroRio, Brazil: 2007-2020 (2022)

BW Pioneer                         Murphy Oil, US: 2012-2020

Umuroa                             Tamarind, New Zealand: 2007-2019 (2022)

Abo FPSO                           Agip/Eni, Nigeria: 2003-2019 (2020)

Berge Helene (Reserved)            Petronas, Mauritania: 2006-2017

FPSO Cidade de São Mateus**        Petrobras, Brazil: 2009-2019 (2024)

BW Athena (Tendering)              Ithaca, UK: 2012-2016

                              Lease & Operate - fixed period                      Operation - fixed period                           Construction / EPC
                              Lease & Operate - option period                     Operation - option period

                                          * Contract duration reflects BWO estimated field life (2028) and current license (2038)
                                          ** At yard pending agreement with Client
                                                                                                                                                                               13
Selective investment approach enhancing financial performance

  BW Catcher confirming ability to deliver                                                     USD
  new high-value FPSO projects
                                                156 FPSO | 43 E&P EBITDA                       million

  BW Adolo redeployment triggered by clearly
  defined E&P strategy                         180                                                                 43
                                                                                                           55
                                               155
  Successful launch of BW Energy and
                                                                                                 15
  Dussafu investment                           130
                                                                                       7
                                               105

                                               80                                                                 156
                                                                                                134       137
                                               55                                     120
                                                                     109     105
                                                      83      75
                                               30

                                                5

                                               -20
                                                     Q3 17   Q4 17   Q1 18   Q2 18    Q3 18    Q4 18      Q1 19   Q2 19
                                                                      FPSO      E&P        Eliminations

                                                                                                                        14
Strong fleet performance and HSE focus

Fleet uptime                                                                    HSE record (LTI1)

  99.8 % 98.4 % 99.6 % 100.0 %               99.5 % 99.4 % 99.7 %
                               95.6 % 98.4 %                                       5.0

                                                                                   4.0

                                                                                   3.0

                                                                                   2.0

                                                                                   1.0

                                                                                   0.0

    The FPSO fleet has delivered 99% average uptime over the                        BWO prioritises safety first in all its operations and strives
                         last five years                                                              towards “zero harm”

1) Lost time injuries per million man-hours. Last Twelve Months (LTM) figures                                                                        15
Focused on industry and company specific ESG issues

BW Offshore is committed to contributing towards the United                 Continuously evolving Environmental Social and
Nations’ Sustainable Development Goals                                      Governance (‘ESG’) strategy and reporting

            ▪   Provide safe and meaningful jobs to a substantially local       Separate Sustainability Report published as part of the
                workforce – zero harm policy                                1   2018 Annual Report
            ▪   Be an equal opportunity employer ensuring diversity             Included summary of ESG Key Performance Indicators (‘KPIs’) for
                                                                                2018

           ▪    Targeting zero spills and compliance with all regulatory
                requirements
                                                                                Engaging with relevant stakeholders and agencies
           ▪    Ensure high asset quality and operational integrity         2
                                                                                Focusing on material risks and opportunities to further develop
           ▪    Optimise use of energy, water and other consumables             and implement the appropriate polices and procedures
           ▪    Adhere to Hong Kong convention for ship recycling

                                                                                                                                                  Summary of ESG KPIs:

                                                                                Build year-on-year KPI history to monitor performance
                                                                                and drive improvement
           ▪    Clear guidelines for ethical and good business conduct      3
                                                                                Ambition to establish clearly defined ESG related KPI targets
           ▪    Anti-corruption measures and responsible procurement

                                                                                                                                                            16
1   Company introduction

3       BW Energy

3        Financials

4        Summary

5        Appendix
This is BW Energy

                                                                     Business model proven by first oil from Dussafu in Gabon 18 months
                                                Arnet Energy
                                              (CEO Carl K. Arnet)    after acquisition
             68.6%                30.5%                   0.9%       Completion of the Maromba acquisition in Brazil will more than double
                                                                     estimated net reserves and resources to 214 mmbbl

                                                                     On track to increase Dussafu gross production to ~30,000 bopd by
                                                           New       fully implementing Tortue phase 2 and Ruche development by Q4
                                                         investors
                        BW Energy Limited                            2021
                           (Bermuda)
                                                                     Significant upside beyond current commercial reserves in Dussafu
                                                                     and Maromba
  BW Energy Holdings
       Pte. Ltd
                       BW Kudu Holding Pte.
                               Ltd
                                                  BW Maromba
                                                 Holdings Pte. Ltd
                                                                     Ready to list on the Oslo Stock Exchange
     (Singapore)           (Singapore)             (Singapore)
                                                                     Encouraging investor feedback from existing BWO shareholders and
                                                                     potential new investors received during market sounding in May and
                                                                     June
   Dussafu Permit,           Kudu,                 Maromba,
       Gabon
 (73.5% operated WI)
                            Namibia
                        (56% operated WI)
                                                     Brazil
                                               (100% operated WI)
                                                                     Current market sentiment is volatile

                                                                     BWO to continue as majority shareholder

                                                                                                                                        18
Combined strategy enables fast-track FPSO redeployment

     Dussafu pre-BWE acquisition                                     Creating the opportunity                                     Dussafu current status* (gross)
                                                                                                           Fastest-ever FPSO
                                                                                                             development
                                                                                          Extensive
                                                                         The right          local
                                                                          FPSO            knowledge

                                                                                                                 18
                                                                  Sharing
                                                                                                             months to first
                                                                    risk/                        Phased           oil
                                                                   reward                       approach

                                                                             Minimising capex                Two successful
                                                                                                            exploration wells

             No path to FID
                                                                       1P reserves                                7  X             2P+2C 102 mmbbl
                                                                     15 mmbbl (gross)                           increase

          USD ~500 million                                      USD ~85 million FPSO
         FPSO commitment                                            investment                                 1/5                ~4.2 mmbbl produced
                                                                                                            asset commitment

      USD ~800 million field
          investment
                                                             Efficient USD ~175 million
                                                                    development
                                                                                                               1/5              USD ~110 million operating
                                                                                                                                       cash flow
                                                                                                             field CAPEX

* From first oil through August 2019. All reserve estimates exclude Hibiscus discovery.                                                                             19
Balanced risk reward and arm’s length FPSO contracting

 More flexible FPSO contracts possible due to integrated approach

 Balanced risk reward enables longer durations and phased development

 Ensure competitive and arm’s length contracting to meet various stakeholder requirements

Parameters                                   BWE approach                      Conventional oil company approach

Minimum case                     P50-P90 reserves with good upside potential      P50 reserves + prove up total field

Costs                                   At a minimum to sanction P90               Escalating to capture all reserves

FPSO contract                            Reflecting minimum capex              Hell-and-high-water: Reflecting high capex

FPSO termination fee                               Limited                           Yes, supported by guarantees

Reservoir risk                                     Shared                                        None

                                   Long-term contract supported by phased
Upside FPSO contractor                 development and upgrade work
                                                                                                 None

Upside Oil Co.                                 More reserves                                More reserves

Alignment of interest                               Yes                                         Limited

                                                                                                                            20
BW Energy will be largely self financed

                                                                                                      Multiple funding sources available

                                                                                                      1      Operational cash flow from E&P segment

2019 to 2025 capex                                  Average annual capex
                                                                                                      2      BWE cash on hand

   USD 1.4 billion fully
    discretionary net
   capex budgeted for
         BWE1                       ~                   USD 230 million                               3

                                                                                                      4
                                                                                                            USD 300 million RBL on Dussafu (including accordion)

                                                                                                            IPO proceeds

                                                                                                      5     Farm-downs and other alternative sources

                                                                                                      6     Potential RBL financing of Maromba

1) From BWE Investor Presentation 29 May 2019. USD 1.4 billion net figure calculated based on 73.5%
BWE ownership of Dussafu and 100% of Maromba (now 95%) and includes the following:
  - Tortue phase 1 and 2, Ruche phase 1 and Maromba phase 1 and 2 development capex
  - Maromba acquisition cost of USD 115 million
  - Dussafu exploration costs of USD 88 million

                                                                                                                                                                   21
1   Company introduction

2       BW Energy

3        Financials

4        Summary

5        Appendix
Strong FPSO backlog and increasing E&P reserve base

USD 6bn FPSO revenue backlog to a diverse set of clients                                      E&P assets will be financed on a stand-alone basis

                                                                                                                     14%

                                                                                                                            9%           Dussafu - Tortue
   Firm                                                                                                      214                         Dussafu - Ruche
                                50%                      50%                                                                             Dussafu - Other discoveries
   Option                                                                                                   mmbbl           13%          Maromba
                                                                                                    65%

                         Note: Options considered likely to be exercised                                           NSAI estimate net reserves and resources.*
                                                                                                                    Excluding recent discovery on Hibiscus

Client base
                                           5%
                                                                                                       11,765 bopd
                                                                                                  July & August 2019 average
                                    16%                                                              gross daily production
   Int. E&P                                             35%                                                                                                        Dussafu
   Catcher partnership
   BW Energy
                                                                                                        214 mmbbl*
                                                                                                       Net reserve estimate
   NOC                                                                                                                                                         Maromba
                                                                                                                                                                          Kudu
                                        44%                                                                   ~12x
                                                                                                 Increase in reserve base from
                                                                                                              2017
* Refers to Netherland, Sewell & Associates 2P and 2C (including development unclarified) 2019 mid-year report. Net reserves assumes 73.5% and 95% working interest in Dussafu and
  Maromba respectively.
                                                                                                                                                                                     23
Transparent corporate and capital structure
Simplified group structure for BW Offshore

                                                                                                                     All FPSO owning SPVs and management / operational
                                           Public shareholders
                                            (free float – OSE)
                                                                                                              1      companies owned 100% directly or indirectly by BWO

             49.9%                                     50.1%                                                         All bank debt is secured and issued at the asset owning
                                                                                                              2      level and benefit from a corporate guarantee

                          BW Offshore Ltd.                                                                            Unsecured bonds issued by parent BW Offshore while
                            (Bermuda)
                           OSE: “BWO”                                                                         3       preferred equity1 has been issued at the BW Catcher
                                                                                                                      FPSO level

                                                                                                                     Upstream assets have been organised under-stand alone
                                                                                                              4      entity BW Energy (“BWE”) financed by external capital
      100%                                               68.6%

                                                                                                                      Dussafu assets in Gabon mainly self financed through
             FPSOs                                                                                            5       strong cash flow and RBL of USD 300 million (including
                                                                                                                      accordion) being negotiated

   100% ownership in 15                    Ownership in oil and gas
         FPSOs                             assets in Gabon, Brazil                                                   Plans to list on the Oslo Stock Exchange and raise external
                                                and Namibia                                                          capital to finance development of the recently acquired
                                                                                                              6      Maromba field in Brazil and strengthen liquidity ahead of
                                                          Non-recourse to BWO                                        further growth

1) In November 2017 BWO issued preference shares with a preferential dividend right to ICBC Financial Leasing Co., Ltd. (ICBCL) for an aggregate subscription price of USD
275.0 million. The company plans to redeem the preference shares in full over an estimated term of 12 years. The balance was USD240.6 million at the end of Q2 2019.

                                                                                                                                                                               24
Strong liquidity and balanced long-term instalment profile

      Long-term growth in FPSO EBITDA1                                                                                             Well positioned to address upcoming bond maturities
600                                                                                                                        600
                                                                                                                                                Corporate facility 2             BW Catcher facility
                                                                                                                                                                                       3
                                                                                               547                                              Petróleo Nautipa facility        Bonds
                                                                           496
500                                                                                                                        500
                                                      468

                                 408
400         372                                                                                                            400
                                                                                                                                                                                                       343
                                                                                                                                                          302
300                                                                                                                        300
                                                                                                                                                                           257   247                   143
                                                                                                                                                                                            212
200                                                                                                                        200
                                                                                                                                                          177                    82
                                                                                                                                                                           134
                                                                                                                                                                                  8         114
                                                                                                                                                           12                8
100                                                                                                                        100                                                   114                   200
                                                                                                                                         63
                                                                                                                                          6               114              114               98
                                                                                                                                         57                                      43
  0                                                                                                                            0
           LTM per            LTM per              LTM per             LTM per              LTM per                                  H2 2019             2020             2021   2022      2023        2024
            Q2 18              Q3 18                Q4 18               Q1 19                Q2 19

                   Healthy USD 538 million BWO Group liquidity position and maturities from March 2020 provides ample flexibility
      1)   Reported EBITDA (before eliminations)
      2)   Corporate facility repayments based on drawn balance of USD 340 million end Q2 19. 2024 maturities includes balloon repayment in addition to scheduled instalments.
      3)   Bond instalments including cross-currency swaps of ~USD 100 million end Q2 19 to reflect actual cash effect
                                                                                                                                                                                                              25
Strong balance sheet and credit metrics
                                                                                                                                                                                      1
        Net debt and leverage development                                                                                                     EBITDA development
                                            Net debt              NIBD/EBITDA (reported)                                                                                      Reported (FPSO)            Reported (E&P)
                                                                                                                                                                                                                                                   187    192
2,400                                                                                                                           5.0x
                                                                                                                                  198.0
                          3.9x    3.9x     3.6x             3.6x    3.8x                                                                                               165
2,200             3.2x                             3.3x                     3.2x     3.3x                                       4.0x
         3.0x                                                                                3.0x                                                                                                                                           149
2,000                                                                                                 2.5x                      3.0x
                                                                                                              2.0x                148.0                                                                                            126
                                                                                                                      1.6x                                                                119
1,800                                                                                                                           2.0x                                                                              109      105
        1,631 1,661 1,639 1,635                                                                                                                97
1,600                                                      1,522                                                                1.0x98.0               85                                         82
                                                                                                                                                                77                                        74
                                          1,378 1,407                                                                                                                            62
1,400                                                              1,275 1,221 1,218 1,233 1,232                                0.0x
                                                                                                             1,151
1,200                                                                                                                 1,046     -1.0x
                                                                                                                                    48.0
1,000                                                                                                                           -2.0x
 800                                                                                                                            -3.0x-2.0
          Q1   Q2   Q3   Q4   Q1   Q2   Q3   Q4   Q1   Q2   Q3   Q4   Q1   Q2                                                                 Q1   Q2   Q3   Q4   Q1   Q2   Q3   Q4   Q1   Q2   Q3   Q4   Q1   Q2
         2016 2016 2016 2016 2017 2017 2017 2017 2018 2018 2018 2018 2019 2019                                                               2016 2016 2016 2016 2017 2017 2017 2017 2018 2018 2018 2018 2019 2019

        Liquidity                                                                                                                             Equity ratio development
700.0                                                                                                                               45%
                                                                                                                                                                                                                                                          41%
                                                                             597
600.0                                                               554              554                               538          40%

500.0                                                                                         459                                   35%
                                                                                                      416
400.0                                               353                                                       371                   30%
                          319      323
         286      288                      271              293
300.0                                                                                                                               25%

200.0                                                                                                                               20%

100.0                                                                                                                               15%

 ,0.0                                                                                                                               10%
          Q1   Q2   Q3   Q4   Q1   Q2   Q3   Q4   Q1   Q2   Q3   Q4   Q1   Q2                                                                  Q1   Q2   Q3   Q4   Q1   Q2   Q3   Q4   Q1   Q2   Q3   Q4   Q1   Q2
         2016 2016 2016 2016 2017 2017 2017 2017 2018 2018 2018 2018 2019 2019                                                                2016 2016 2016 2016 2017 2017 2017 2017 2018 2018 2018 2018 2019 2019

        1) Significant one-off items: Q4 2017 includes insurance recovery of USD 94.3 million. Q1 2017 includes USD 13.7 million in provisions related to Sendje Berge. Q2 2017 includes USD 45.5 million reversal of provisions for overdues on
        Sendje Berge.                                                                                                                                                                                                                                26
Proven access to capital and prudent risk management

Leveraging existing BW capital sources and relationships                     2016 recapitalisation provided a balanced solution

  ~40 BW relationship banks of which ~20 are lenders to BWO                    BWO approached all stakeholders at an early stage as a proactive
                                                                               measure in a challenging market
  BW Group has accessed the bank / ECA, bond, hybrid and equity as well
  as leasing markets across the various group companies                        BW Group contributed its pro-rata share of the equity raise
  BWO raised USD 672.5 million from 16 banks in the May 2019 corporate         BWO agreed to certain restrictions including not paying dividends
  facility refinancing (60% oversubscription)
                                                                               Banks pushed out amortisation and maturities
  2.25% margin with a 0.25% step-up if utilisation above 50%                   Bondholders agreed to extend maturities and give BWO call options on
  BWO has issued preference shares to ICBC Leasing and is furthermore a        the bonds in exchange for some amortisation
  frequent issuer in the Nordic high yield market
  BWO has good access to a range of financing sources to fund future capex

                                                               BWO bank group

                                                                                                                                                      27
1   Company introduction

2   BW Energy overview

3        Financials

4        Summary

5        Appendix
Key credit considerations

Combined FPSO and field development strategy provides predictable debt service capacity through the cycles

                                   FPSO segment has proven resilient while combined business model and
 Differentiated strategy   1
                                   selective investment approach enhances financial performance

                                   Healthy backlog and successful delivery of E&P and FPSO growth projects
 Strong cash flow          2
                                   has ensured significant debt service capacity

                                   Robust balance sheet and establishment of BW Energy as separate entity
 Financially solid         3
                                   enhances the ability of both companies to access the right capital

                                                                                                             29
1   Company introduction

2       BW Energy

3        Financials

4        Summary

5        Appendix
Income statement highlights per segment Q2 19

 Operating revenues                                       EBITDA                                                   EBIT

                                                USD                 USD                                  USD                                                       USD
  251 FPSO | 56 E&P                             million         156 FPSO
                                                                    million | 43 E&P                     million     69USD
                                                                                                                        FPSO | 22 E&P
                                                                                                                       million                                     million

                                                                                                                   110

 275                                                      180

                                                                                                                    90
                                                          155
 225

                                                          130
                                                                                                                    70
 175
                                                          105

                                                                                                                    50
 125                                                       80

                                                           55                                                       30
  75

                                                           30
  25                                                                                                                10
                                                            5

 -25                                                      -20                                                       -10
       Q3 17 Q4 17 Q1 18 Q2 18 Q3 18 Q4 18 Q1 19 Q2 19          Q3 17 Q4 17 Q1 18 Q2 18 Q3 18 Q4 18 Q1 19 Q2 19           Q3 17 Q4 17 Q1 18 Q2 18 Q3 18 Q4 18 Q1 19 Q2 19

                   FPSO    E&P   Eliminations                               FPSO    E&P   Eliminations                                FPSO    E&P   Eliminations

                                                                                                                                                                       31
Income statement

USD million                                           H1 2019      2018      2017      2016

Operating revenues                                      582.4     870.4     626.0     844.7

Operating expenses                                     (204.9)   (382.6)   (290.7)   (421.9)

Share of profit from associates                           0.9       1.4       0.9       0.6

EBITDA                                                  378.4     489.2     336.2     423.4

Depreciation                                           (204.0)   (336.5)   (225.9)   (224.6)

Amortisation                                             (1.2)     (2.1)     (2.7)     (2.8)

Impairment                                                0.0      (0.1)    (27.4)   (231.0)
Gain/(loss) sale of assets                                0.1       7.0       0.0       0.0

EBIT                                                    173.3     157.5      80.2     (35.0)

Net interest expense                                    (42.2)    (77.1)    (37.8)    (44.5)
FX, financial instruments and other financial items     (27.4)     (3.6)      1.1     (20.7)

Profit (loss) before tax                                103.7      76.8      43.5    (100.2)

Income tax expense                                      (37.7)    (40.3)     (2.3)    (32.7)
Net profit (loss)                                        66.0      36.5      41.2    (132.9)

                                                                                          32
Statement of financial position

USD million                       H1 2019      2018      2017      2016

Total non-current assets          2,837.2    2,951.7   2,999.0   2,771.3

Total current assets                552.8     464.8     423.8     596.6

Total assets                      3,390.0    3,416.5   3,422.8   3,367.9

Total equity                      1,373.4    1,320.9   1,259.4    919.9

Total non-current liabilities     1,499.0    1,499.0   1,642.0   2,009.6

Total current liabilities           517.6     596.6     521.4     438.4

Total liabilities                 2,016.6    2,095.6   2,163.4   2,448.0

Total equity and liabilities      3,390.0    3,416.5   3,422.8   3,367.9

USD million                       H1 2019      2018      2017      2016

Reported interest bearing debt    1,311.3    1,373.7   1,420.8   1,741.8

Cash and deposits                  (265.2)   (142.1)   (145.5)   (106.9)

Net interest bearing debt         1,046.1    1,231.6   1,275.3   1,634.9

                                                                       33
Cash flow statement

USD million                                   H1 2019      2018      2017      2016

Net cash flow from operating activities         302.3     435.9     659.5     387.5

Net cash flow from investing activities         (62.0)   (354.8)   (476.6)   (399.7)

Net cash flow from financing activities        (117.2)    (84.5)   (144.3)     (2.7)

Net change in cash and cash equivalents         123.1      (3.4)     38.6     (14.9)

Cash and cash equivalent at start of period     142.1     145.5     106.9     121.8

Cash and cash equivalent at end of period       265.2     142.1     145.5     106.9

                                                                                   34
Bank debt facilities overview per Q2 2019

Facility                                                   Corporate credit facility                                   BW Catcher                                  Petroleo Nautipa

Borrower:                                          BW Offshore Shipholding Pte Ltd                     BW Catcher Limited                                  BW Offshore Nautipa AS

BW Offshore Limited parent
                                                   Yes                                                 Yes                                                 Yes
guarantee:
                                                   USD 672.5 million (USD 340 million
Amount (drawn):                                                                                        USD 657.1 million                                   USD 33.4 million
                                                   drawn)

Type:                                              Reducing revolver                                   Term loan                                           Term loan

Maturity:                                          May 2024                                            July 2024                                           September 2022

                                                   2.25% with a 0.25% step-up if
Margin:                                                                                                2.25%                                               1.70%
                                                   utilisation above 50%

Annual instalments / reductions:                   USD 105.0m                                          USD 114.3m                                          USD 11.6m

                                                   Abo FPSO
                                                   BW Adolo
                                                   Berge Helene
                                                   BW Athena
                                                   BW Cidade de São Vicente
Collateral Vessels:                                                                                    BW Catcher                                          Petroleo Nautipa
                                                   BW Pioneer
                                                   Espoir Ivoirien
                                                   FPSO Polvo
                                                   Sendje Berge
                                                   Yuum Kak Naab

1)   Available revolving credit facility is USD272.5 million after including USD 60.0 million performance bond in addition to USD340.0 million drawn amount.

                                                                                                                                                                                      35
Bond debt overview per Q2 2019

Bond                            BWO01                          BWO02                          BWO03                          BWO04                        Total

Borrower:                 BW Offshore Limited            BW Offshore Limited            BW Offshore Limited            BW Offshore Limited         BW Offshore Limited

Amount outstanding          NOK 360 million                NOK 500 million                NOK 750 million                NOK 900 million            NOK2,510 million

Nominal USD amount          USD 42.1 million               USD 58.4 million               USD 87.6 million              USD 104.9 million           USD 293.0 million

Swapped USD amount          USD 65.0 million               USD 86.8 million              USD 124.0 million              USD 117.0 million           USD 392.8 million

Final maturity:               March 2020                   September 2020                   March 2021                     March 2022

                               Currently 4.50%                Currently 4.50%                Currently 4.50%               Currently 4.25%
Margin:                Increased from 4.25% after     Increased from 4.15% after     Increased from 3.50% after     Will increase to 4.50% after
                        initial March 2017 maturity    initial March 2018 maturity    initial March 2019 maturity    initial June 2020 maturity
                                                                                                                           March 2021
                                                                                                                          NOK 90 million           March 2020 through
                                                            March 2020                    September 2020
Partial redemptions:                                                                                                                                December 2021
                                                           NOK 100 million                NOK 150 million
                                                                                                                         December 2021              NOK 520 million
                                                                                                                         NOK 180 million

                                                                                                                                                                  36
Clear path to BWE production growth

                          2019                                  2020                                    2021             2022

               Hibiscus
                                                               Further exploration wells
               updip
    Dussafu

               Tortue phase 2 field development                Phase 2
                                                               1st oil
                                                                                                               Ruche
               Ruche studies / FEED             Ruche field development                                        1st oil

               ANP approval
    Maromba

                                                FDP
               Phase 1 study / FEED
                                                approval

                                                                                                                         Phase 1
                                                                  Phase 1 field development
                                                                                                                         1st oil
 Corporate /

                    IPO
   Other

                            Further farm-ins or acquisitions

                                                                           Potential farm-out Maromba

                                                                                                                                   37
Previously reported gross BWE capex

                                                  Capex
Total gross project cost from 2017 inception
                                               (USD million)
Tortue phase 1                                     175
Tortue phase 2                                     240
Ruche phase 1                                      375
Dussafu exploration cost                            88
Maromba phase 1                                    250
Maromba acquisition cost                           115
Maromba phase 2                                Not disclosed

                                                               38
For further information please contact ir@bwoffshore.com
You can also read