Occidental Proposal to Acquire Anadarko - Occidental Petroleum
←
→
Page content transcription
If your browser does not render page correctly, please read the page content below

Occidental Proposal to Acquire Anadarko

April 24, 2019
Cautionary Statements
Forward-Looking Statements
Any statements in this presentation about Occidental Petroleum Corporation’s (“Occidental”) expectations, beliefs, plans or forecasts, including statements regarding the proposed
transaction between Occidental and Anadarko Petroleum Corporation (“Anadarko”), benefits and synergies of the proposed transaction and future opportunities for the combined
company and products and securities, that are not historical facts are forward-looking statements. These statements are typically identified by words such as “estimate,” “project,”
“predict,” “will,” “would,” “should,” “could,” “may,” “might,” “anticipate,” “plan,” “intend,” “believe,” “expect,” “aim,” “goal,” “target,” “objective,” “likely” or similar expressions that
convey the prospective nature of events or outcomes. Forward-looking statements involve estimates, expectations, projections, goals, forecasts, assumptions, risks and uncertainties.
Actual results may differ from anticipated results, sometimes materially, and reported or expected results should not be considered an indication of future performance. Factors that
could cause actual results to differ include, but are not limited to: global commodity pricing fluctuations; changes in supply and demand for Occidental’s products; higher-than-expected
costs; the regulatory approval environment; not successfully completing, or any material delay of, field developments, expansion projects, capital expenditures, efficiency projects,
acquisitions or dispositions; technological developments; uncertainties about the estimated quantities of oil and natural gas reserves; lower-than-expected production from operations,
development projects or acquisitions; exploration risks; general economic slowdowns domestically or internationally; political conditions and events; liability under environmental
regulations including remedial actions; litigation; disruption or interruption of production or manufacturing or facility damage due to accidents, chemical releases, labor unrest, weather,
natural disasters, cyber-attacks or insurgent activity; and failures in risk management.

Such factors also include the ultimate outcome of any possible transaction between Occidental and Anadarko, including the possibility that Anadarko will reject the proposed transaction
with Occidental or that the terms of any definitive agreement will be materially different from those described herein; uncertainties as to whether Anadarko will cooperate with
Occidental regarding the proposed transaction; the parties’ ability to consummate the proposed transaction; the conditions to the completion of the proposed transaction, including the
receipt of Anadarko stockholder approval and Occidental stockholder approval; that the regulatory approvals required for the proposed transaction may not be obtained on the terms
expected or on the anticipated schedule or at all; Occidental’s ability to finance the proposed transaction; Occidental’s indebtedness, including the substantial indebtedness Occidental
expects to incur in connection with the proposed transaction and the need to generate sufficient cash flows to service and repay such debt; Occidental’s ability to meet expectations
regarding the timing, completion and accounting and tax treatments of the proposed transaction; the possibility that Occidental may be unable to achieve expected synergies and
operating efficiencies within the expected time-frames or at all and to successfully integrate Anadarko’s operations with those of Occidental; that such integration may be more difficult,
time-consuming or costly than expected; that operating costs, customer loss and business disruption (including, without limitation, difficulties in maintaining relationships with
employees, customers or suppliers) may be greater than expected following the proposed transaction or the public announcement of the proposed transaction; the retention of certain
key employees of Anadarko may be difficult; that Anadarko and Occidental are subject to intense competition and increased competition is expected in the future; general economic
conditions that are less favorable than expected. Additional risks that may affect Occidental’s results of operations and financial position appear in Part I, Item 1A “Risk Factors” of
Occidental’s Annual Report on Form 10-K for the year ended December 31, 2018, and in Occidental’s other filings with the U.S. Securities and Exchange Commission (“SEC”).

Because the factors referred to above could cause actual results or outcomes to differ materially from those expressed or implied in any forward-looking statements, you should not
place undue reliance on any such forward-looking statements. Further, any forward-looking statement speaks only as of the date of this presentation and, unless legally required,
Occidental does not undertake any obligation to update any forward-looking statement, as a result of new information, future events or otherwise.

                                                                                                                                                                                                 2
Cautionary Statements
No Offer or Solicitation
This presentation does not constitute an offer to sell or the solicitation of an offer to buy any securities or a solicitation of any vote or approval, nor shall there be any sale of securities in
any jurisdiction in which such offer, solicitation or sale would be unlawful prior to registration or qualification under the securities laws of any such jurisdiction. No offer of securities shall
be made except by means of a prospectus meeting the requirements of Section 10 of the Securities Act of 1933, as amended.

Additional Information and Where to Find It
This presentation relates to a proposal which Occidental has made for an acquisition of Anadarko. In furtherance of this proposal and subject to future developments, Occidental (and, if
a negotiated transaction is agreed, Anadarko) may file one or more registration statements, proxy statements, tender offer statements or other documents with the SEC. This
presentation is not a substitute for any proxy statement, registration statement, tender offer statement, prospectus or other document Occidental and/or Anadarko may file with the SEC
in connection with the proposed transactions.

INVESTORS AND SECURITY HOLDERS ARE URGED TO READ THE PROXY STATEMENT(S), REGISTRATION STATEMENT(S), TENDER OFFER STATEMENT, PROSPECTUS AND ANY OTHER
RELEVANT DOCUMENTS FILED WITH THE SEC CAREFULLY IN THEIR ENTIRETY IF AND WHEN THEY BECOME AVAILABLE BECAUSE THEY WILL CONTAIN IMPORTANT INFORMATION ABOUT
OCCIDENTAL, ANADARKO AND THE PROPOSED TRANSACTIONS. Any definitive proxy statement(s) or prospectus(es) (if and when available) will be mailed to stockholders of Occidental
and/or Anadarko, as applicable. Investors and security holders will be able to obtain copies of these documents (if and when available) and other documents filed with the SEC by
Occidental free of charge through the website maintained by the SEC at www.sec.gov. Copies of the documents filed by Occidental (if and when available) will also be made available free
of charge by accessing Occidental’s website at www.oxy.com.

Participants
This presentation is neither a solicitation of a proxy nor a substitute for any proxy statement or other filings that may be made with the SEC. Nonetheless, Occidental and its directors and
executive officers and other members of management and employees may be deemed to be participants in the solicitation of proxies in respect of the proposed transactions. Information
about Occidental’s executive officers and directors is available in Occidental’s Annual Report on Form 10-K for the year ended December 31, 2018, which was filed with the SEC on
February 21, 2019, and in its proxy statement for the 2019 Annual Meeting which was filed with the SEC on March 28, 2019. To the extent holdings of Occidental securities have
changed since the amounts printed in the proxy statement for the 2019 Annual Meeting, such changes have been or will be reflected on Statements of Change in Ownership on Form 4
filed with the SEC. Additional information regarding the interests of such potential participants will be included in one or more registration statements, proxy statements, tender offer
statements or other documents filed with the SEC if and when they become available. These documents (if and when available) may be obtained free of charge from the SEC’s website
http://www.sec.gov.

                                                                                                                                                                                                   3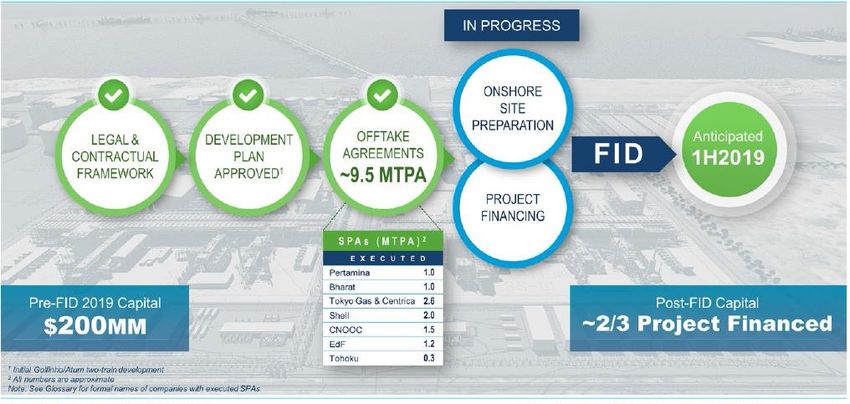
Cautionary Statements
Use of non-GAAP Financial Information
This presentation includes non-GAAP financial measures. Where available, reconciliations to comparable GAAP financial measures can be found on Occidental's website at
www.oxy.com. Occidental is unable to provide a reconciliation of non-GAAP financial measures contained in this presentation that are presented on a forward-looking basis because
Occidental is unable, without unreasonable efforts, to estimate and quantify the most directly comparable GAAP components, largely because predicting future operating results is
subject to many factors outside of Occidental's control and not readily predictable and that are not part of Occidental's routine operating activities, including various domestic and
international economic, regulatory, political and legal factors.

Cautionary Note to U.S. Investors
The Securities and Exchange Commission (SEC) permits oil and gas companies, in their filings with the SEC, to disclose only proved, probable and possible reserves. Any reserve
estimates provided in this presentation that are not specifically designated as being estimates of proved reserves may include "potential" reserves and/or other estimated reserves not
necessarily calculated in accordance with, or contemplated by, the SEC’s latest reserve reporting guidelines. U.S. investors are urged to consider closely the oil and gas disclosures in our
2018 Form 10-K and other reports and filings with the SEC. Copies are available from the SEC and through our website, www.oxy.com

                                                                                                                                                                                            4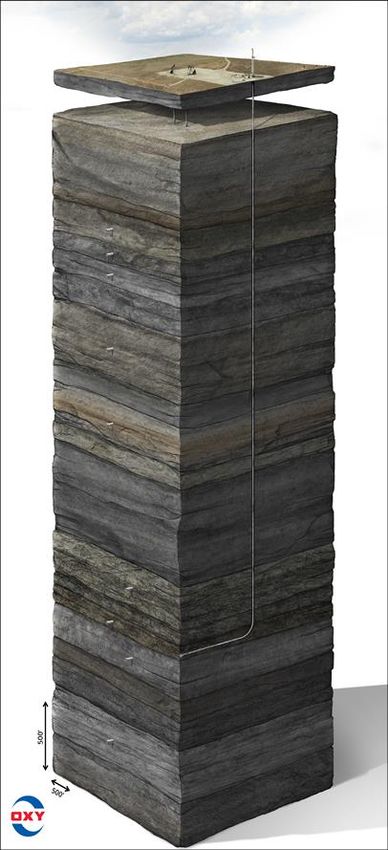
Compelling Strategic & Financial Merits
•     Highly accretive to CFPS and Free CFPS after dividends

•     $3.5 B free cash flow improvements through synergies and
      capital reduction

•     $10-15 B of planned portfolio optimization and free cash
      flow support rapid deleveraging

•     Oxy’s shale, Enhanced Oil Recovery (EOR), and major project
      expertise applied across complementary asset base

•     Oxy has operated in over 40 countries, most U.S. basins,
      Colorado, and the Gulf of Mexico in the last 30 years

•     Completely aligned with Oxy’s dividend + growth strategy

•    Moderating growth to 5% across a more diverse high return
     portfolio greatly enhances free cash generation and security

    Cash Flow Per Share calculated as cash flow from operations before working capital, less distributions attributable to non-
    controlling interest, divided by total diluted shares outstanding.
    Free Cash Flow Per Share calculated as cash flow from operations before working capital, less distributions attributable to
    non-controlling interest, capex and dividends, divided by total diluted shares outstanding.                                   5
Proposal Details
Oxy proposal to acquire Anadarko for $76.00 per share
–$38.00 cash and 0.6094 Oxy shares per Anadarko share
–Equity purchase price of $38 B
Structure and
–Total transaction value of $57 B (including Western Midstream debt and
Consideration
non-controlling interest)
Offer price in line with Anadarko 52-week high and Oxy offers made in 2018
and 2019
Pro Forma 71 % legacy Oxy shareholders
Ownership 29 % legacy Anadarko shareholders
Oxy will issue approximately 309 MM shares to Anadarko shareholders
Financing Committed financing in place for cash requirement of transaction
$10-15 B of planned asset sales in the next 12 – 24 months
6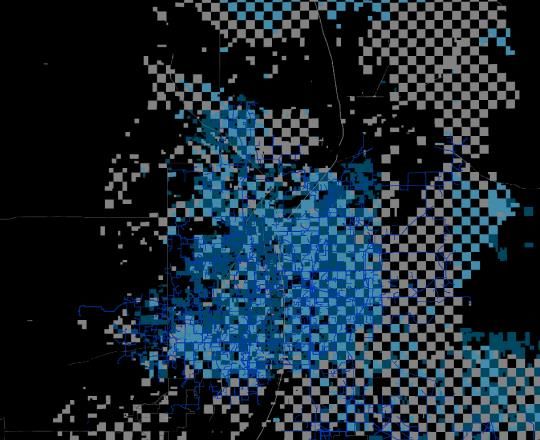
Substantial Scale                                 Industry-Leading Returns            Disciplined Growth

Oxy & Anadarko:                        >$100 B                                          20%+ 2021 PF                        $3.12/share
                                                                                                                              Growing Dividend and
                                                                                          CROCE
                                     Enterprise Value                                           (1)

Creating A High
                                   Attractive mix of U.S.
                                  unconventional, global                             Strong mix of stable free cash                   5%
                                                                                        flow, world-class growth,          Full-cycle production growth
Return Cash                    conventional, midstream and
                                     Chemical assets                                    and best in class assets               with low breakevens

Generating
Energy Company                           Best-In-Class Assets                                   Significant Synergies          Balance Sheet Strength

                                 Global Scale / Best Basins                                        $2.0 B                        Committed to
                                                                          (2)              Annual Synergies PLUS               maintaining strong
                                ~1.4 MMboe/d                                                                               Investment Grade
                                                                                                   $1.5 B                         credit ratings
                                                                                         Annual Capital Reduction

                                          Highly Accretive to CFPS and Free CFPS after Dividends
            Note: CROCE calculated as Net Income + After Tax Interest Expense + DD&A divided by Average Capital Employed
            (1) Assumes $60/bbl WTI, $65/bbl Brent, $3.00/MMBtu HHUB.
            (2) Based on Q4 2018 production.
                                                                                                                                                          7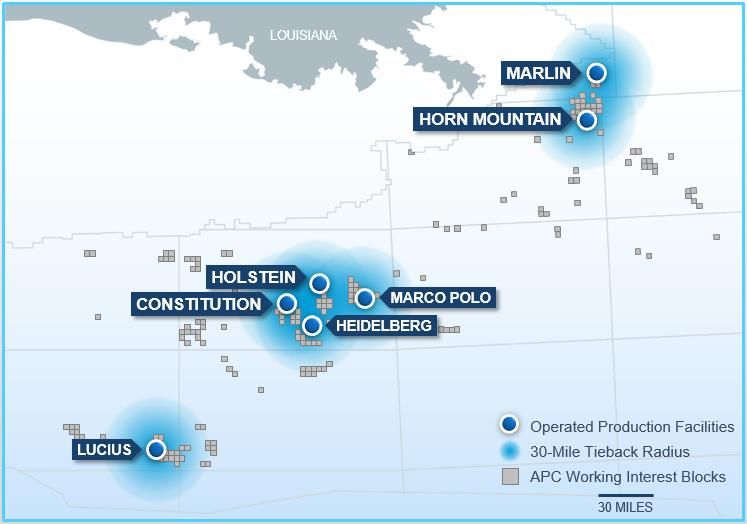
Premier, Complementary Global Asset Portfolio
#1 Producer in the Permian
#4 Producer in Gulf of Mexico
#1 in CO2 EOR Projects Leading Positions in Algeria and
Colombia
#1 Producer in the DJ Basin Top 3 Producer of PVC, Chlorine, and
Caustic Soda
#1 Producer in the Uinta Basin
Leading International Midstream
#1 Independent Producer in Oman Assets and MLP
#2 Producer in Ghana
Major Projects Expertise –
Al Hosn, Dolphin, Mukhaizna,
Ingleside Cracker and Terminal
8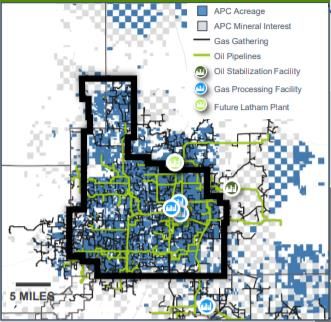
Well Positioned, Balanced Global Asset Portfolio
                                                                                                                                                                                          Q4 2018A Production (Mboe/d)

                                                                  Oman                         Qatar                           UAE                  Colombia                                                   1%
                                                         7                             8                          9                          10
                                                             30 year production        2nd Largest Oil Producer    30 Year Joint Venture     Llanos Norte Basin and
                                                              history in Oman             in Offshore Qatar            with ADNOC               Magdalena Basin                                     41%

                                                                                                                                                                       Oxy
                                                                                                                                                                                                            700
                                                                                                                                                                                                                     58%

                4   5

                3       2

                            1

                                    6
                                                                                                       14
                                                                                                                       8   9                                                                                      18%

                                                                                                                                                                       Anadarko
                                                                                       11                                  7
                                                                                  10                                                                                                                        701         15%
1     Permian                   2         DJ Basin                                                       13
                                                                                                                                                                                                    67%
 Q4 Oxy: 406 Mboe/d              Q4 2018 Production:                                                                                              Other Assets
2018 APC: 127 Mboe/d                272 Mboe/d                                                                                               Chemicals: >$1 B of FCF
                                                                                                                   12                        MLP
3   Uinta Basin                 4           PRB
Q4 2018 Production: 42
                                Emerging Resource Play
      Mboe/d

                                                                                                                                                                       Combined Company
5 Other US (Prod.)              6       Gulf of Mexico   11 Offshore Col.              12 Mozambique              13       Ghana             14      Algeria
 Q4 2018 Production:             Q4 2018 Production:         South American            Industry-leading project   Jubilee and TEN offshore    El Merk CPF, Ourhoud                                  34%              38%
     16 Mboe/d                      142 Mboe/d            deepwater exploration          in Mozambique LNG              developments            CPF and HBS CPF                                            1,401

                                                                                                                                                                                                           28%

                                                                                                                                                                                          Permian         Other US            International
                                                                                                                                                                                                                                              9
Enhances Oxy as The Leading Operator in the Permian
                    Combined Permian Position                                                                             Current Permian Net Production (Mboe/d)
                                                                                                                 600

                                                                                                                 500
                                                                                                                           24%

                                                                                                                 400
                                                     Midland Basin
                                                                                                                 300       76%

                                                                                                                 200

                                                                                                                 100

                                                                                                                     0

                                                                                                                                                                             EOG(3)
                                                                                                                                                                                      (3)
                                                                                                                                                             FANG(2)

                                                                                                                                                                                                  RDS
                                                                                                                                           CVX

                                                                                                                                                                                                                    LPI
                                                                                                                            PF OXY

                                                                                                                                                       PXD

                                                                                                                                                                       APA

                                                                                                                                                                                            XEC

                                                                                                                                                                                                        APC

                                                                                                                                                                                                              DVN
                                                                                                                                     OXY

                                                                                                                                                 CXO

                                                                                                                                                                                      XOM
                                             CBP                                                                • Adds thousands of drilling locations in “Core of the Core” Delaware
                                                                                                                  Basin
                                                                                                                • Oxy drilled 4% of the wells in the Permian, but accounts for 23 of the top
                                                                                                                  100 wells on a six-month cumulative oil production basis(1)
                         Delaware Basin                                                                         • Combined experience, technology and logistics expected to optimize
                                                                                                                  costs, productivity and profitability
    Oxy
                                                                                                                • EOR technology transfer to enhance value of shale
    Anadarko
                                                                                                                • The Permian business would be FCF positive at current prices
Source: Production data sourced from public filings.
(1) Source: IHS Enerdeq as of 4/17/2019, horizontals with 6 months oil production available since September 2017 and laterals >500 ft
(2) EGN acquisition closed on November 29, 2018. Includes two months of contribution from stand-alone EGN production, one month of contribution from Ajax production, and one month of contribution from recent
     tack-on acquisitions.                                                                                                                                                                                           10
(3) 2018A production
Significant Identified Synergies with Potential Upside
Expected Pre-Tax Annual Synergies and Capital Reduction ($ B)
$1.5 $3.5
Capital Synergies:
$0.9 B
$0.9
Opex/G&A Synergies:
$0.6 $1.1 B
$0.5 Capital Reduction:
$1.5 B
Permian Capital and Opex Savings Procurement & Supply Chain General Overhead & Infrastructure Moderate Growth Capital Reduction Synergies + Moderate Growth Capital
Domestic Capital Procurement & Supply General Overhead & Combined Growth Capital Synergies + Combined
Reduction
Operating Efficiency Chain Corporate Reduction Growth Capital Reduction
Domestic Capital and Operating Efficiency General Overhead & Corporate
• Transition to full, efficient development mode • Reduction in G&A and consolidation of corporate functions
• Over 10% anticipated improvement in Domestic drilling & completion costs • Single corporate governance & management team
• Estimate above does not include improved productivity through joint expertise • Application of combined company best practices and experience to all
Procurement & Supply Chain business units
• Integration and optimization of supply chain functions on a global platform
• Expected savings of 5% of combined annual capital and operating expenditures
Oxy has identified $2 B / year of primary synergies plus $1.5 B / year of capital reduction
11Top 100 Permian Basin Wells
6 Month Cumulative Oil Top 100 Wells Basin Leading Wells with Less Proppant
Oxy has 23% of the Best Wells, While Only Competitors use 27% more Proppant: >$500 M
Drilling 4% of Total Permian Wells Incremental Cost per Well and Increased
25 3,500 Parent/Child Risk
Competitors use an
3,000
20 average of 27% more
proppant/ft than Oxy
2,500
Avg Proppant Lbs/ft
15
2,000
Well Count
10 1,500
1,000
5
500
0 0
DVN
CXO
PE
PDC
Caza
OXY
FANG
WPX
REN
XOM
PXD
NBL
CVX
XEC
RDS
EOG
APA
APC
SM
Summit
PE
OXY
CXO
WPX
PDC
DVN
CVX
FANG
PXD
Caza
REN
XEC
XOM
RDS
NBL
APA
APC
EOG
Summit
SM
Source: IHS Enerdeq as of 4/17/2019, horizontals with 6 months oil production available since September 2017 and laterals >500 ft
Total Permian wells drilled during time-frame = 4,463 12Permian Expertise Applied Worldwide
Oman Example: Increased from 5
productive horizons to ~17 producing and
appraisal horizons
ARUMA
NATIH A NATIH A
Subsurface Characterization Expertise NATIH B UNC
NATIH C
• Apply learnings from U.S. Permian NATIH C
NATIH D
unconventional business NATIH D
NATIH E
SHUAIBA
• Awarded new blocks as a result of SHUAIBA
Sultanateoperational excellence
15,000 ft
15,000 ft
LEKHWAIR
of
HABSHAN
•
Oman Leveraged 2,600 square miles of recently DHRUMA
acquired 3D seismic JILH
> Enhanced regional understanding KHUFF / KAHMAH (K)
GHARIF
calibrated with extensive well database GHARIF
AMIN
> De-risk exploration of deeper horizons THULEILAT
AL SHOMOU
• Development planning and infrastructure MASIRAH BAY
optimization improves returns
not to scale not to scale
Proven Economic Under Evaluation 13Delivering Value Pro Forma Per Share Accretion(1)
• Continued
commitment to 2020
+25%
2021
+15%
return of capital
through growing
dividend and share >10X
>4X
repurchases
• Debt reduction via CFPS
(2)
Capex
(2)
Dividend FCF
Free CFPS CFPS
(2)
Capex
(2)
Dividend Free CFPS
FCF
portfolio optimization
and free cash flow • Cash flow accretive in first year
• Deliver 5%
• Current annualized cash flow increases ~$270 MM
production growth
per $1.00 / bbl increase in oil prices
(1) Stand alone figures based on FactSet consensus estimates and pro forma based on company estimates at $60 WTI, $65 Brent, and $3.00 Henry Hub.
(2) Assumes $1.0 B and $2.0 B of total synergies in 2020 and 2021, respectively. Also assumes capital reduction of $1.5 B in 2020 and 2021.
Note: Cash Flow Per Share calculated as cash flow from operations before working capital, less distributions attributable to non-controlling interest, divided by total diluted
shares outstanding.
Note: Free Cash Flow Per Share calculated as cash flow from operations before working capital, less distributions attributable to non-controlling interest, capex and 14
dividends, divided by total diluted shares outstanding.Appendix –
World Class
Upstream,
Midstream,
Chemicals,
and Low
Carbon
Businesses
15Oxy Consistently Returns Capital to Shareholders
5,000 Dividend Sustainable at $40 WTI $3.50
4,500 Consecutive Dividend Growth Since 2002 - 12% CAGR
$3.00
$ MM Returned to Shareholders
4,000 $33 B of Total Capital Returned Since 2002
Over 70% of Market Capitalization Returned to Shareholders $2.50
3,500
Strong Balance Sheet
Dividends per Share
3,000
$2.00
13% Annualized TSR since 2002
2,500
$1.50
2,000
1,500 $1.00
1,000
$0.50
500
- $0.00
2002 2003 2004 2005 2006 2007 2008 2009 2010 2011 2012 2013 2014 2015 2016 2017 2018
Dividends $ MM Share Repurchases $ MM Dividends per Share $
Note: 2013 dividend total adjusted to reflect that 1Q13 dividend was paid in 4Q12 16Oxy’s Recent Major Projects Delivered On-time and On-budget
Complex,
Major Project
Capability Domestic Projects
• Ingleside, TX – Ethylene Cracker
• Ingleside, TX – Oil Terminal
Industry-leading execution • Geismar, LA – 4CPe Plant
performance
Compared to industry
average of >20% capital
overruns and 9 months
delay
International Projects
• UAE – Al Hosn Gas
• Oman – Block 62 Gas Plant
17Leading Position in the DJ Basin
DJ Basin –
Free Cash DJ DEVELOPMENT AREA
Flow and 400,000+ net acres • 250+ Mboepd of production
Growth Oil Treating
Online
• Additional NPV uplift from mineral
interest ownership
Potential ~155
MBOPD Latham I Plant • 10+ years of remaining undrilled
Online by
Mid-Year 2019 inventory
Gas
Processing
• Integrated value chain via Western
Gas midstream assets
1.5+
Bcf/d3 • Acreage primarily located in
W EST ER N M IDSTR EAM O W N ED I N FR AS TR UC TURE
5 MILES
producer friendly areas
APC Acreage Oil Treating Facility
APC Mineral Interest Gas Plant
Pipelines (Oil and Gas)
Source: Anadarko April 2019 Investor Book 18Gulf of Mexico Position
Gulf of • Significant cash flow
generation
Mexico – • Infrastructure in place
Stable Free allows for ample tie-
Cash Flow back opportunities
• Three year outlook for
production 140
Mboe/d
• Rate of Return and
breakeven
competitive with best
U.S. onshore wells
Source: Anadarko April 2019 Investor Book 19International Portfolio
Middle East Colombia
• Strong performance record and technical • High margin opportunities
expertise • Acquired six blocks totaling 2 MM gross
• Recently awarded onshore Blocks 72, 51 acres and 700 MMboe of resources in
and 65 in Oman (3.7 MM gross acres) November 2018
• Recently awarded onshore Block ON-3 in
Abu Dhabi (1.5 MM gross acres)
Ghana(1) Algeria(1)
• High margin offshore oil development • PSA with Sonatrach, Eni and Maersk Oil
from TEN and Jubilee fields in Blocks 404A and 208
Diversified, Stable Production - Production of 390+ Mboe/d
Large Scale LNG Project Underway in Mozambique
1) Source: Anadarko April 2019 Investor Book 20Mozambique LNG Progressing Towards FID
Large Scale
LNG Project:
Mozambique
• Total Five-Year Net Investment(1) is ~$2.0 – $2.5 B
• Net Recoverable Resource 750 MMboe
• Liquification Capacity of 12.88 MTPA
• Competitive Onshore Costs of $600/tonne
Source: Anadarko April 2019 Investor Book
(1) Total five-year net investment is post-FID and net of expected project finance drawdowns 21OxyChem: Market Leading Position
OxyChem at a Glance Earnings Highlights
• Major global exporter of all core products • Positive cash flow
generation throughout cycle
• Top tier global producer in every product produced
• Integrated assets capture
> Largest merchant caustic soda seller in the world benefits of favorable market
> Largest VCM exporter in the world conditions
> 2nd largest chlor-alkali producer in the world • Global export portfolio
> Largest caustic potash producer in the world leverages low domestic
natural gas prices
• Recent growth projects delivered on time and on budget, increasing earnings base
• Only 4 time winner of the American Chemistry Councils Sustained Excellence Award
Market Overview
• Caustic soda supply-demand
OxyChem Pre-Tax Earnings (EBIT)1 balance is favorable
1500
• No major global capacity
expansions
$ MM
1000
• Core caustic demand driven
500 by Aluminum and Pulp and
Paper
0
4CPe Plant
• PVC demand continues to
2010 2011 2012 2013 2014 2015 2016 2017 2018 improve as global population
expands 22
1 OxyChem pre-tax earnings excluding special itemsLeading Midstream Assets and MLP NM
Selected Domestic Asset Overview
Oxy Midstream & Marketing Western Midstream
DJ Basin
• Domestic: • ~$600 MM of distributions from owned
• Permian EOR infrastructure MLP units
including 13 processing plants • Texas/New Mexico:
• Electric power co-generation plants • Gathering Pipelines
• Plains GP Holdings equity interest • Crude treating
• ~670 Mbbl/d Midland to Gulf Coast • Water gathering pipelines and SWD
oil capacity in 2019E/2020E wells Wamsutter Pipeline
• ~450 Mbbl/d of oil capacity rights • Gas processing
for Ingleside export terminal • Rockies:
through 2030 with extension
• Gathering Pipelines
possible
Andrews
• Treating and stabilization Delaware Basin Saddlehorn Pipeline
• International:
• Gas Processing NEW MEXICO
Eddy Lea
• Dolphin natural gas pipeline TEXAS
originating in Qatar • Other: Loving
Cushing
Winkler
• Al Hosn ultra sour gas processing • Saddlehorn Pipeline
• Pennsylvania Gathering Panola Pipeline
plant in the UAE
Ward
Houston/
Uplift from combined Midstream efforts in the Delaware and Culberson Mt. Belvieu
Marketing on the Gulf Coast
Reeves
Corpus
Christi
Improving Rock & Fluid Quality
10 miles
Gas Plant Anadarko Acreage
8V6E:
8V6E: 1157867_1.wor
1157867_1.wor
Source: Western Gas November 8th, 2018 Simplification Transaction Presentation and Western
Oil Treating Facility Pipeline (Oil, Gas and Water) Multiple takeaway options
Gas 2018 10-K
8V6E:
8V6E: 1157867_1.wor
1157867_1.wor
Jeff Davis
23
PecosOriginal Low Carbon Ventures Strategy Transaction Expands Mission
Scale and
Expertise to • Leverage Oxy's CO2 enhanced EOR • Apply Oxy’s Low Carbon Strategy to
Lead Energy infrastructure and expertise for
economic and social benefit
Anadarko’s asset base
into a Low • Sequestration of anthropogenic CO2 in
• Scale of combined company allows
strategy acceleration
Carbon Future oil reservoirs incentivized by 45Q tax
• Provide energy with lower carbon
credits
footprint
• Lower carbon footprint by utilizing
• Improve economics and extend oil
renewable power sources
reserve potential with unconventional
• Member Oil and Gas Climate Initiative EOR
• Expand utility of Tankless Facilities
24Appendix –
Permian
Performance
Enhancement
Potential not
Captured in
Synergies
25Continuous
Improvement in Oxy Permian Resources Hz Unconventional Well Performance
Permian Resources
Well Performance 250 147% Improvement since 2015
• Subsurface 25% Improvement from 2017 to 2018
Characterization 200 2018
Cumulative Mboe
• Data Analytics 150 2017
2016
• Innovative Well
Designs 100
2015
• Oxy Drilling
50
Dynamics
• Optimal 0
Development 0 90 180
Planning Days
Note: Data includes all horizontal Permian unconventional wells online in each year. 26Oxy’s Play Leading Delaware Basin Performance
Average 6 Month Cumulative Oil by Operator
160
140 Oxy’s Subsurface Knowledge, Data
120 Analytics and Execution Drive Basin
100 Leading Results
Cumulative Mbo
80
60 Top Delaware Basin Operator
40
• 74% better 6 month production than APC
20
0
MRO
PE
DVN
WPX
REN
OXY
CXO
PDC
MPC
XEC
FANG
XOM
NBL
CDEV
CVX
RDS
APC
APA
EOG
Source: IHS Enerdeq as of 4/17/2019, horizontals with 6 months oil production available since September 2017 and laterals >500 ft 27Appendix –
Other
28Unique Scale and Industry Leading Returns
Current Production (Mboe/d) Current Dividend Yield
4.9% 38.0% 58.0% 30.3%
3,277
% Permian of Current Production 5% 5%
5%
1,401
700 2%
579
Major Average PF Oxy Oxy Top 10 Independent PF Oxy Oxy Major Average Top 10 Independent
Average Average
2021E Free Cash Flow Yield(1)(2) 2021E CROCE(1)
10% 23% 22%
8%
18%
5%
4%
PF Oxy Major Average Oxy Top 10 Independent Top 10 Independent PF Oxy Major Average
Average Average
Source: Public filings and FactSet. (1) Based on select Wall Street Research, Factset consensus and management estimates. Analysis assumes run-rate
Note: CROCE calculated as Net Income + After Tax Interest Expense + DD&A divided by Average Capital Employed. synergies of $2.0 B and capital expenditure reduction of $1.5 B.
Note: Free Cash Flow Yield calculated as CFFO less capex divided by market capitalization.
Note: Majors include XOM, BP, TOT, CVX and RDS.
(2) Includes incremental transaction interest. 29You can also read