BMO GLOBAL METALS & MINING CONFERENCE - FEBRUARY 2020 - Evolution Mining
←
→
Page content transcription
If your browser does not render page correctly, please read the page content below
BMO GLOBAL METALS &
 MINING CONFERENCE
       F E B R U A RY 2 0 2 0
  JAKE KLEIN – EXECUTIVE CHAIRMAN
FORWARD LOOKING STATEMENT
These materials prepared by Evolution Mining Limited (or “the Company”) include forward looking statements. Often, but not always, forward looking statements can generally be identified by the use of
forward looking words such as “may”, “will”, “expect”, “intend”, “plan”, “estimate”, “anticipate”, “continue”, and “guidance”, or other similar words and may include, without limitation, statements regarding
plans, strategies and objectives of management, anticipated production or construction commencement dates and expected costs or production outputs.

Forward looking statements inherently involve known and unknown risks, uncertainties and other factors that may cause the Company’s actual results, performance and achievements to differ materially
from any future results, performance or achievements. Relevant factors may include, but are not limited to, changes in commodity prices, foreign exchange fluctuations and general economic conditions,
increased costs and demand for production inputs, the speculative nature of exploration and project development, including the risks of obtaining necessary licenses and permits and diminishing quantities
or grades of reserves, political and social risks, changes to the regulatory framework within which the Company operates or may in the future operate, environmental conditions including extreme weather
conditions, recruitment and retention of personnel, industrial relations issues and litigation.

Forward looking statements are based on the Company and its management’s good faith assumptions relating to the financial, market, regulatory and other relevant environments that will exist and affect
the Company’s business and operations in the future. The Company does not give any assurance that the assumptions on which forward looking statements are based will prove to be correct, or that the
Company’s business or operations will not be affected in any material manner by these or other factors not foreseen or foreseeable by the Company or management or beyond the Company’s control.

Although the Company attempts and has attempted to identify factors that would cause actual actions, events or results to differ materially from those disclosed in forward looking statements, there may be
other factors that could cause actual results, performance, achievements or events not to be as anticipated, estimated or intended, and many events are beyond the reasonable control of the Company.
Accordingly, readers are cautioned not to place undue reliance on forward looking statements. Forward looking statements in these materials speak only at the date of issue. Subject to any continuing
obligations under applicable law or any relevant stock exchange listing rules, in providing this information the Company does not undertake any obligation to publicly update or revise any of the forward
looking statements or to advise of any change in events, conditions or circumstances on which any such statement is based.

Non-IFRS Financial Information
The Company results are reported under International Financial Reporting Standards (IFRS). This presentation also includes non-IFRS information including EBITDA and Underlying Profit. The non-IFRS
information has not been subject to audit or review by the Company’s external auditor and should be used in addition to IFRS information.

All US dollar values in this presentation are calculated using an AUD:USD exchange rate of $0.67 unless stated otherwise

                                                                                                                                                                                                              2
EVOLUTION SNAPSHOT
 ASX code                                                                                                   EVN                         Mineral Resources(4)                                    15.2Moz
 Market capitalisation(1)                                                           US$5.2B / A$7.7B                                    Ore Reserves(4)                                          6.6Moz
 Average daily turnover(2)                                                           US$40M / A$60M                                     Reserve price assumption                              A$1,450/oz
 Net cash(3)                                                                   US$114M / A$170M                                         FY20 production guidance                                 725koz
                                                                                     Payout of 50% of                                                                         US$630 – US$660/oz
 Dividend policy                                                                                                                        FY20 AISC guidance
                                                                                       free cash flow                                                                           A$940 – A$990/oz

                                               Dividends                                                                                                     Evolution Register
                                               (cents per share)
                                                                                                                                                               Other
                                                                                                                                                          Asia 10%
                                                                                                                                                          5%
                                                                                              6
                                                                                4
                                                                                                                                               UK & Europe                        Australia
                                                                  3                                          7                                    12%                               44%
                                                   2                           3.5           3.5
                      1              1
                                                                  2
        1             1              1             1
      FY13          FY14          FY15           FY16          FY17       FY18              FY19        FY20 H1
                           Interim (cps)                           Final (cps)
                                                                                                                                                                                  Major shareholders
                                                                                                                                                   North America
(1)   Based on share price of A$4.51 per share on 19 February 2020                                                                                                                Van Eck 13.1%
(2)   Average daily share turnover for one month through to19 February 2020                                                                             29%
(3)   As at 31 December 2019
                                                                                                                                                                                  BlackRock 7.0%
(4)   Excludes Red Lake. Further information can be found on our website, www.evolutionmining.com.au or from the ASX release entitled                                             Fidelity 5.1%
      “Annual Mineral Resources and Ore Reserves Statement” on 12 February 2020                                                                                                                      3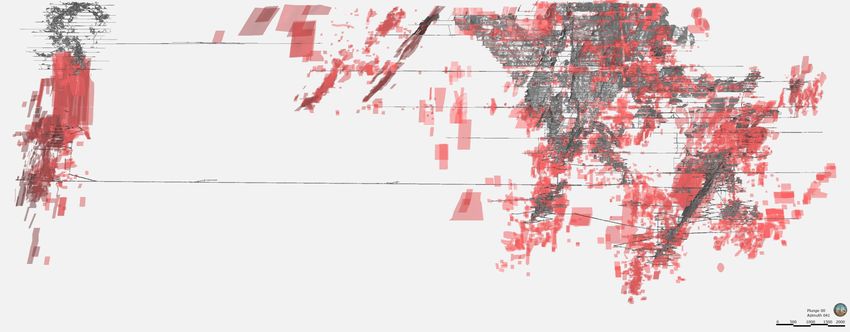
CLEAR AND CONSISTENT STRATEGY
   A portfolio of 6 to 8 assets generating superior returns with
              an average mine life of at least 10 years
 Build a reputation for sustainability, reliability and transparency

         Embed financial discipline across the business

An active pipeline of quality exploration and development projects
 Open to all quality gold, silver and copper-gold value accretive
                            investments

                                                                       Red Lake

                                            Mt Carlton
                Ernest Henry

                               Cracow          Mt Rawdon

                Mungari                       Cowal

                                                                                  4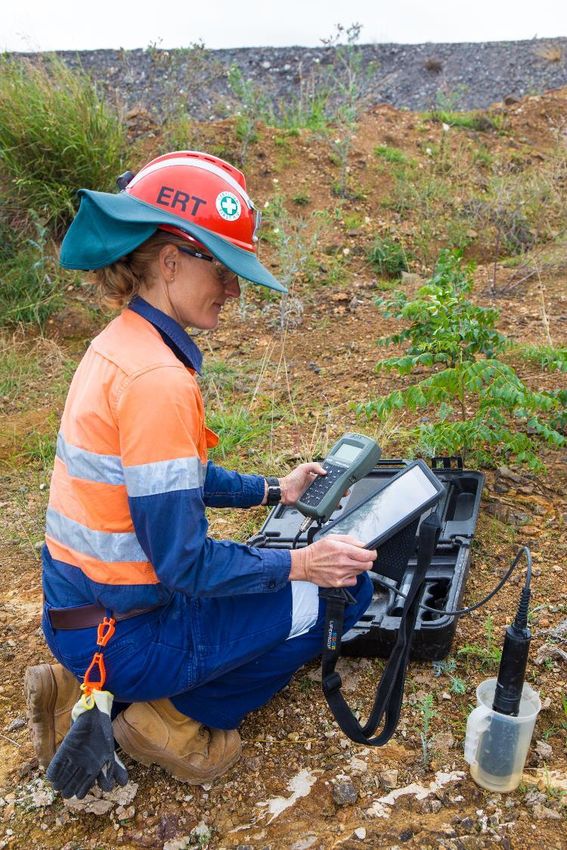
H1 FY20 HIGHLIGHTS

    Sector leading       Portfolio enhanced          Material improvement
financials supporting    through Red Lake             in mineral inventory
execution of strategy        acquisition             at high margin assets
▪ Record profit         ▪ Future cornerstone asset   ▪ 1.1 million ounces added
▪ Record cash flow      ▪ Turnaround commenced         at GRE46 with total Cowal
                                                       resources now at 8.6Moz
▪ Strong margins        ▪ Transaction due to
                          complete at end of March   ▪ New reserves at Ernest
▪ Debt free
                          2020                         Henry with the addition of
▪ Dividend doubled                                     three levels below
                                                       1200RL

                                                                                5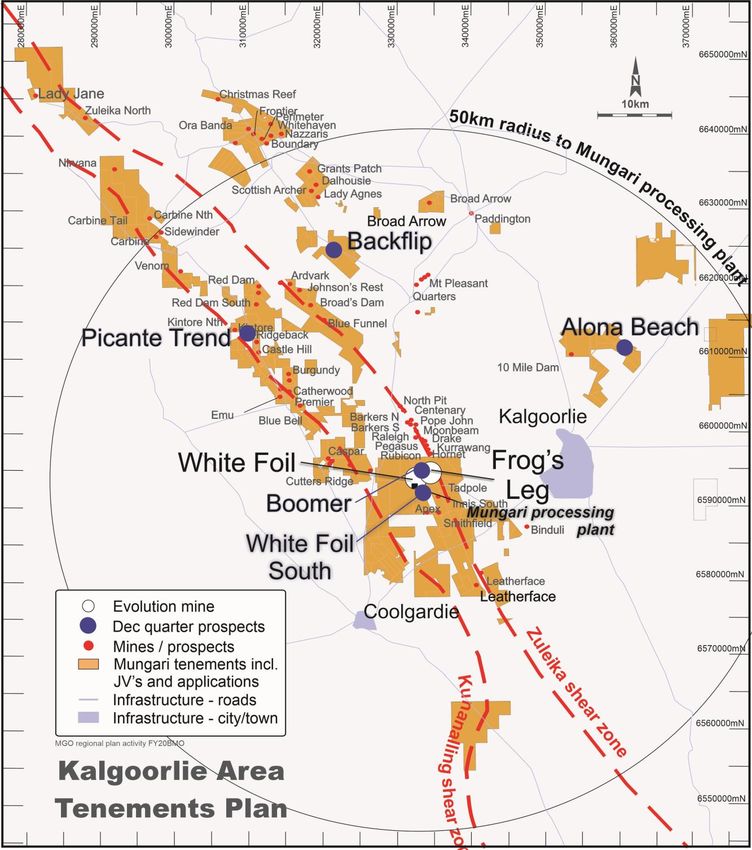
S U S TAI N AB I L I T Y P R I N C I P L E S

The objective of our sustainability efforts is to deliver long-term
stakeholder value through safe, low-cost gold production in an
environmentally and socially responsible manner

 Be an employer of choice          Demonstrate robust risk       Contribute positively to local,   Actively manage climate         Protect and enhance our
 attracting the most talented      management and safety         regional and national             related risks and               reputation as a trusted
 people and foster a safe,         leadership                    sustainability efforts by         opportunities including         partner and provide
 diverse and inclusive                                           achieving an outstanding          improving energy efficiency     community benefits that
 workplace                                                       level of environmental            and the responsible             endure beyond the life of our
                                                                 stewardship                       management of water             mines

 Advance the outcomes for                 Respect the human rights of                  Be transparent at all levels of           Relentlessly drive for
 indigenous peoples and                   all our stakeholders                         Corporate Governance,                     operational excellence
 protect their cultural heritage                                                       comply with applicable laws               through an innovative culture
                                                                                       and regulations and operate               and inspired people
                                                                                       at the highest standards of               delivering to plan
                                                                                       financial and ethical
                                                                                       behaviour

                           OUR VALUES:          SAFETY          EXCELLENCE                ACCOUNTABILITY                 RESPECT                                 6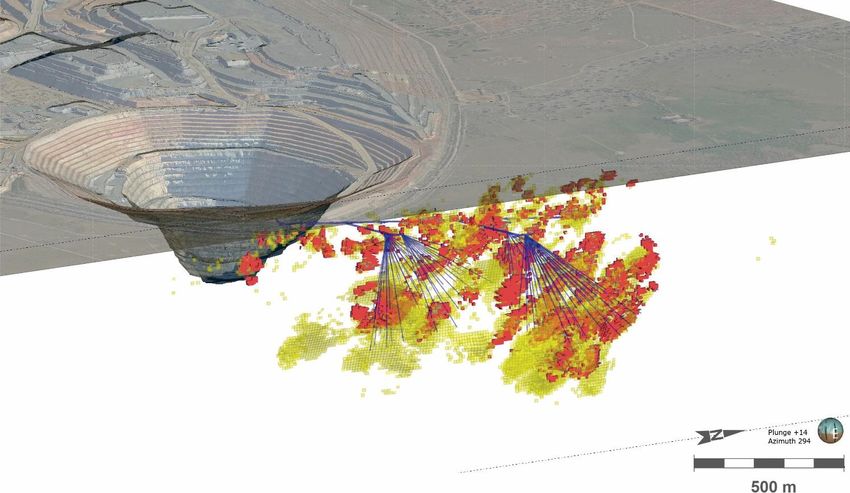
SUSTAINABILITY
◼   Improvement in safety performance
      ◼ TRIF reduced to 8.4 from recent peak of 9.3

◼   Inclusion in Dow Jones Sustainability
    Index Australia
       ◼ One of only two ASX listed gold miners

◼   Bushfires and drought assistance
      ◼ Donation of A$3M and ongoing support from Evolution

        volunteers
◼   Shared Value Projects
      ◼ 11 projects approved in last 18 months to provide enduring

        benefits to our communities
◼   Diversity of our future leaders
      ◼ Two-thirds of 2020 graduate intake are female
                                                                                Group safety performance (TRIF)
◼   Elevating Sustainability across our business                                                    9.3
      ◼ Dedicated position on Leadership Team                                          8.3                        8.4
                                                                        7.8
      ◼ Fiona Murfitt, GM Sustainability, commenced in January 2020

                                                                      FY19 Q3        FY19 Q4      FY20 Q1     FY20 Q2
                                                                                                                  7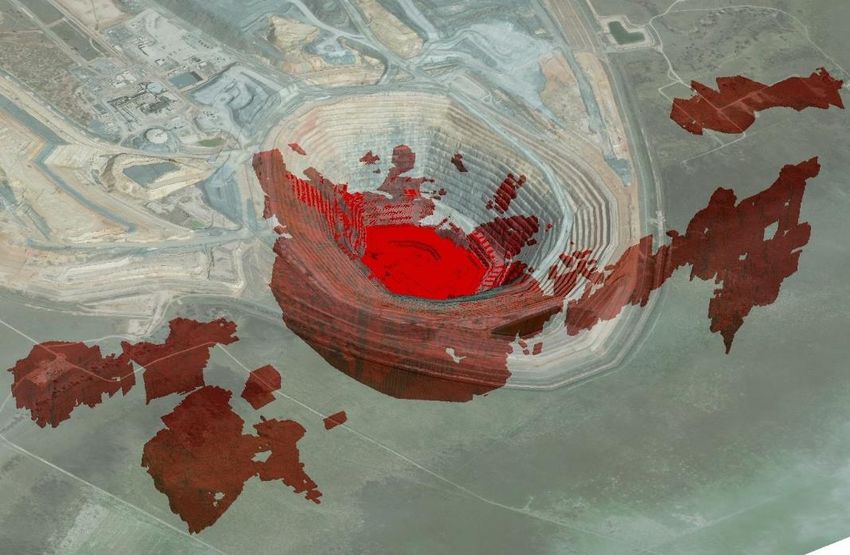
COWAL WATER SECURITY
Executing a water security plan to mitigate
drought risk with the objective of long-term
self sufficiency
◼   Second pipeline across Lake Cowal
    commissioned
      ◼ Pumping capacity increased by ~40%
                                                        Risk of potential water related
◼   Three additional bores in Eastern Saline Bore         impact on production has
    Field                                                          subsided
      ◼ Increases extraction of saline water by

         June 2020                                     Heavy rainfall recorded at Cowal
◼   Additional bore fields identified to further de-     operation in early February
    risk supply
                                                         Wyangala Dam level rising
◼   Increased focus on recycled water with re-use
    up to 50%
                                                             Lachlan River rising
◼   Low reliance on surface fresh water
      ◼ Less than 20% of daily water requirement

                                                                                          8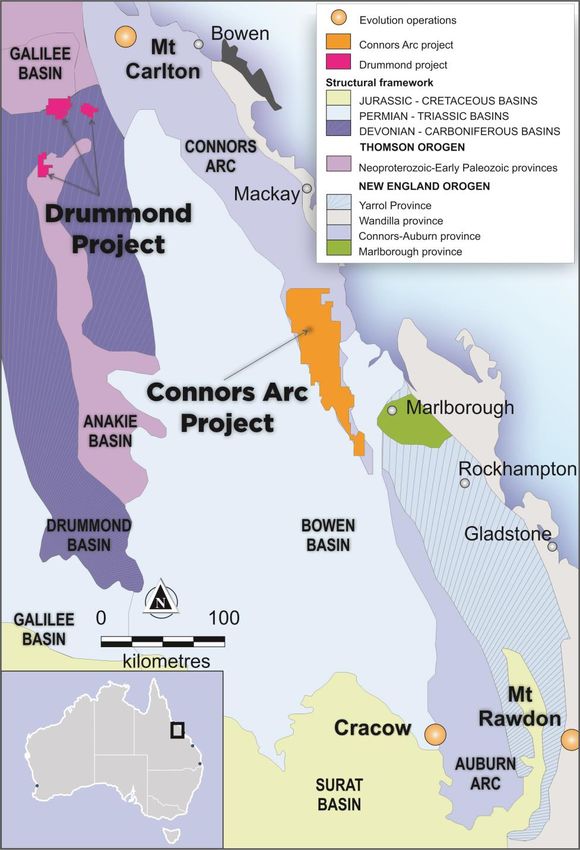
FY20 HALF-YEAR FINANCIAL HIGHLIGHTS
             FINANCIAL HIGHLIGHTS
 Record underlying net       Record                Earnings
    profit after tax         EBITDA                per share
   62% to A$149.1M        23% to A$441.2M        61% to 8.7cps

   Mine operating            Net mine            Record Group
     cash flow              cash flow              cash flow
   32% to A$511.8M        48% to A$351.8M       119% to A$242.4M

   Doubled interim           Debt free        Red Lake transaction
  dividend to 7.0cps     A$300M debt repaid       funds fully
      fully franked         in half-year          committed
QUALITY PORTFOLIO
◼   Evolution is among the highest margin producers of the top ten gold miners in the Van Eck Gold Miners Index

                                                                     All-in Sustaining Cost (US$/oz)
                                                                                                                                             983                995        1,012
                                                                                                       938                966
                                              880                894                897

                            713

         564
        Kirkland

                                                                                     Gold Fields

                                                                                                                                              Kinross
                                                                                                      Agnico

                                                                                                                                                               Northern
                              Evolution

                                                                                                                                                                           Anglogold
                                               Newcrest

                                                                                                                           Newmont
                             Evolution

                                                                                                      Eagle
                                                                  Barrick

                                                                                                                                                                            Ashanti
         Lake

                                                                                                                                                                 Star
                                                            ASX primary listing                             Non-ASX primary listing

               Source: Company filings
               1. AISC reported for December 2019 half-year (six months) for ASX listed companies
               2. AISC reported for 2019 calendar year (12 months) for non ASX listed companies. Anglogold Ashanti AISC reported for 2019 YTD to September (nine months)
               3. US dollar AISC for ASX listed companies calculated using the average Dec 2019 half-year AUD:USD exchange rate of 0.6846
                                                                                                                                                                                       10
H1 FY20 Mine Cash Flow (A$M)
GROUP CASH FLOW 300
512
600
250 500
210
200 400
135
◼ Since July 2015 150 300
100 200
◼ Operating cash flow: A$3.4B 142 43 49 46 352
129 28
50 100
41
◼ Net mine cash flow: A$2.3B - -7
18 30
0
Cowal Ernest Mt Carlton Mungari Mt Rawdon Cracow EVN Group
-50 -100
◼ Free cash flow: A$1.7B Henry
Net Mine Cashflow Mine Capex Operating Cashflow
◼ Debt repaid: A$1.1B
◼ Dividends declared: A$550M
Asset Payback
◼ Strong net cash flow reflected in portion of
assets repaid
100% 100% 100% 100%
88%
◼ Investing in future production 79% 76% 72%
◼ Major capital at Cowal and Red Lake 59%
47% 45%
◼ Discovery expenditure and Cowal, Red 38%
Lake, Mungari and greenfields
Cowal Mungari Mt Carlton Mt Rawdon Cracow Ernest Henry
FY19 H1 FY20 H1
11SECTOR LEADING DIVIDENDS
◼ Committed to investing in growth and returning funds to shareholders
◼ Dividend policy payout of 50% of free cash flow
225 Dividends (US$ per ounce produced)
Six months to December 2019
95 93
78
65
54
40
25
7
0
Evolution Northern Star Agnico Eagle
Evolution Barrick Newmont Newcrest Kirkland Lake Gold Fields Anglogold Kinross
Goldcorp Ashanti
ASX primary listing Non-ASX primary listing
Source: Company filings
Notes: 1. Dividends declared for December 2019 half-year (6 months) for all companies
2. Anglogold Ashanti dividend calculated using the 2018 annual dividend
3. Average AUD:USD exchange rate for the half-year of 0.6846
12COWAL E46 Open Pit
▪ Sustainable, reliable, low cost asset
▪ Production objective >300koz p.a. E42 Open Pit GRE46 Dalwhinnie
▪ Float Tails Leach circuit Underground
▪ Plant expansion
▪ 2.5Moz underground resource
E41 Open Pits
▪ Underground mine Pre-Feasibility Study Cowal December 2019
Resources 8.6Moz Au
▪ Stage H cutback Reserves 3.6Moz Au
▪ Integrated Waste Landform
PERFORMANCE SINCE JULY 2015 ACQUISITION
Gold production 1.2Moz
FY20 GUIDANCE Net mine cash flow A$660M
Gold production 255 – 265koz Mining permit extended by 8 years 2024 → 2032
AISC A$930 – A$980/oz Ore Reserves increased by 3.4Moz(1) 1.6Moz → 3.6Moz gold
Plant throughput increased by ~1.8Mtpa 7.2Mtpa → 9.0Mtpa
Improved recoveries from float tails leach +6%
(1) Prior to mining depletion of 1.4Moz
Discovery of a new ore body Dalwhinnie lodeGRE46 DALWHINNIE UNDERGROUND
◼ GRE46 Dalwhinnie underground resource Cowal GRE46 Dalwhinnie underground
increased by 77% from 1.4Moz to 2.5Moz Mineral Resource increased by 77% to 2.5Moz
◼ Maiden underground Ore Reserve to be
declared in CY2020
◼ Mineralisation remains open at depth and
along strike
◼ Underground mine Pre-Feasibility Study
commenced
◼ Base case mining rates of 1Mtpa with upside
cases being assessed
All Mineral Resources and Ore Reserves referenced are extracted from the report entitled “Annual Section of Cowal GRE46 underground area. Red shows the outline of the December 2018
Mineral Resources and Ore Reserves Statement” released to the ASX on 12 February 2020 and mineable shape optimiser (MSO) outlines and yellow shows the December 2019 MSO
available to view at evolutionmining.com.au. The company confirms that the form and context in which
the Competent Persons’ findings are presented have not been materially modified from the original outlines. Planned drilling from the exploration decline is shown in blue
market announcement
December 2019 Underground Mineral Resource
30Mt grading 2.6g/t for 2.5Moz Au
14ERNEST HENRY
▪ History of reliable operational delivery
▪ Evolution’s interest generated free cash flow of
A$129M in the six months to December 2019
◼ Early addition of three new sub-levels to reserves
◼ 18,000m drill program planned for 2020 calendar
year targets extensions to resources and reserves
below the 1200mRL
◼ Evolution’s interest moves to 49% of all gold,
copper and silver below the 1200mRL
Dec qtr drilling campaign
FY20 GUIDANCE
Gold production1 87.5 – 92.5koz
Copper production1 19 – 21kt
AISC A$(590) – A$(540)/oz Cross section of Ernest Henry looking east
at 1200mRL drill platform
1. Metal production is reported as Evolution’s share of payable production
15RED LAKE ACQUISITION
CANADA
▪ Evolution implementing plans to transform
Red Lake into a cornerstone asset
▪ High grade, long life, underground gold
mine in Canada’s most prolific gold district
▪ Under-capitalised asset with significant
turnaround opportunity
▪ Outstanding exploration potential with
Red Lake gold mine
historical head grades of +20g/t Au Ontario
▪ Three-year turnaround plan underway with
Evolution committed to US$100 million
capital investment in existing operations Turnaround plan targeting:
and US$50 million exploration spend
Annual production >200koz
AISCRED LAKE UPDATE
Exploration Mining Processing
▪ Immense exploration potential a ▪ Mining plan will focus on large ▪ Improve reliability and
key driver of the acquisition high productivity zones utilisation of Campbell Mill
▪ Drilling has commenced with 5 ▪ Commenced work to return to ▪ Red Lake Mill to be put on care
rigs focused on Cochenour and historical ore production rates and maintenance; available for
Red Lake by increasing development batch treating as required
rates to 1,000m per month
▪ Ramping up to 6 – 8 rigs by ▪ Upgrade oxygen plant and
April 2020 ▪ Decommission excess fixed thickener feedwell to reduce
assets and mobile equipment processing consumable costs
▪ Initially targeting near mine
resource definition and ▪ Invest in larger scale mining
extensional drilling fleet
17
17RED LAKE PLANNED DRILLING
Cochenour Shaft Reid Shaft #3 Shaft Surface
UPPER RED
CAMPBELL LAKE
-1000mbs
High Speed Tram (HST)
-2000mbs
▪ Drilling has commenced with 5 rigs
focused on Cochenour and Red Lake
COCHENOUR ▪ FY21 resource definition and discovery
budget of A$20 – 25 million for LOWER RED
1000m LAKE
approximately 100,000 drill metres
Composite Long Section
Planned resource definition Mineralisation Existing mine
and discovery drilling wireframes development 18SUMMARY
Sector leading Portfolio enhanced Material improvement
financials supporting through Red Lake in mineral inventory
execution of strategy acquisition at high margin assets
19FY20 GUIDANCE: PRODUCTION, COSTS & CAPITAL
All-in Sustaining
Gold production1 Major Capital
FY20 Guidance Sustaining Cost2 Capital
(oz) (A$/oz) (A$M) (A$M)
Cowal 255,000 – 265,000 930 – 980 25 – 35 130 – 155
Mungari 115,000 – 125,000 1,230 – 1,280 10 – 15 10 – 15
Mt Carlton3 70,000 – 75,000 1,150 – 1,225 20 – 25 50 – 60
Mt Rawdon4 80,000 – 85,000 1,490 – 1,540 10 – 15 10 – 12.5
Cracow 82,500 – 87,500 1,200 – 1,250 15 – 20 10 – 12.5
Ernest Henry 87,500 – 92,500 (590) – (540) 10 – 15
Corporate 45 – 50 0-5
Group Around 725,000 940 – 990 90 – 130 195 – 235
Ernest Henry (Cu t) 19,000 – 21,000 Towards Bottom Towards Top
Mt Carlton (Cu t) 2,000 – 3,000
1. Original Group production guidance: 725,000 – 775,000 ounces
2. Original Group AISC guidance of A$890- A$940/oz was based on a gold price of A$1,750/oz and copper price of A$8,800/t
Group AISC guidance was revised A$50/oz higher to A$940 – A$990/oz on 15 October 2019 comprising of:
- A$20/oz increase due to revised metal price assumptions of gold A$2,100/oz and copper A$8,400/t which impact royalties and by-product credits
- A$30/oz increase due to pit wall stability issues at Mt Rawdon requiring a revised mine plan
3. Mt Carlton original guidance was 95,000 – 105,000 ounces at an AISC of A$800 – A$850/oz
4. Mt Rawdon original guidance was 90,000 – 100,000 ounces at an AISC of A$1,210 – A$1,260/ozFY20 GUIDANCE - CAPITAL
Major project capital items
◼ Cowal: Sustaining
◼ Stage H cut-back A$75 – 85M Major Capital
FY20 Guidance Capital
◼ IWL A$35 – 40M (A$M)
(A$M)
◼ Process plant projects & Other A$ 5 – 10M
◼ Underground Design and PFS Study A$15 – 20M Cowal 25 – 35 130 – 155
◼ Mt Carlton:
◼ Underground development A$30 – 35M Mungari 10 – 15 10 – 15
◼ Open pit mine development A$15 – 20M Mt Carlton 20 – 25 50 – 60
◼ Plant Optimisation A$ 5 – 10M
Mt Rawdon 10 – 15 10 – 12.5
◼ Mungari:
◼ Mine Development A$ 7 – 10M Cracow 15 – 20 10 – 12.5
◼ Cutters Ridge A$ 3 – 5M
Ernest Henry 10 – 15
◼ Mt Rawdon:
◼ Mine Development & LOM Buttress A$10 – 12.5M Corporate 0-5
◼ Cracow: Group 90 - 130 195 – 235
◼ Underground development A$10 – 12.5M
Towards Bottom Towards Top
22EVOLUTION 2019 GOLD MINERAL RESOURCES
Gold Measured Indicated Inferred Total Resource
Gold Gold Gold Gold Gold Gold Gold Gold CP3
Tonnes Tonnes Tonnes Tonnes
Project Type Cut-Off Grade Metal Grade Metal Grade Metal Grade Metal
(Mt) (Mt) (Mt) (Mt)
(g/t) (koz) (g/t) (koz) (g/t) (koz) (g/t) (koz)
Cowal Open pit 0.35 - - - 164.15 0.87 4,602 21.09 0.92 626 185.25 0.88 5,229
Cowal Stockpile 42.79 0.63 860 - - - - - - 42.79 0.63 860
Cowal UG 1.5 - - - 6.79 3.03 661 22.93 2.50 1,842 29.72 2.62 2,502
Cowal Total 42.79 0.63 860 170.94 0.96 5,263 44.02 1.74 2,468 257.76 1.04 8,591 1
Cracow1 Total 2.2 0.33 7.99 84 0.74 5.88 141 1.48 2.54 121 2.55 4.21 345 2
Mt Carlton Open pit 0.35 - - - 3.55 2.04 233 0.40 1.12 14 3.96 1.90 247
Mt Carlton Stockpile 0.35 1.06 12 4.84 0.54 84 - - - 5.19 0.58 96
Mt Carlton UG 2.55 - - - 0.45 4.83 70 0.04 3.28 5 0.50 4.70 75
Mt Carlton Total 0.35 1.06 12 8.85 1.36 387 0.45 1.33 19 9.64 1.35 418 3
Mt Rawdon1 Total 0.17 6.44 0.37 76 36.86 0.65 769 12.93 0.52 217 56.23 0.59 1,062 4
Mungari1 Open pit 0.5 0.58 1.30 24 38.38 1.22 1,508 6.49 1.52 317 45.45 1.27 1,849
Mungari UG 1.8 0.53 5.34 91 1.77 3.28 187 3.17 2.77 283 5.47 3.18 560
Mungari1 Total 1.11 3.22 115 40.15 1.31 1,695 9.66 1.93 600 50.92 1.47 2,409 5
Ernest Henry2 Total 0.9 7.70 0.65 161 47.90 0.62 950 9.00 0.61 177 64.60 0.62 1,288 6
Marsden Total 0.2 - - - 119.83 0.27 1,031 3.14 0.22 22 122.97 0.27 1,053 7
Total 58.72 0.69 1,307 425.27 0.75 10,236 80.68 1.40 3,624 564.67 0.84 15,167
Data is reported to significant figures to reflect appropriate precision and may not sum precisely due to rounding
Mineral Resources are reported inclusive of Ore Reserves.
1 Includes stockpiles 2 Ernest Henry Operation cut-off 0.9% CuEq
3Group Mineral Resources Competent Person (CP) Notes refer to 1. James Biggam; 2. Michael Smith; 3. Chris Wilson; 4. Tim Murphy; 5. Andrew Engelbrecht; 6. Colin Stelzer (Glencore); 7. Michael Andrew
Full details of the Ernest Henry Mineral Resources and Ore Reserves are provided in the report entitled “Glencore Resources and Reserves as at 31 December 2019” released 4 February 2020 and available to view at www.glencore.com. The Company confirms that it is not
aware of any new information or data that materially affects the information included in the Reports and that all material assumptions and parameters underpinning the estimates in the Reports continue to apply and have not materially changed. The Company confirms that the
form and context in which the Competent Persons’ findings are presented have not been materially modified from the Reports. Evolution Mining has an economic interest earning rights to 100% of the revenue from future gold production and 30% of future copper and silver
produced from an agreed area, and 49% of future gold, copper and silver produced from the Ernest Henry Resource outside the agreed area. The Ernest Henry Resource is reported here on the basis of economic interest and not the entire mine resource. The above reported
figures constitute 79.5% of the total Ernest Henry gold resource. 23EVOLUTION 2019 GOLD ORE RESERVES
Gold Proved Probable Total Reserve
Gold Grade Gold Metal Gold Grade Gold Metal Tonnes Gold Grade Gold Metal CP3
Project Type Cut-Off Tonnes (Mt) Tonnes (Mt)
(g/t) (koz) (g/t) (koz) (Mt) (g/t) (koz)
Cowal Open pit 0.45 - - - 89.43 0.96 2,773 89.43 0.96 2,773 1
Cowal Stockpile 42.79 0.63 860 - - - 42.79 0.63 860
Cowal Total 42.79 0.63 860 89.43 0.96 2,773 132.22 0.85 3,634 1
Cracow1 Underground 3.1 0.39 5.95 74 0.21 5.67 38 0.61 5.78 114 2
Mt Carlton Open pit 1.8 - - - 1.51 3.58 174 1.51 3.58 174 3
Mt Carlton Stockpile 0.35 1.06 12 4.84 0.54 84 5.19 0.58 96 3
Mt Carlton Underground 3.2 - - - 0.36 3.44 40 0.36 3.44 40 4
Mt Carlton Total 0.35 1.06 12 6.71 1.38 299 7.06 1.37 311
Mt Rawdon1 Open pit 0.24 3.73 0.45 53 20.92 0.72 485 24.65 0.68 538 5
Mungari1 Open pit 0.75 0.58 1.28 24 10.55 1.40 476 11.12 1.40 500
Mungari Underground 2.9 0.43 4.05 56 0.07 5.35 12 0.50 4.25 68
Mungari1 Total 1.01 2.47 80 10.62 1.43 489 11.63 1.52 568 6
Ernest Henry2 Underground 0.9 6.10 0.80 156 33.40 0.47 505 39.40 0.52 660 7
Marsden Open pit 0.3 - - - 65.17 0.39 817 65.17 0.39 817 4
Total 54.37 0.71 1,235 226 0.74 5,406 281 0.74 6,642
Data is reported to significant figures to reflect appropriate precision and may not sum precisely due to rounding
1 Includes stockpiles
2 Ernest Henry Operation cut-off 0.9% CuEq
3Group Ore Reserve Competent Person (CP) Notes refer to 1. Ryan Kare; 2. Matt Gray; 3. Sam Patterson; 4. Anton Kruger; 5. Mark Boon; 6. Ken Larwood; 7. Mike Corbett (Glencore);
Full details of the Ernest Henry Mineral Resources and Ore Reserves are provided in the report entitled “Glencore Resources and Reserves as at 31 December 2019” released 4 February 2020 and available to view at www.glencore.com. The Company confirms that
it is not aware of any new information or data that materially affects the information included in the Reports and that all material assumptions and parameters underpinning the estimates in the Reports continue to apply and have not materially changed. The Company
confirms that the form and context in which the Competent Persons’ findings are presented have not been materially modified from the Reports. Evolution Mining has an economic interest earning rights to 100% of the revenue from future gold production and 30% of
future copper and silver produced from an agreed life of mine area, and 49% of future gold, copper and silver produced from the Ernest Henry Resource outside the agreed area. Ernest Henry Reserve is reported here on the basis of economic interest and not the
entire mine reserve. The above reported figures constitute 89.5 % of the total Ernest Henry gold reserve.
24EVOLUTION 2019 COPPER RESERVES & RESOURCES
Group Copper Mineral Resource Statement
Copper Measured Indicated Inferred Total Resource
Copper Copper Copper Copper
Cut- Tonnes Copper Tonnes Copper Tonnes Copper Tonnes Copper CP3
Project Type Metal Metal Metal Metal
Off (Mt) Grade (%) (Mt) Grade (%) (Mt) Grade (%) (Mt) Grade (%)
(kt) (kt) (kt) (kt)
Marsden Total 0.2 - - - 119.83 0.46 553 3.14 0.24 7 122.97 0.46 560 1
ErnestHenry2 Total 0.9 2.60 1.17 30 20.90 1.16 243 7.10 1.16 83 30.60 1.16 356 2
Mt Carlton1 Open pit 0.35 0.35 0.21 1 3.55 0.36 13 0.40 0.18 1 4.30 0.33 14
Mt Carlton Underground 2.55 - - - 0.45 0.77 3 0.04 0.53 0 0.50 0.75 4
Mt Carlton1 Total 0.35 0.21 1 4.01 0.41 16 0.45 0.21 1 4.80 0.38 18 3
Total 2.95 1.04 31 144.74 0.56 812 10.69 0.85 91 158.37 0.59 934
Group Copper Ore Reserve Statement
Copper Proved Probable Total Reserve
Copper Copper Copper Copper Copper Copper
Cut- CP3
Project Type Tonnes (Mt) Grade Metal Tonnes (Mt) Grade Metal Tonnes (Mt) Grade Metal
Off
(%) (kt) (%) (kt) (%) (kt)
Marsden 0.3 - - - 65.17 0.57 371 65.17 0.57 371 1
Ernest Henry2 Total 0.9 1.80 1.50 27 13.20 0.93 123 15.10 1.00 150 2
Mt Carlton1 Open pit 1.8 0.35 0.21 1 1.51 0.61 9 1.86 0.54 10 3
Mt Carlton Underground 3.2 - - - 0.36 0.39 1 0.36 0.39 1 1
Mt Carlton1 Total 0.35 0.21 1 1.88 0.57 11 2.22 0.51 11
Total 2.15 1.29 28 80.25 0.63 505 82.49 0.65 532
Group Mineral Resources Competent Person3 (CP) Notes refer to: 1. Michael Andrew; 2. Colin Stelzer (Glencore); 3 Chris Wilson. Group Ore Reserve Competent Person3 (CP) Notes refer to: 1. Anton Kruger; 2. Mike Corbett (Glencore). 3. Sam Patterson;
The following notes relate to the tables above. Data is reported to significant figures to reflect appropriate precision and may not sum precisely due to rounding. Mineral Resources are reported inclusive of Ore Reserves. Evolution cut-off grades are reported in g/t gold.
1 Includes stockpiles 2 Ernest Henry Operation cut-off 0.9% CuEq
Full details of the Ernest Henry Mineral Resources and Ore Reserves are provided in the report entitled “Glencore Resources and Reserves as at 31 December 2019” released 4 February 2020 and available to view at www.glencore.com. The Company confirms that it is
not aware of any new information or data that materially affects the information included in the Report and that all material assumptions and parameters underpinning the estimates in the Report continue to apply and have not materially changed. The Company confirms
that the form and context in which the Competent Persons’ findings are presented have not been materially modified from the Reports. Evolution Mining has an economic interest earning rights to 100% of the revenue from future gold production and 30% of future copper
and silver produced from an agreed life of mine area, and 49% of future gold, copper and silver produced from the Ernest Henry Resource outside the agreed area. Ernest Henry Reserve is reported here on the basis of economic interest and not the entire mine reserve.
The above reported figures constitute 37.4% of the total Ernest Henry copper resource and 33.9 % of the total
Ernest Henry copper reserve.
25H1 FY20 EBITDA MARGINS
Group EBITDA Margin (%)
◼ High margin at long life assets of Cowal (59%) and Ernest Henry (69%)
FY20 H1
◼ Continued improvement at Mungari and Cracow 49%
FY19 48%
◼ Margin at Mt Carlton and Mt Rawdon expected to improve in second half
(1)
FY18 53%
◼ Group margin consistently around 50%
(1)
FY17 49%
◼ Strong net cash generation by assets reflected in portion of asset repaid
FY16 46%
Site EBITDA Margin
FY19 H1 FY20 H1
Asset Payback
FY19 H1 FY20 H1
65% 69%
52% 59% 58%
45% 46%
54%
34% 40%
100%100% 100%100%
88%
31% 27% 59%
79% 76% 72%
47% 45%
38%
Cowal Mungari Mt Carlton Mt Rawdon Cracow Ernest
Cowal Ernest Henry Mt Carlton Mt Rawdon Mungari Cracow Henry
(1) FY18 excludes Edna May, FY17 excludes Pajingo
26H1 FY20 MINE OPERATING COSTS – KEY DRIVERS
◼ Operating costs being well controlled with heavy focus on top 7 cost categories
◼ Labour cost and royalties account for net change in operating costs
◼ Employee labour rates moved within the 3½% - 4½% guided range
◼ Other cost changes minimal and offset each other
◼ Still seeing input cost reduction opportunities in a number of consumables
(1)
Mine Operating Costs (A$M) FY20 H1 Key Cost Drivers (2)
5.2 0.6 2.3 386.1
2.6 0.5
7.9
371.6 (4.4) Other
(0.2) 20% Employee
Labour
27%
Diesel
5%
Reagents
Mine Employee Contract Maintenance Royalties Power Reagents Diesel Other Mine 5%
Operating Labour Labour Parts Operating Contract
Power
Costs - Costs - 7% Labour
December December 17%
2018 2019 Royalties Maintenance
8% Parts
11%
(1) Excludes Inventory Movements (FY19 H1 A$6.1M; FY20 H1 A$33.1M)
(2) Excludes Ernest Henry but includes Group Overheads and Discovery costs
27MUNGARI
▪ Strategic footprint in world-class gold district
▪ 10-year base load production platform
▪ Plant throughput increased to 2.0Mtpa
▪ Studies ongoing to optimise the Life of Mine plan to
maximise the 2.5Moz Mineral Resource base
▪ 19.9% interest in Tribune Resources
▪ Continued commitment to discovering high grade
ounces with FY20 exploration budget of A$15 – 20M
FY20 GUIDANCE
Gold production 115 – 125koz
AISC A$1,230 – A$1,280/oz
28QUEENSLAND OPERATIONS
FY20 GUIDANCE MT CARLTON CRACOW MT RAWDON
Gold production 70 – 75koz 82.5 – 87.5koz 80 – 85koz
A$1,150 – A$1,200 – A$1,490 –
AISC
A$1,225/oz A$1,250/oz A$1,540/oz
QUEENSLAND EXPLORATION
Drummond Exploration Project (Evolution earning 80%)
▪ Early-stage epithermal (low-sulphidation) vein project (520km2)
Connors Arc Exploration Project (Evolution 100%)
▪ Large land package (3,500km2) prospective for low (e.g. Cracow)
and high sulphidation (e.g. Mt Carlton) epithermal deposits
29TRANSFORMATION AND EFFECTIVENESS PIPELINE
Production Optimiser | Data Lake | Float Tails Leach | HIG Mill | Tele-remote
drilling | OLGA | Geo - Seismic data link | Visual Performance Centres –
Operating Collaboration Hub | Titan (excavator load monitoring) | Chrysos- Gamma
activated assay | Carbon Scout | HoloLens | Obzervr (AM App)
Development Projects Glycine Leaching | Ore Sorting | OEE | MiOps Fleet Management
Ore Pre-Benefication | Virtual Curtain | Production In hole tracking |
Trial Phase InSar monitoring | AI (geotech / geology, processing, asset
management)
Nano Filtration | Automation | Expanded Drone Usage |
Conceptual/Scoping Electric/Autonomous UG Equipment | Pump Hydro | Haulage
Alternatives | E-ISL | Imdex BlastDog technology
In Mine Recovery | Renewable Energy Options | CN
Resin Recovery | PGNAA | On Demand Ventilation |
Idea Seismic TSF Monitoring | Remote Fan Hanger | RedT
Energy Storage
Notes:
HIG – High intensity grinding mill. OLGA – On-line gold analyser. E-ISL denotes Electrokinetic in-situ leaching.. InSar denotes satellite monitoring of ground deformation, PGNAA denotes Prompt Gamma Neutron Activation
Analysis, BlastDog: Multi variable/high precision OP blast hole probe technology, RedT Energy Storage: Vanadium redox low risk off grid energy storage 30M&A STRATEGY Improve portfolio quality
▪ The rules are simple:
▪ Improve the quality of the portfolio
▪ Logical
▪ Value accretive
▪ Opportunistic
▪ But delivery is not simple. It requires the ability to:
▪ Recognise the opportunity
▪ Execute the transaction
▪ Integrate acquired assets
Remain disciplined
31You can also read