Capital One Securities, Inc. 9th Annual Energy Conference - Alan Farquharson, SVP - Reservoir Engineering & Economics
←
→
Page content transcription
If your browser does not render page correctly, please read the page content below
Capital One Securities, Inc. 9th Annual Energy Conference
   Alan Farquharson, SVP – Reservoir Engineering & Economics
                                                     December 10, 2014

                                                             1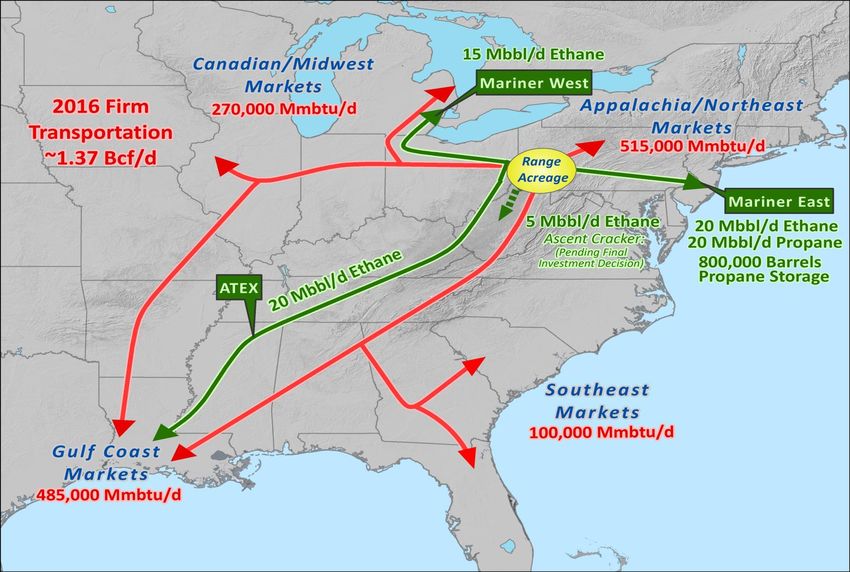
Forward-Looking Statements
Certain statements and information in this presentation may constitute “forward-looking statements” within the meaning of the Private Securities Litigation Reform Act of
1995. The words “anticipate,” “believe,” “estimate,” “expect,” “forecast,” “plan,” “predict,” “target,” “project,” “could,” “should,” “would” or similar words are intended
to identify forward-looking statements, which are generally not historical in nature. Statements concerning well drilling and completion costs assume a development
mode of operation; additionally, estimates of future capital expenditures, production volumes, reserve volumes, reserve values, resource potential, resource potential
including future ethane extraction, number of development and exploration projects, finding costs, operating costs, overhead costs, cash flow, NPV10, EUR and earnings
are forward-looking statements. Our forward looking statements, including those listed in the previous sentence are based on our assumptions concerning a number of
unknown future factors including commodity prices, recompletion and drilling results, lease operating expenses, administrative expenses, interest expense, financing
costs, and other costs and estimates we believe are reasonable based on information currently available to us; however, our assumptions and the Company’s future
performance are both subject to a wide range of risks including, production variance from expectations, the volatility of oil and gas prices, the results of our hedging
transactions, the need to develop and replace reserves, the costs and results of drilling and operations, the substantial capital expenditures required to fund operations,
exploration risks, competition, our ability to implement our business strategy, the timing of production, mechanical and other inherent risks associated with oil and gas
production, weather, the availability of drilling equipment, changes in interest rates, access to capital, litigation, uncertainties about reserve estimates, environmental
risks and regulatory changes, and there is no assurance that our projected results, goals and financial projections can or will be met. This presentation includes certain
non-GAAP financial measures. Reconciliation and calculation schedules for the non-GAAP financial measures can be found on our website at www.rangeresources.com.

The SEC permits oil and gas companies, in filings made with the SEC, to disclose proved reserves, which are estimates that geological and engineering data demonstrate
with reasonable certainty to be recoverable in future years from known reservoirs under existing economic and operating conditions as well as the option to disclose
probable and possible reserves. Range has elected not to disclose the Company’s probable and possible reserves in its filings with the SEC. Range uses certain
broader terms such as "resource potential," or "unproved resource potential,” "upside" and “EURs per well” or other descriptions of volumes of resources potentially
recoverable through additional drilling or recovery techniques that may include probable and possible reserves as defined by the SEC's guidelines. Range has not
attempted to distinguish probable and possible reserves from these broader classifications. The SEC’s rules prohibit us from including in filings with the SEC these
broader classifications of reserves. These estimates are by their nature more speculative than estimates of proved, probable and possible reserves and accordingly are
subject to substantially greater risk of being actually realized. Unproved resource potential refers to Range's internal estimates of hydrocarbon quantities that may be
potentially discovered through exploratory drilling or recovered with additional drilling or recovery techniques and have not been reviewed by independent engineers.
Unproved resource potential does not constitute reserves within the meaning of the Society of Petroleum Engineer's Petroleum Resource Management System and does
not include proved reserves. Area wide unproven, unrisked resource potential has not been fully risked by Range's management. “EUR,” or estimated ultimate recovery,
refers to our management’s estimates of hydrocarbon quantities that may be recovered from a well completed as a producer in the area. These quantities may not
necessarily constitute or represent reserves within the meaning of the Society of Petroleum Engineer’s Petroleum Resource Management System or the SEC’s oil and
natural gas disclosure rules. Actual quantities that may be recovered from Range's interests could differ substantially. Factors affecting recovery include the scope of
Range's drilling program, which will be directly affected by the availability of capital, drilling and production costs, commodity prices, availability of drilling services and
equipment, drilling results, lease expirations, transportation constraints, regulatory approvals, field spacing rules, recoveries of gas in place, length of horizontal laterals,
actual drilling results, including geological and mechanical factors affecting recovery rates and other factors. Estimates of resource potential may change significantly
as development of our resource plays provides additional data. In addition, our production forecasts and expectations for future periods are dependent upon many
assumptions, including estimates of production decline rates from existing wells and the undertaking and outcome of future drilling activity, which may be affected by
significant commodity price declines or drilling cost increases.

Readers are cautioned not to place undue reliance on forward-looking statements, which speak only as of the date hereof. We undertake no obligation to publicly update
or revise any forward-looking statements after the date they are made, whether as a result of new information, future events or otherwise. Investors are urged to consider
closely the disclosure in our most recent Annual Report on Form 10-K, available from our website at www.rangeresources.com or by written request to 100 Throckmorton
Street, Suite 1200, Fort Worth, Texas 76102. You can also obtain the Form 10-K by calling the SEC at 1-800-SEC-0330.

                                                                                                                                                                       2            2
Range is a Simple Story

1. Owns largest acreage position in core of Marcellus with
   additional stacked pay horizons

2. Wells, gathering, processing and markets planned or
   contracted to grow to 3 Bcfe per day and beyond

3. 20% to 25% planned production growth for many years,
   targeting cash flow positive by 2016

4. Balance sheet and liquidity support the planned growth

5. Team in place to execute this plan with our proven track
   record

                                                         3    3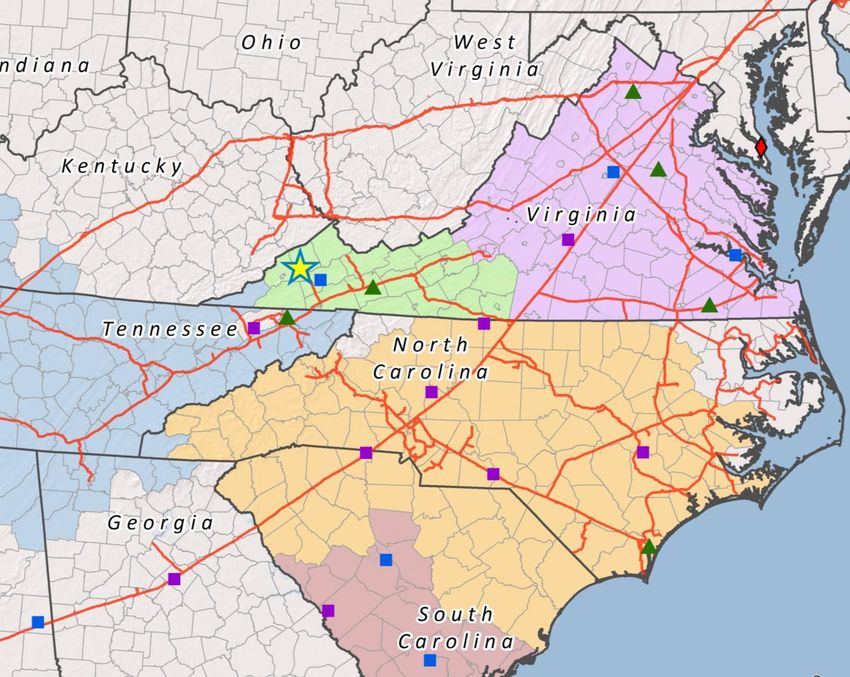
Near-term Catalysts

1. Unit costs expected to continue to decline
2. Utica well test to potentially add another growth
   opportunity
3. Continuing significant reserve growth
4. Uplift in cash flow in 2015 with Mariner East NGL exports
     • Propane – year end 2014
     • Ethane – mid-2015
5. Improved capital efficiencies with drilling longer laterals
   and more wells on existing pads
6. Land expenditures as percent of budget reduced in 2017,
   increasing the drilling budget

                                                           4     4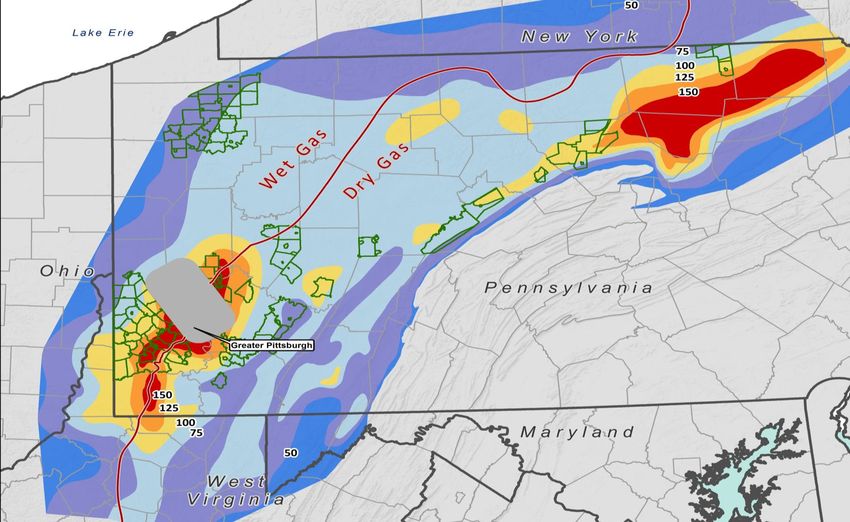
Range Resources Strategy
                                                                                            Marcellus Shale
                                                                                          ~1 million net acres
                                                                                    41 to 51 Tcfe resource potential
     Proven track record of performance                                                  Upper Devonian Shale
                                                                                    12 to 18 Tcfe resource potential

                                                                                      Utica/Point Pleasant Shale
•    Focus on PER SHARE                                                                        pending

     GROWTH of production
     and reserves at top-
     quartile or better cost
                                                          Midcontinent
     structure while high                             ~360,000 net acres
                               Mississippian, St. Louis, Granite Wash, Cleveland and Woodford
     grading                                    7 to 11 Tcfe resource potential

     the inventory

•    Maintain simple, strong
     financial position
                                                                                                       Southern Appalachia
                                                                                                         ~475,000 net acres

•    Operate safely and be                                                                      Huron Shale, Berea, Big Lime, CBM
                                                                                                   5 to 6 Tcfe resource potential

     a good steward of the
     environment                                 Total Resource Potential
                                     65 to 86 Tcfe without Utica/Point Pleasant Shale

                                                                                                                       5       5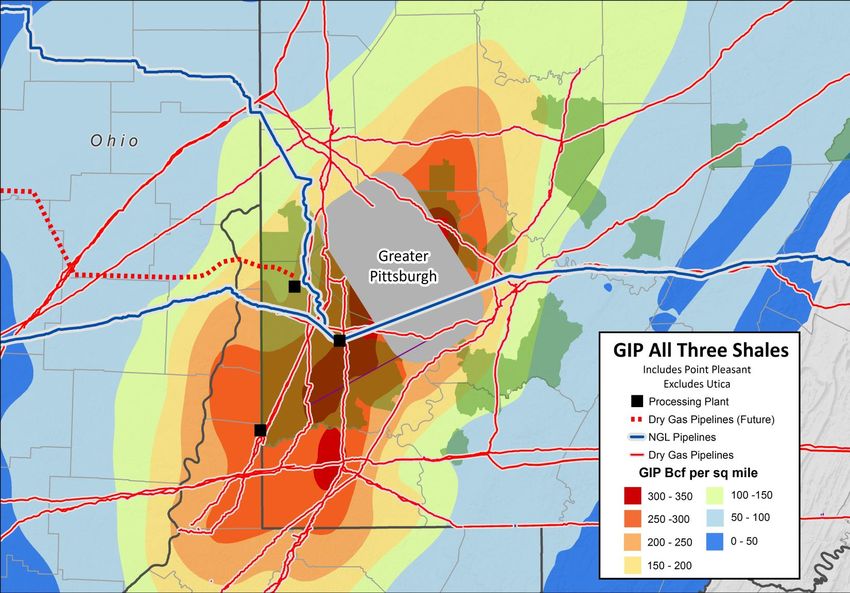
Range’s Planned Growth to 3 Bcfe Per Day

• 20%-25% growth for many years

• Wells identified, infrastructure planned with the contracted
  takeaway capacity to profitably grow production to 3 Bcfe/d

• Range is targeting to be cash flow positive in 2016

• Significant growth planned in 2016 and beyond, when gas
  demand is projected to grow from LNG exports, petrochemical,
  power generation, manufacturing, and transportation

• Unit costs are projected to continue decreasing as production
  grows

• Range’s well results are projected to improve as longer laterals
  improved completion technology and more frac stages are
  incorporated

                                                                 6   6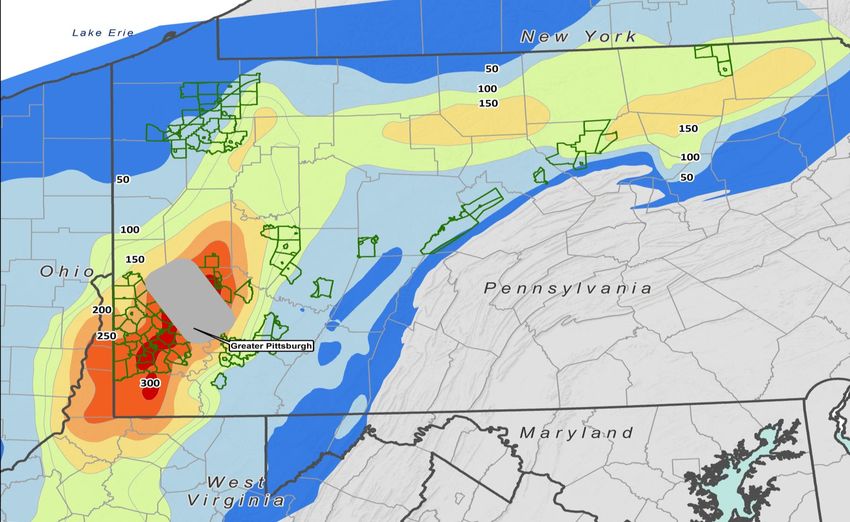
20% - 25% Growth Trajectory
              3,000
                      Growth trajectory to 3 Bcfe net per day:                           Corporate
                                                                                     production at 25%
                        • Wells identified                                              growth rate
              2,500     • Compression and processing plants
                          scheduled
                        • Required takeaway capacity contracted
              2,000
Mmcfe/d Net

                                                                                                     Corporate
                                                                                                 production at 20%
                                                                                                    growth rate
              1,500

              1,000

               500

                 0

                                                     Note: Includes impact of historical acquisitions and asset sales

                                                                                                              7         7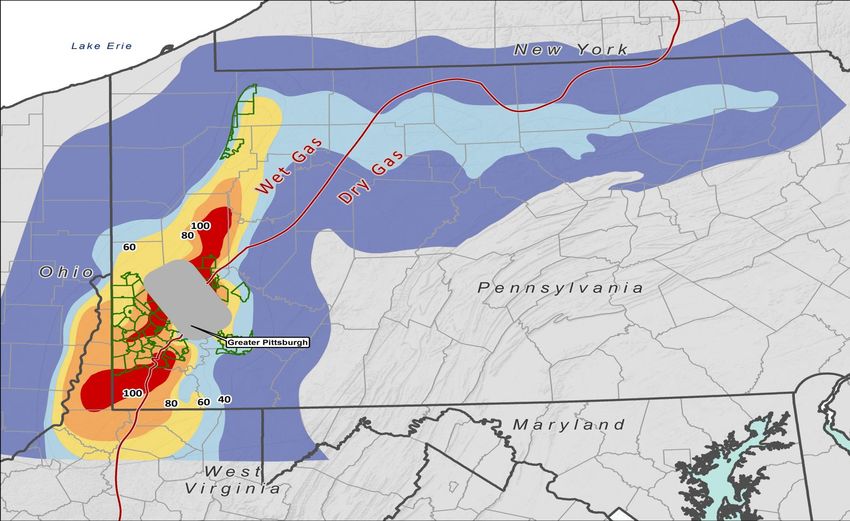
Range is Focused on Per Share Growth, on a Debt-Adjusted Basis

             Production/share – debt adjusted                                     Reserves/share – debt adjusted

             2.0                                                             50

                                                                             45
             1.8
Mcfe/share

                                                                             40

                                                                Mcfe/share
             1.6
                                                                             35
             1.4
                                                                             30
             1.2
                                                                             25
             1.0
                                                                             20
             0.8
                                                                             15

             0.6
                                                                             10

             0.4                                                              5
                    2008     2009   2010   2011   2012   2013                      2008     2009   2010   2011   2012   2013

                           2013 Increase of 26%                                           2013 Increase of 25%

             •     Production/share = annual production divided by debt-adjusted year-end diluted shares
                   outstanding

             •     Reserves/share = year-end proven reserves divided by debt-adjusted year-end diluted shares
                   outstanding

                                                                                                                         8     8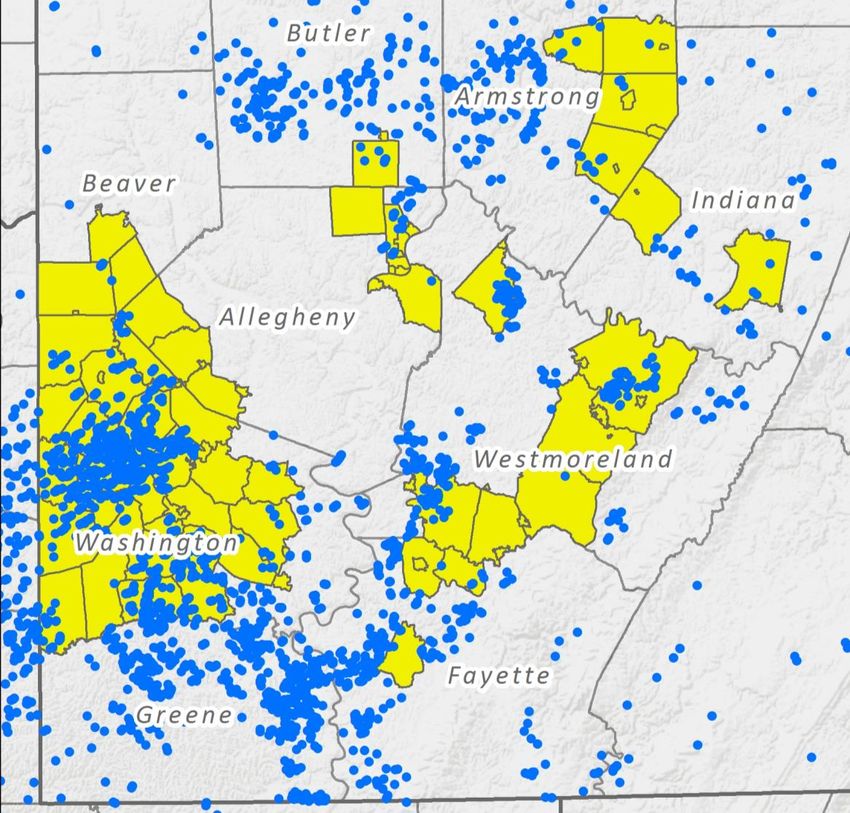
Unit Costs Are a Key Focus
              $4.50

              $4.00

              $3.50

              $3.00
    $/mcfe

              $2.50

              $2.00

              $1.50

              $1.00

              $0.50
              $0.00
                $-
                           2008                2009                  2010                 2011                 2012                 2013                2014E
  Reserve
                           $1.64               $1.25                 $0.83                $0.68                $0.68               $0.66                $0.63
  Replacement(1)
  LOE (2)                 $0.99                $0.82                 $0.72                 $0.60               $0.41               $0.37                $0.34
  Prod. taxes             $0.39                $0.20                 $0.19                 $0.14               $0.15(3)            $0.13                $0.12
  G&A (2)                 $0.49                $0.51                 $0.55                 $0.56               $0.46               $0.42                $0.37
  Interest                $0.71                $0.74                 $0.73                 $0.69               $0.61               $0.51                $0.41
  Trans. &
                          $0.08                $0.32                 $0.40                 $0.62               $0.70                $0.75               $0.77
  Gathering
             Total        $4.30                $3.84                 $3.42                 $3.29               $3.01                $2.84               $2.64

(1) Three-year average of drill bit F&D costs, excluding acreage (2) Excludes non-cash stock compensation (3) Excludes retroactive payments for PA impact fee in 2012

                                                                                                                                                           9            9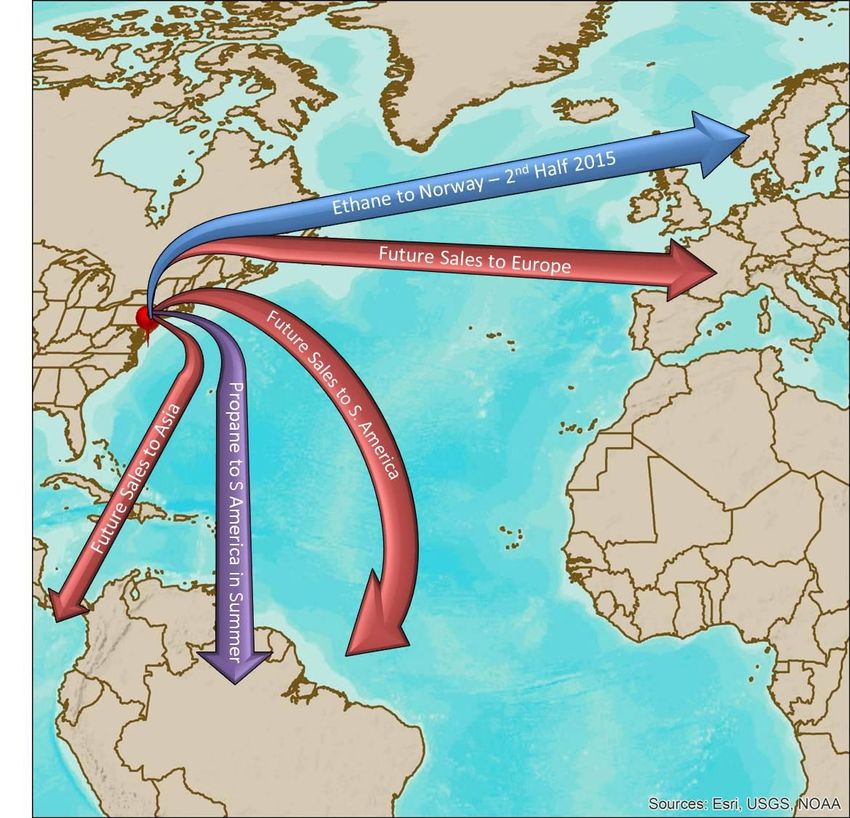
Financial Position
Strong, Simple Balance Sheet
   •   Bank debt, subordinated notes and common stock
   •   No debt maturity until 2019 (bank) and 2020 (notes)
   •   Available liquidity of $1.2 billion under commitment amount

Well Structured Bank Credit Facility
   •   29 banks with no bank holding more than 6% of total
   •   Current borrowing base of $3.0 billion; commitment amount of $2.0 billion

Improving Debt Metrics
   •   Debt to Cap ratio reduced from 57% at YE 2013 to 49% at September 30
   •   Debt to EBITDAX reduced from 2.8x at March 31 to 2.5x at September 30
   •   Recent upgrades from Moody’s (Ba1 – Positive Outlook) and S&P (BB+)

Solid Hedge Position
   •   Range typically hedges a significant portion of projected upcoming 12 months of production
   •   2015 Gas is 55% hedged at an average floor of $4.13
   •   2015 Oil is 77% hedged at a floor of $90.57
   •   For total liquids, including accounting for our ethane contracts, we are 50% hedged on liquids
       for 2015

                                                                                           10   10
Moved 6.4 Tcfe of Resource Potential into Proved Reserves in
the Last Four Years
Tcfe YE 2009 YE 2010 YE 2011 YE 2012 YE 2013
Proved 3.1 4.4(1) 5.1 6.5 8.2
Reserves
Resource 24 - 32 35 - 52 44 - 60 48 – 68(3) 65 – 86(4)
Potential (2)
Proved reserves have increased by 28% per year on a
compounded basis since 2009
(1) Pro-forma 3.5 Tcfe after Barnett sale
(2) Net unproved resource potential
(3) Added 12 – 15 Tcfe resource potential for tighter spaced drilling in the wet and super-rich Marcellus to YE 2012 resource potential at mid-year 2013
(4) Includes the effect of the property exchange with EQT, effective June 16, 2014
11 11~1 Million Net Acres Prospective for Shales in PA
Northwest
305,000 net acres(1)
(Legacy acreage is largely
held by shallow production)
Northeast
120,000 net acres
(One rig is projected to
hold all blocked up
acreage being targeted for
development)
Southwest
530,000 net acres(2)
(95% of acreage is HBP or projected to
be drilled under existing lease terms)
Note: Townships where Range holds ~3,000+ acres are shown in yellow (As of 12/31/2013)
(1) Approximately 140,000 acres prospective for Marcellus; ~175,000 acres prospective for wet Utica/Point Pleasant (2) Extends partially into WV
12Pennsylvania Stacked Pays – Net Acreage
Wet Dry Total
Acreage Acreage Acreage
Upper Devonian 330,000 230,000 560,000
Marcellus 470,000 320,000 790,000
Utica/Point
Pleasant 175,000 400,000 575,000
975,000 950,000 1,925,000
Stacked pays allow for multiple development opportunities at 1,000 foot spacing
between wells and later with 500 foot spacing prospective on most acreage
13 13Gas In Place (GIP) – Marcellus Shale
• GIP is a function of pressure,
temperature, thermal maturity,
porosity, hydrocarbon
saturation and net thickness
• Two core areas have been
developed in the Marcellus
• Condensate and NGLs are in
gaseous form in the reservoir
Note: Townships where Range holds ~3,000 or more acres (as of 12/31/2013), and estimated as prospective, are outlined green. GIP – Range estimates.
14Gas In Place (GIP) – Upper Devonian Shale
• The greatest GIP in the Upper
Devonian is found in SW PA
• A significant portion of the GIP
in the Upper Devonian is located
in the wet gas window
Note: Townships where Range holds ~3,000 or more acres (as of 12/31/2013), and estimated as prospective, are outlined green. GIP – Range estimates.
15Gas In Place (GIP) – Point Pleasant
Outlined portion
represents the area
of the highest
pressure gradients in
the Point Pleasant
Note: Townships where Range holds ~3,000 or more acres (as of 12/31/2013), and estimated as prospective, are outlined green. GIP – Range estimates.
16Gas In Place (GIP) Analysis Shows Greatest Potential in SW PA
When GIP analysis from the Marcellus,
Upper Devonian and Point Pleasant are
combined, the largest stacked pay
resource is located in SW PA where Range
has concentrated its acreage position
Note: Townships where Range holds ~3,000 or more acres (as of 12/31/2013), and estimated as prospective, are outlined green. GIP – Range estimates.
17Range Acreage Strategically Located Near Highest GIP & Infrastructure
Note: Townships where Range holds ~3,000 or more acres (as of 12/31/2013), and estimated
as prospective, are shown green. GIP – Range estimates.
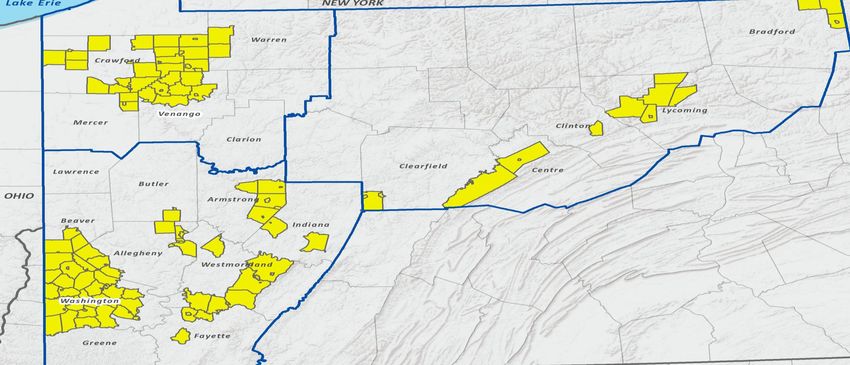
18Southwest PA – Range’s 530,000 Net Acres
• Approximately 2,900
industry wells (2,300
horizontal & 600
vertical) have defined
the productive
boundaries of the
Marcellus
• Range’s acreage is
highly prospective for
Marcellus, with low
reinvestment risk and
high rates of return
• Up to nine years of
production history from
Note: Townships where Range holds ~3,000 or more acres are shown in yellow (As of 12/31/2013)
this area
19 19Southwest PA – Large Upside Potential
Small Percentage of Acreage Drilled
• Prospective acreage 530,000
• Assumed spacing ~80 acres
• Potential Marcellus Shale locations 6,625
• Producing horizontal wells ~605
• Drilled wells divided by potential locations ~9%
~778 Mmcfe/d net being produced from ~9%
of Range’s acreage in SW PA
20 20Southwest PA – Development Mode Economic Summary
Targeting Average Lateral Length in 2015 to be over 6,200 feet
Super-Rich Wet Dry
2.05 Mmboe (12.3 Bcfe) 12.3 Bcfe
EUR 1,172 Mbbls & 5.3 Bcf 978 Mbbls & 6.4 Bcf
13.4 Bcf
0.40 Mmboe
EUR/1,000 ft lateral (2.4 Bcfe equivalent)
2.93 Bcfe 2.58 Bcf
78.8 Mboe
EUR/stage (473 Mmcfe equivalent)
586 Mmcfe 515 Mmcf
Well Cost $6.8 MM $6.1 MM $6.6 MM
Stages 26 21 26
Lateral Length 5,300 ft 4,200 ft 5,200 ft
IRR – Strip (as of 6/30/14) 118% 121% 104%
IRR – $4.00 104% 106% 85%
21 21Appalachia Gas Transportation Arrangements
Projected 2014 Projected 2016 Projected 2018
Transport Transport Transport
Mmbtu/day Mmbtu/day Mmbtu/day
Regional Direction Cost per Cost per Cost per
(Gross) (Gross) (Gross)
Mmbtu Mmbtu Mmbtu
Firm Transportation
Appalachia/Local 325,000 $ 0.21 330,000 $ 0.22 430,000 $ 0.30
Gulf Coast 260,000 $ 0.31 485,000 $ 0.43 935,000 $ 0.51
Midwest/Canada 70,000 $ 0.20 270,000 $ 0.26 470,000 $ 0.41
Northeast 185,000 $ 0.60 185,000 $ 0.60 185,000 $ 0.60
Southeast 100,000 $ 0.39 100,000 $ 0.39 100,000 $ 0.39
Firm Sales/Released Capacity 175,000 -- 380,000 -- 270,000 --
Total Take-Away Capacity 1,115,000 $ 0.28 1,750,000 $ 0.28 2,390,000 $ 0.39
Capacity listed above reflects actual amounts of production that can flow
under these arrangements. We believe these firm arrangements provide
adequate capacity to meet our growth projections through 2018
Range net production would be approximately 83% of the gross amounts shown. Does not include current intermediary pipeline capacity of >800,000 Mmbtu/day,
and assumes full utilization. Cost associated with Firm Sales/Released Capacity is assumed as a deduction to price. Based on anticipated project start dates.
22 22Natural Gas Transportation Arrangements
2,500,000 Range’s Firm Transportation Strategy:
• Add firm transport to good markets at a reasonable cost
• Time transportation commitments with expected production
Firm Sales/Released
• Utilize firm sales and released capacity from industry Capacity
2,000,000 participants
Southeast
Mmbtu/d (Gross)
Northeast
1,500,000
Anticipated Canada
1,000,000
Midwest/Canada
Gulf Coast
500,000
Appalachia/Local
-
2014 2015 2016 2017 2018
Year End
Does not include current intermediary pipeline capacity of >800,000 Mmbtu/day
23Appalachia Supply & Demand
50
• LNG exports starting in late 2015
40 • Appears to have sufficient takeaway
capacity by 2016
30
Bcf/d
20
10
0
Appalachia Consumption Regional Storage Injections Announced Takeaway Additions Appalachia Production
2013 2014 2015 2016 2017 2018
Appalachia Production 11.2 15.5 17.8 19.9 23.4 24.7
Appalachia Consumption + Injections 13.4 14.6 14.2 14.6 15.0 15.2
A Appalachia Gas Surplus for Export (2.2) 0.9 3.6 5.3 8.4 9.5
Fully Committed Takeaway Projects (cumulative year end) 3.4 8.1 11.2 20.9 25.4
Other Proposed Takeaway Projects (cumulative year end) - - 3.1 4.3 7.8
B Total Takeaway Projects (cumulative year end) 3.4 8.1 14.8 25.7 33.7
Excess Takeaway (B – A) 2.5 4.5 9.0 16.8 23.7
Source: Analyst estimates
242014 Diversified Portfolio by Major Indices
3Q 2014 Corporate Differential
Estimated Appalachia Gas Sales Portfolio By to NYMEX: ($0.49)
Major Indices - 2014
Southeast Calculated 4Q 2014 and
1Q 2015 Corporate
Differential to NYMEX:
($0.58)* and ($0.31)*
Northeast Transco Z5 Non-WGL respectively, based on
8%
Transco NNY current future indications
10% CGT
9%
TETCO M3 TGP 500L Gulf Coast
8% 14%
TGP 200L
Nymex 3%
TETCO M2 TCO 11%2018 Diversified Portfolio by Major Indices
Estimated Appalachia Gas Sales Portfolio By
Major Indices - 2018 ~70% of Range’s gas volumes
Southeast are expected to be priced
off of indices outside of
Appalachia by 2018
Northeast
Transco Z5 Non-
FGT Zone 2 WGL
Transco NNY 1% 4% CGT - Mainline
4%
6% CGT - Onshore
TETCO M3
Nymex 5% 9%
2%
TETCO ELA
TETCO M2 7%Innovative Gas and NGL Marketing
2016 Firm transportation volumes shown above exclude 380,000 Mmbtu/d of firm sales/released capacity
27
27Range NGL’s- Now a Global Market
• As the largest producer of NGL’s in
Appalachia, Range will continue to
see high interest from international
customers
• Shipments of ethane from Marcus
Hook to Norway begin in second half
of 2015. Range’s portfolio of ethane
solutions result in >25% increase in
ethane revenue, versus leaving
ethane in the gas, net of all costs
• Shipments of propane to South
America have been ongoing for the
past 3 summers. With high demand
in winter months, most propane is
expected to be sold locally
• Propane netbacks will increase by
$0.20 per gallon when Mariner East
pipeline from SW PA to Marcus Hook
is completed in early 2015
• Other NGL’s are expected to be
shipped from Marcus Hook
28 28Additional Upside – Point Pleasant
Nearby industry activity is
approaching our SW PA
Point Pleasant acreage
• 400,000 net acres in SW PA
RRC Claysville
Sportsman’s Club
• Range 2014 Point Pleasant
test positioned in area of
highest projected IP’s per
stage
• Recently set pipe on the
Point Pleasant test in
Washington County,
Sportsman’s Club #1,
anticipating results by late
December 2014
Note: Townships where Range holds ~3,000 or more acres are shown outlined above (As of 12/31/2013)
Marcellus Drilling Holds All Depths
29 29Additional Upside – Upper Devonian
560,000 Net Acres Prospective for Upper Devonian
• Hydrocarbon in place and
Super-Rich Wet Gas thermal maturity of SW PA
110,000 acres 220,000 acres Upper Devonian similar to
Marcellus
• Able to utilize existing
Marcellus infrastructure
thereby improving economics
• Completion method and
landing significantly improved
results from the first test
• Latest well – 24 hour test rate
10.0 Mmcfe/d with ethane
recovery composed of:
4.0 Mmcf/d gas
Dry Gas 172 bbls condensate
200,000 acres 826 bbls NGLs
Note: Townships where Range holds ~3,000+ acres are shown in
• Previously drilled well yellow (As of 12/31/2013)
30 30Nora Area – Strategic Marketing Advantages
• Nora is strategically
Nora positioned to provide
gas to southeast
markets
• 3.0 Bcf/d of new
demand in VA, NC, SC,
TN, GA, AL with 1 Bcf/d
of new demand in
Virginia alone
• Contracts in place for
110 Mmcf/d at
$0.20/mbtu above
NYMEX for the next 18
months
• ~50 Mmcf/d of existing
unused transport
capacity to allow for
planned production
growth
31Midcontinent Division Highlights
• 360,000 net acres
• Currently drilling Mississippian Chat and St. Louis
• Results are encouraging, as the last two quarters had the two
highest average 24-hour IP rates achieved to date.
• 3rd Quarter Mississippian wells averaged 24 hour IP’s of 661 boe
per day, with 72% liquids
• Mississippian wells have an expected rate of return of 71% and
St. Louis wells have an expected rate of return of 90%, based on
6/30/14 strip pricing
• Horizontal Granite Wash, Cleveland and Woodford potential on
existing HBP acreage
32 32Horizontal Mississippi Chat wells concentrated along Nemaha Ridge
• Range has ~160,000 net
acres largely blocked
up for economy of scale
• Development
concentrated in Kay and
Noble counties
• Expected rate of return
is 71% with cost of $3.4
million and EUR of 485
Mboe (6/30/14 strip pricing)
• Firm transport provided
in connection with
processing agreements
Producing Horizontal Mississippian wells Wells to be drilled, second half 2014
33 33New Markets Increasing Demand for Natural Gas
Demand for natural gas could increase up to 20 Bcf per day by 2018(2)
Power Generation Sector
• Utilities using more gas versus coal, by 2035 natural gas will surpass coal as leading electricity source (1)
• Estimates say that natural gas fired power plants will supply 46% of all new power plant additions through
2035- compared to 37% for renewables, 12% for coal and 3% for nuclear (1)
Manufacturing/Petrochemical
• Due to the large price difference in naptha (oil-based) versus ethane (gas-based), U.S. international
petrochemical companies are converting their feedstocks from naptha to ethane
• IHS chemical estimates $125 billion in announced U.S. petrochemical investments. (3)
• Large number of proposed projects in gas-to-liquids, methanol, ethylene crackers and fertilizers
Natural Gas Exports
• The outlook has changed from the U.S. being a net importer of natural gas to becoming a net exporter
• To date, six LNG export facilities have been approved(4), representing 10 Bcf/day of additional demand
• Natural gas exports would be beneficial for the U.S. under any pricing scenario. “Across all these
scenarios, the U.S. was projected to gain net economic benefits from allowing LNG exports” (4)
• Current proposed and announced export projects total ~40 Bcf/day (5)
Transportation Sector
• With natural gas vehicles (NGV’s) being 25% cleaner, fuel costs 50% less and new refueling stations being
added across the U.S., the number of U.S. NGV’s is expected to increase significantly
• Fleet managers at AT&T, UPS, and Waste Management are converting all or parts of their fleets to natural
gas as are transit agencies, municipalities and state governments
• The three largest U.S. truck manufacturers are now producing dual-fuel CNG trucks
• Range now has 184 CNG vehicles in its own corporate fleet 1. EIA
2. Goldman Sachs
3. Wall St. Journal, 3/24/14
4. Department of Energy
5. DOE/FE LNG Applications
34 34Environment, Health and Safety - A Core Value at Range
1. Environmental, Health and Safety issues can affect many aspects of our business. Range
feels a deep responsibility to protect our employees, contractors, the public and the
environment. It is held as a core value.
2. Examples where Range has been a leader
• In 2008, Range recommended improved standards for well cementing and casing to the DEP
that are now being widely used.
• In 2009, Range pioneered water recycling for shale gas development and we were the first
company to achieve 100 percent reuse levels.
• In 2010, Range was the first company to voluntarily disclose fluids used in hydraulic
fracturing on a per well basis and provide that information to the public online.
• In 2012, Range initiated a Zero Vapor Protocol for wet gas and super rich areas in Marcellus
shale gas development.
3. Range provides training to its employees to create a culture of safe performance and
regulatory compliance. Our Contractor Management protocol requires that work be
performed at its highest standard.
4. Range remains active in incident management and response planning by working with
local community government and first responders to identify roles and responsibilities for
a robust unified management approach to unique situations.
5. Range’s goal is to maintain a safe and secure working environment for our employees and
the communities in which we work.
35 35Range – Significant Growth Potential for Many Years
1. Projected 20%-25% growth for many years
2. Wells identified, infrastructure planned with the
contracted takeaway capacity to profitably grow
production to 3 Bcfe/d
3. Targeting to be cash flow positive in 2016
4. Significant growth planned in 2016 and beyond, when
gas demand is projected grow from LNG exports,
petrochemical, power generation, manufacturing and
transportation
36 36Contact Information
Range Resources Corporation
100 Throckmorton, Suite 1200
Fort Worth, Texas 76102
Main: 817.870.2601
Fax: 817.870.2316
Rodney Waller, Senior Vice President
rwaller@rangeresources.com
David Amend, Investor Relations Manager
damend@rangeresources.com
Laith Sando, Research Manager
lsando@rangeresources.com
Michael Freeman, Senior Financial Analyst
mfreeman@rangeresources.com
www.rangeresources.com
37 37You can also read