INVESTOR PRESENTATION - DR. FRANK REINERS (CHIEF FINANCIAL OFFICER - OPEN GRID EUROPE GMBH) - VIER GAS TRANSPORT GMBH
←
→
Page content transcription
If your browser does not render page correctly, please read the page content below
Investor Presentation
Dr. Frank Reiners
(Chief Financial Officer — Open Grid Europe GmbH)

Axel Berndt
(Head of Finance, Accounting & Tax — Open Grid Europe GmbH)

September 2018
Disclaimer
This document (the “Presentation”) is strictly confidential and must not be disclosed or distributed to third parties. This Presentation may not be disseminated in the United States (“U.S.”), Australia, Canada, Japan or any other
jurisdiction where the dissemination or publication of this Presentation would be unlawful.
This document has been prepared by Vier Gas Transport GmbH (“VGT”), a limited liability company (Gesellschaft mit beschränkter Haftung) incorporated and operating under the laws of the Germany and domiciled in Essen in
the context of the transaction contemplated therein.
None of the banks that may be associated with this Presentation nor any of their respective directors, officers, employees and agents: (a) accept any responsibility or liability whatsoever for any loss arising from this
Presentation or its contents or otherwise arising in connection with the offer of the notes described herein (the “Notes”); (b) authorised or caused the issue of, or made any statement in, any part of this Presentation; and (c)
make any representation, recommendation or warranty, express or implied regarding the origin, validity, accuracy, adequacy, reasonableness or completeness of or any errors or omissions in, any information, statement or
opinion contained in this Presentation and accept no liability therefore.
Certain statements contained herein may be statements of future expectations and other forward-looking statements about VGT and its affiliates, which are based on its management's current views and assumptions and
involve known and unknown risks and uncertainties that could cause actual results, performance or events to differ materially from those expressed or implied in such statements. In addition to statements which are forward-
looking by reason of context, words such as "may", "will", "should", "expects", "plans", "contemplates", "intends", "anticipates", "believes", "estimates", "predicts", "potential", or "continue" and similar expressions typically
identify forward-looking statements.
By their nature, forward-looking statements involve known and unknown risks and uncertainties because they relate to events and depend on circumstances that may or may not occur in the future. As such, no forward-looking
statement can be guaranteed. Undue reliance should not be placed on these forward-looking statements. Many factors could cause our results of operations, financial condition, liquidity, and the development of the industries in
which VGT competes, to differ materially from those expressed or implied by the forward-looking statements contained herein. These factors include, without limitation, the following: (i) VGT’s ability to compete in the regions in
which it operates; (ii) VGT’s ability to meet the needs of its customers; (iii) VGT’s ability to leverage synergies from acquisitions, cost reduction programs or other projects; (iv) uncertainties associated with general economic
conditions; (v) governmental factors, including the costs of compliance with regulations and the impact of regulatory changes; (vi) the impact of currency exchange rate and interest rate fluctuations; and (vii) other risks,
uncertainties and factors inherent in VGT’s business. Subject to applicable securities law requirements, VGT disclaims any intention or obligation to update or revise any forward-looking statements set forth herein, whether as
a result of new information, future events or otherwise.
This Presentation is provided for information purposes only and does not constitute, or form part of, any offer or invitation to underwrite, subscribe for or otherwise acquire or dispose of, or any solicitation of any offer to
underwrite, subscribe for or otherwise acquire or dispose of Notes.
The Notes will neither be registered under the U.S. Securities Act of 1933, as amended, nor with any authority of any U.S. state nor in accordance with any applicable securities laws in Australia, Canada or Japan and may not be
offered or sold within the United States or to, or for the account or benefit of, U.S. persons or any other persons domiciled in Australia, Canada, Japan or the United States. No public offer of Notes will be made in the United
States, Australia, Canada, Japan or any other jurisdiction.
The Notes will not be offered to the public and any offer in any member state of the European Economic Area (each, a “Relevant Member State”) which has implemented the Prospectus Directive (2003/71/EC), as amended,
including any relevant implementing measures to implement the Directive 2014/51/EU (the “Prospectus Directive”), is directed exclusively at persons who are “qualified investors” within the meaning of the Prospectus Directive
(“Qualified Investors”) and “eligible counterparties” and “professional clients” within the meaning of the Markets in Financial Instruments Directive II (2014/65/EU), as amended, including any relevant implementing measures to
implement the Directive 2014/65/EU (the “MiFID II”) and any offer of the Notes may only be made if no prospectus for offers of the Notes has to be published, prepared or registered in any jurisdiction. VGT has not authorised,
nor does it authorise, the making of any offer of the Notes in circumstances in which an obligation arises for it to publish a prospectus for such offer.
This Presentation is based on the knowledge available to the persons preparing it as of the time of print. The statements herein are of a general nature and do not take into account the individual needs of investors in respect of
yield, tax situation or risk tolerance and ability to bear risk. No representation or warranty express or implied is made as to, and no reliance should be placed on the fairness, accuracy, completeness or correctness of, the
information contained herein.
In connection with any promotion, offering, distribution and/or sale of the Notes referred to in this Presentation (or any beneficial interest therein) all applicable laws, regulations and regulatory guidance (whether inside or
outside the EEA) must at all times be complied with, including (without limitation) MiFID II and any other such laws, regulations and regulatory guidance relating to determining the appropriateness and/or suitability of an
investment in the Notes (or any beneficial interest therein) for investors in any relevant jurisdiction. It must further be acknowledged that the identified target market for the Notes (for the purposes of the product governance
obligations in MiFID II) will be eligible counterparties and professional clients only.
Figures shown in this Presentation are based on figures disclosed in VGT’s annual report as well as VGT’s interim reports, unless stated otherwise. However, figures used in this Presentation have been rounded, which could
result in percentage changes differing slightly from those provided in such reports.
VGT has diligently prepared this Presentation. However, rounding, transmission, printing, and typographical errors cannot be ruled out. None of VGT or any of its affiliates, advisors or representatives shall be responsible or
liable for any omissions, errors or subsequent changes which have not been reflected herein and accept no liability whatsoever for any loss or damage howsoever arising from any use of this Presentation or its content or third
party data or otherwise arising in connection therewith.

“Standard & Poor's Financial Services LLC (S&P) does not guarantee the accuracy, completeness, timeliness or availability of any information, including ratings, and is not responsible for any errors or omissions (negligent or
otherwise), regardless of the cause, or for the results obtained from the use of ratings. S&P GIVES NO EXPRESS OR IMPLIED WARRANTIES, INCLUDING, BUT NOT LIMITED TO, ANY WARRANTIES OF MERCHANTABILITY OR
FITNESS FOR A PARTICULAR PURPOSE OR USE. S&P SHALL NOT BE LIABLE FOR ANY DIRECT, INDIRECT, INCIDENTAL, EXEMPLARY, COMPENSATORY, PUNITIVE, SPECIAL OR CONSEQUENTIAL DAMAGES, COSTS,
EXPENSES, LEGAL FEES, or LOSSES (INCLUDING LOST INCOME OR PROFITS AND OPPORTUNITY COSTS) IN CONNECTION WITH ANY USE OF RATINGS. S&P’s ratings are statements of opinions and are not statements of
fact or recommendations to purchase, hold or sell securities. They do not address the market value of securities or the suitability of securities for investment purposes, and should not be relied on as investment advice.”
                                                                                                                                                                                                                                        2
Agenda          Presenters

1   Key Investment Highlights           Dr. Frank Reiners
                                        Chief Financial Officer
                                        Open Grid Europe GmbH
2   Business Profile

                                        Axel Berndt
3   Financing Overview                  Head of Finance,
                                        Accounting & Tax
                                        Open Grid Europe GmbH
4   Conclusion & Transaction Details

5   Appendix

                                                                  3
Key Investment Highlights
Largest Gas Transmission System Operator (TSO) in Germany
Strong
Strategically located network in Germany and Europe
Market Position
Favourable German macro-economic situation and strong gas market fundamentals
3rd regulatory period started 2018 for five years
Stable Regulated
Key regulatory parameters for Revenue Cap of 3rd regulatory period determined
Business
No significant changes to regulatory framework within ongoing regulatory period expected
Predictable & Low Growth Capex based on German Network Development Plan
Risk Capex New investments immediately revenue accretive, i.e. earning regulated returns without delay
Over 90 years operating history in Germany
Experienced
Experienced management team
Operator
Well maintained assets
Robust & Predictable revenues and profits with strong cash generation
Predictable Proven track record in capital market
Financial Profile A-/Stable/A-2 Rating by S&P
4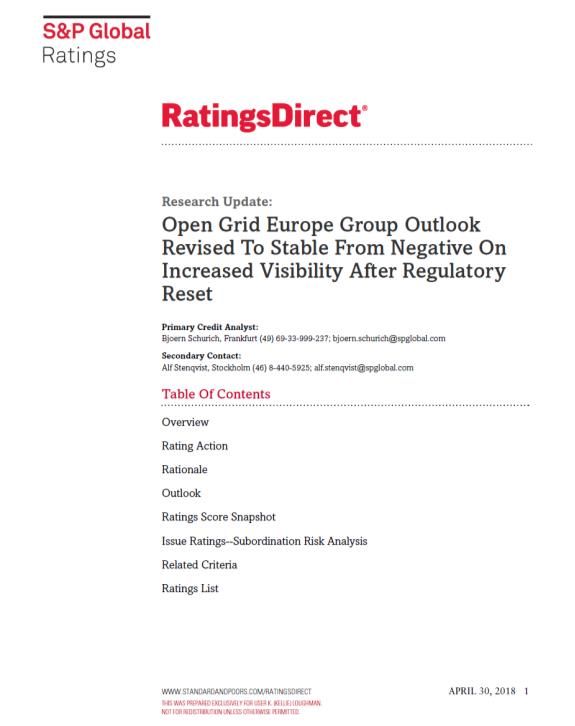
1   Key Investment Highlights

2   Business Profile

3   Financing Overview

4   Conclusion & Transaction Details

5   Appendix

                                       5
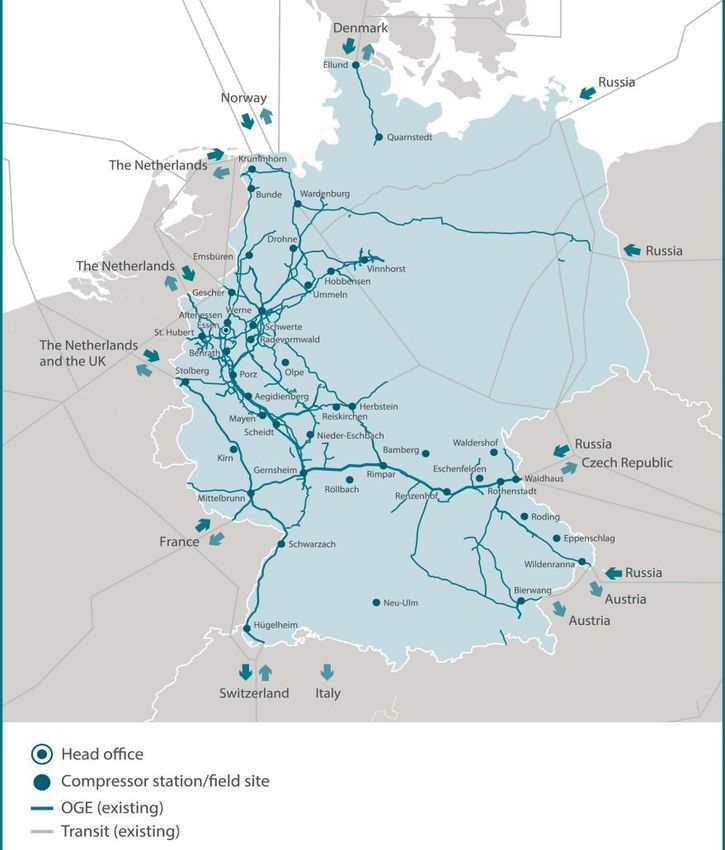
Vier Gas at a Glance
Overview OGE Key Figures VGT Group (2017)
Largest German gas transmission system operator Total Revenues €923m
Natural gas transmission for > 400 customers
EBITDA1 €454m
Design, construction, operation and marketing of gas
transmission
CAPEX €510m
Largest supra-regional pipeline network in Germany
Providing services related to gas transmission Total Employees2 1,358
Operating history dates back over 90 years
Simplified Structure
Vier Gas Transport GmbH (100%)
Open Grid Europe GmbH
4
METG (100%)
ZEELINK (75%) Other Regulated
MEGAL (51%) NetConnect and Non-
TENP (51%) Germany (35%) Regulated
NETG (50%) Businesses
NETRA (41%)3 (1-100%)
DEUDAN (25%)
1 Incl. equity income
2 Average number of employees of financial year 2017 (excluding management and apprentices)
3 OGE holds 15% of indirect shares in NETRA in addition to direct shareholding of 41%
4 Percentage figures have been rounded
6
Key Gas Transmission System Operator at the Heart of Europe
Centrally Positioned Service Area Largest German Gas Transmission Network/ Operator 1
2
~12,000
Grid Length (km)
~7,000
~4,200
~3,700
~2,400
OGE Ontras/VNG Thyssengas Gasunie D Gascade
Covering approx. 65 % of the total shipping volume in Germany
with 630 TWh annual offtake quantity in 2017
28 compressor stations and 90 units
Approx. 50 entry and 1,100 exit points with 15 interconnections
to bordering countries
1 Source: FNB Gas “Konsultationsdokument Netzentwicklungsplan Gas 2018-2028”
2 Thereof approx. 7,730km fully owned by OGE
7
Strong Position in German Gas Market Value Chain
German Gas Market Value Chain Key Facts
OGE focuses on design, construction and operation
Trader/Producer of gas transmission pipelines
OGE’s customer base consists of
Producers and traders
Distribution network operators
TSOs Power plants and large industrial
facilities
OGE’s long-term revenues are determined by
regulation
Distribution
Networks OGE is the backbone of the market area
NetConnect Germany (NCG)
End Customers
8German Regulatory Regime: A Stable & Predictable Framework
Principles of Incentive Regulation
Regulatory
Allowed revenue is determined for regulatory periods of 5 years
Periods (RP)
Determined through “base year” costs and Regulated Asset Base (RAB)
Revenue Cap Revenues Operating Return
set by BNetzA = Costs
+ Depreciation + on equity
Annual adjustments for inter alia:
Inflation (consumer price index Germany) vs. general productivity factor
Individual efficiency factor
Highly volatile OPEX (e.g. fuel gas)
Incentive Regulation
Non influenceable cost items (e.g. pension costs)
Expansion / restructuring CAPEX via investment measure (IMA) mechanism
Differences between allowed and actual revenues compensated with 3 year sliding average
mechanism (mainly deviations of volume and volatile costs)
Regulatory framework promotes IMA, which are included in the Network Development Plan (NDP)
Remuneration of NDP is a well established process and provides high certainty to TSOs’ investments
Expansion CAPEX Under IMA mechanism new assets earn imputed cost of capital and operating expenses (lump sum)
already during construction phase
9Determination of Key Regulatory Parameters for 3rd RP
9.05% 7.14% 4.19 % 6.91% 5.12% 3.03 %
2nd Regulatory Period (2013-2017) 3rd Regulatory Period (2018-2022)
2017 2018 2022
2015 2016 2017 2018 - 22
Cost base
Individual efficiency General efficiency Return on Equity 3rd RP
application
Final confirmation of
score Xind
factor Xgen
Preliminary individual On 21 February Pronouncement of judgement on 22 March:
BNetzA determination revoked
cost base for 3rd RP efficiency factor of BNetzA BNetzA appeal to Federal Court (BGH)
on 31 May 100% for 3rd RP determined the against first instance judgement
final Xgen factor at
Final clarification by BGH not expected before
a value of 0.49%
2020
Revenue Cap 2018-22
Revenue Cap decision received,
legally binding since 16 July
(incl. 100% individual efficiency)
Stable & supportive regulatory framework for 3rd Regulatory Period
New Old
LEGEND Assets Assets Return on imputed equity Return on excess equity and debt
10OGE share of €2.3bn in 10 year Network Development Plan
NDP well established process Total CAPEX draft NDP 2018: €7.0bn
NDP provides high certainty to TSOs regarding investments OGE CAPEX draft NDP 2018: 32% (€2.3bn)
Updated bi-annually following public consultation
Draft NDP 2018 confirms OGE´s NDP 2016 projects
Implications regulatory framework
Regulatory framework promotes investment measures
New assets earn imputed cost of capital
(imputed equity interest + imputed trade tax)
already during construction phase
Operating expenses are covered in a lump sum approach1
Required investments continuously add to revenue growth!
1 General lump sum of 0.8% of investment amount for pipelines, 5.2% for natural gas compressors and 5.8% for gas pressure regulation and metering equipment.
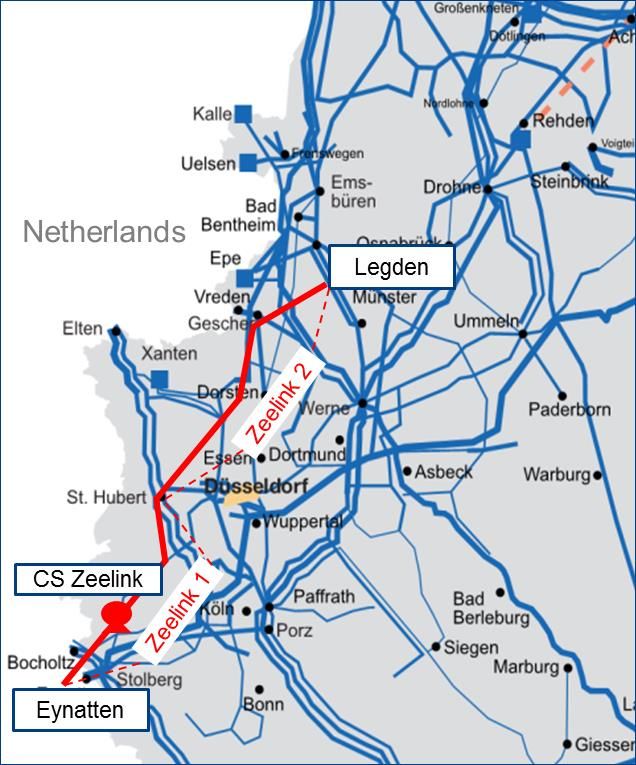
11ZEELINK: The Key to L-/H-Gas Conversion
One of the largest NDP projects
Connecting key European gas infrastructures e.g. LNG
Terminal Zeebrugge, TENP and OGE grid
Ownership: 75% OGE, 25% Thyssengas
Prerequisite for L-/H-Gas Conversion
Key figures
€0.7bn NDP Budget
Length: approx. 220 km
Diameter: 1,000 mm
Pressure: 100 bar
5 pressure reduction & metering stations
Compressor station in Würselen
Commissioning date 2021
121 Key Investment Highlights
2 Business Profile
3 Financing Overview
4 Conclusion & Transaction Details
5 Appendix
13Group Ownership Structure: Experienced Long-Term Investors
Simplified Group Structure Shareholder Composition
Shareholding Structure
18.73%
32.15%
100%
Vier Gas Services GmbH & Co. KG
100%
24.13%
Vier Gas Transport GmbH 24.99%
British Columbia Investment Management (BCI)
100%
ADIA (Infinity Investments)
1
Macquarie (MEIF4) and associated LP
Open Grid Europe GmbH
Munich Re (MEAG)
1 97.7% MEIF4 and 2.3% Halifax Regional Municipality Master Trust
14VGT Financials Reflect Stable & Predictable Business
EBITDA1 and Revenues (€m) CAPEX (€m)
Continued strong performance and high margins, based on efficient regulated business
Revenue variation as a result of regulatory account effects
Growing CAPEX reflects investments under NDP
1 Incl. equity income
15EBITDA & CAPEX Outlook 2018
EBITDA slightly above 2017 CAPEX in line with 2017
2018 characterised by stable EBITDA and high level of investments due to NDP
Regulatory decisions on major parameters for 3rd RP (2018-2022)
Decision on revenue cap 2018-2022 received, result in line with expectations
Pending issues: Decision on regulatory account balance & outcome of complaint proceedings regarding general
efficiency factor and return on equity
16Maturity Profile of VGT Group (as of 30 June 2018)
TOTAL MATURITIES
Vier Gas Transport € 2,390m
Pipeline Companies1 € 311m
600
TOTAL € 2,701m
71 26
Financing
Volume
(in €m)
750 750 750
140 102 25 16
71
2018 2019 2020 2021 2022 2023 2024 2025 2026 2027 2028 2029
1
ECP VGT Bonds VGT RCF VGT (undrawn) Financings Pipeline Companies
€600m RCF increased from €200m in 2017, maturity extended to 2023
Liquidity
€500m Commercial Paper Programme established in March 2018
1Pro-rata share (51%) / Financings include term loans, certificates of indebtedness (“Schuldscheindarlehen”), registered bonds
(“Namensschuldverschreibungen”) and drawings under committed credit facilities
17Management & Shareholders Committed to
Strong Investment Grade Rating
Ensure rating stability and continue to position OGE as a “defensive” asset among the investor community
Financial
Demonstrate to the regulator that the group continues to be managed in a prudent fashion
Policy
Ensure that the group maintains a comfortable liquidity position to cover its funding needs
The dividend policy is based on the financial policy of the group
The members of the consortium generally see OGE as a long-term investment, ensuring their common
Dividend
interest to follow a sustainable financial and dividend policy
Policy
The consortium is composed of large and diversified investors with the flexibility to adjust dividends in case
the company’s operations and/or investment activities require
18S&P’s Credit Rating — “A- stable outlook”
“The outlook revision reflects increased visibility on the impact of a
regulatory period reset beginning 2018, and our expectation of the
company's ongoing solid cash flow generation from regulated
Stable earnings.”
Outlook “The stable outlook reflects our view that OGE's credit metrics will
gradually recover following a decline in 2018 due to lower remuneration
after a regulatory period reset beginning in 2018, as well as elevated
capex as per the Network Development Plan (NDP).”
“We continue to view OGE's business risk profile as excellent, which
benefits from the low-risk environment in the regulated utilities
industry, including our view of the regulatory framework for the group's
gas transmission network being relatively stable and predictable”.
Regulation
“In the coming two years about 70%-80% of the company´s total capital
expenditures (capex) will fall under the so-called “investment
measures” (IM), for which we see limited execution risk and anticipate
full and immediate cost recovery.”
“OGE's liquidity profile is further supported by its well-established
Liquidity relationships with its core banks, no financial covenants, and prudent
risk management.”
Business Risk Profile: Excellent
“We expect adjusted FFO to debt will remain above 10% in 2018, and
Financial Risk Profile: Significant FFO/
thereafter recover to about 12% by 2020 thanks to increasing regulated
Debt Outlook earnings.”
Liquidity Position: Adequate
Source: Bjoern Schurich & Alf Stenqvist, “Open Grid Europe Group Outlook Revised to Stable From Negative On Increased Visibility After Regulatory Reset”, Standard & Poors, 30th of April, 2018,
material is reproduced with permission of Standard & Poor’s Financial Services LLC
191 Key Investment Highlights
2 Business Profile
3 Financing Overview
4 Conclusion & Transaction Details
5 Appendix
20Excellent Business Profile Underpinned by Stable & Predictable
Nature of the Business
Strong Market Position
Stable Regulated Business
Predictable CAPEX with regulated return
Robust Financial Profile
Experienced Operator
A- Rated German Gas Infrastructure Business
21Summary of Proposed Terms & Conditions
Issue Senior Unsecured Notes
Issuer Vier Gas Transport GmbH
Issuer rating A-/Stable/A-2 by S&P
Issue rating A- expected
Currency EUR
Amount EUR 500m (no grow)
Tenor Target maturity of 10 years
New Issue Coupon Fixed, payable annually, Act / Act (ICMA)
Redemption Bullet
Documentation Neg pledge, Pari passu, x-default, Make-whole call, 3-months par call, Clean up call (80%)
Denominations EUR 100k + 100k
Uses of Proceeds General Corporate Purposes
Listing Luxembourg (Regulated Market)
Governing Law German
Distribution Regulation S only
221 Key Investment Highlights
2 Business Profile
3 Financing Overview
4 Conclusion & Transaction Details
5 Appendix
23Treasury Contacts & Ongoing Investor Engagement
Axel Berndt Sebastian Brauer
Contacts Head of Finance, Accounting & Tax Head of Corporate Finance & Treasury
Viergas
Website
Email Phone Website
info@viergas.de +49 201 384 58 740 www.viergas.de
24Glossary
ARegV Anreizregulierungsverordnung (Ordinance on Incentive Regulation)
BNetzA Bundesnetzagentur (German Federal Network Agency for Electricity, Gas, Telecommunications, Post and Railway)
EnWG Energiewirtschaftsgesetz (German Energy Industry Act)
FNB Gas Vereinigung der Fernleitungsnetzbetreiber Gas (Association of German Gas TSOs)
HGB Handelsgesetzbuch (Code of commercial law for companies in Germany/“German GAAP”)
LNG Liquefied Natural Gas
IMA / IM Investitionsmaßnahme (Investment Measure)
NDP Network Development Plan
RP Regulatory Period
TSO Transmission System Operator
25EBITDA of VGT Group per Q2 2018 Significantly Above Prior Year
Key Financials 1st Half of 2018 (€m)1
EBITDA CAPEX
Comments
Transport revenues above prior year level CAPEX significantly below prior year due to timing effects
Planned tariff increase Main projects (NDP2):
Higher volumes than anticipated Pipeline Schwandorf-Forchheim-Finsing
Service revenues slightly above prior year Compressor station (CS) Herbstein
Operating and other expenses slightly below prior year Machine units at CS Werne
1 IFRS Condensed Interim Consolidated Financial Statements of Vier Gas Transport GmbH as of 30 June 2018. Aggregated figures may contain rounding differences.
2 NDP = Network Development Plan
26VGT Group Income Statement
1st Half of 2018 (€m)1
Income Statement
YTD YTD
[€m] ∆
Q2 2018 Q2 2017
Transport & related revenues 450 417 +33
Other revenues 54 52 +2
Total revenues 504 469 +35
Other income 17 19 -1
Cost of materials -137 -135 -2
Personnel costs -79 -79 -0
Other expenses -33 -40 +7
Equity income 6 2 +3
EBITDA 279 236 +42
Depreciation -72 -77 +5
EBIT 207 160 +47
Interest result -27 -32 +5
Current taxes -62 -49 -12
Deferred taxes 10 12 -2
Net Income 128 90 +37
1 IFRS Condensed Interim Consolidated Financial Statements of Vier Gas Transport GmbH as of 30 June 2018. Aggregated figures may contain rounding differences.
27VGT Group Balance Sheet
1st Half of 2018 (€m)1
Balance Sheet
[€m] Assets Equity and Liabilities [€m]
Q2 2018 Q4 2017 ∆ Q2 2018 Q4 2017 ∆
Non-current assets Equity
Intangible assets 40 42 -2 Subscribed capital 0 0 +0
Goodwill 830 830 +0 Additional paid-in capital 926 926 +0
Property, plant and equipment 3,422 3,346 +76 Retained earnings 188 140 +49
Financial assets 146 154 -8 Accumulated OCI -2 -2 +0
at equity method 113 121 -8 Total equity 1,112 1,064 +49
other financial assets 32 33 -0
Deferred tax assets 27 27 +0 Non-current liabilities
Non-current receivables 39 40 -1 Provisions for pensions 140 130 +10
Total non-current assets 4,505 4,439 +66 Other provisions 95 93 +3
Financial liabilities 2,554 2,553 +1
Current assets Other non-current liabilities 29 29 -0
Inventories 35 30 +4 Deferred tax liabilities 483 493 -10
Trade receivables 24 34 -10 Total non-current liabilities 3,302 3,298 +3
Recievables from tax creditors 5 14 -8
Other receivables 51 37 +14 Current liabilities
Cash and cash equivalents 151 106 +45 Other provisions 31 34 -3
Total current assets 266 221 +45 Financial liabilities 181 108 +73
Trade payables 44 82 -38
Income tax liabilities 1 0 +1
Other liabilities 99 74 +26
Total current liabilities 357 298 +59
Total 4,771 4,660 +111 Total 4,771 4,660 +111
1 IFRS Condensed Interim Consolidated Financial Statements of Vier Gas Transport GmbH as of 30 June 2018. Aggregated figures may contain rounding differences.
28VGT Group Cash Flow Statement
1st Half of 2018 (€m)1
Cash Flow Statement
YTD YTD
[€m] ∆
Q2 2018 Q2 2017
Net Income 128 90 + 37
Operating Cash Flow 263 191 + 72
Investing Cash Flow -175 -204 + 29
Free Cash Flow 87 -13 + 101
Financing Cash Flow -43 -23 - 20
Total Cash Flow of the period 45 -36 + 81
Cash Position beginning of period (01.01.) 106 189 - 83
Cash Position end of period (30.06.) 151 153 -2
1 IFRS Condensed Interim Consolidated Financial Statements of Vier Gas Transport GmbH as of 30 June 2018. Aggregated figures may contain rounding differences.
29You can also read