Transmission dynamics of foot and mouth disease in selected outbreak areas of northwest Ethiopia
←
→
Page content transcription
If your browser does not render page correctly, please read the page content below
Epidemiology and Infection                            Transmission dynamics of foot and mouth
        cambridge.org/hyg
                                                              disease in selected outbreak areas of
                                                              northwest Ethiopia
                                                              B. Tadesse1,2, W. Molla1, A. Mengsitu1 and W. T. Jemberu1
        Original Paper
                                                              1
        Cite this article: Tadesse B, Molla W, Mengsitu         University of Gondar, College of Veterinary Medicine and Animal Sciences, Department of Veterinary
        A, Jemberu WT (2019). Transmission dynamics           Epidemiology and Public Health, P.O. Box. 196, Gondar, Ethiopia and 2Amedguya Sheep Breed Improvement and
        of foot and mouth disease in selected                 Multiplication Center, P.O. Box. 30, North Shoa, Ethiopia
        outbreak areas of northwest Ethiopia.
        Epidemiology and Infection 147, e189, 1–6.
                                                                Abstract
        https://doi.org/10.1017/S0950268819000803
                                                                Foot and mouth disease (FMD) is a highly contagious and economically important disease
        Received: 7 December 2018                               of cloven-hoofed animals, which is endemic in Ethiopia. An outbreak follow-up study was
        Revised: 29 March 2019
        Accepted: 6 April 2019
                                                                undertaken to quantify the transmission parameters of FMD in the crop–livestock mixed
                                                                (CLM) system and commercial dairy farms in selected areas of northwest Ethiopia. The trans-
        Key words:                                              mission parameters were quantified using a generalised linear model (GLM) based on a
        Cattle; foot and mouth disease; northwest               susceptible–infectious–recovered (SIR) epidemic model. The per day average transmission
        Ethiopia; reproduction ratio; transmission rate
                                                                rate between animals was 0.26 (95% CI 0.22–0.32) and 0.33 (95% CI 0.21–0.57) in the
        Author for correspondence:                              CLM system and in the commercial dairy farms, respectively. The average basic reproduction
        W. Molla, E-mail: Mollawassie@yahoo.com                 ratio of FMD was 1.68 (95% CI 1.42–2.07) in the CLM system and 1.98 (95% CI 1.26–3.42) in
                                                                the commercial dairy farms. The medium per day transmission rate and moderate basic
                                                                reproduction ratio observed in this study indicated that a vaccination coverage needed to
                                                                stop transmission of the disease in these populations might not be very high.

                                                              Introduction
                                                              Ethiopia has approximately 59.5 million cattle, 30.7 million sheep and 30.2 million goats [1].
                                                              Livestock production in Ethiopia broadly classified into three systems: crop–livestock mixed
                                                              (CLM), pastoral and market-oriented production systems. The dominant production system
                                                              is the CLM system, which accounts for about 80–85% of the cattle population [2]. The pastoral
                                                              production system is the second most dominant farming system, which is commonly practiced
                                                              in the arid and semiarid peripheral parts of the country, and accounts for about 15–20% of the
                                                              cattle population [2]. The third type of production system is market-oriented production in
                                                              urban and peri-urban parts of the country, which is very small and primarily consists of
                                                              dairy cattle and to some extent feedlots. The contribution of the livestock sector to the national
                                                              economy is minimal compared to its potential. One of the main reasons for this is the wide-
                                                              spread occurrence of many infectious diseases, such as foot and mouth disease (FMD), which
                                                              drastically reduces the production and productivity of livestock [3].
                                                                  FMD is a contagious trans-boundary and economically devastating viral disease of cloven-
                                                              hoofed animals including both domestics and wildlife species [4, 5]. Foot and mouth disease
                                                              virus (FMDV) that is classified within the genus Aphtovirus and family Picornaviridae causes
                                                              the disease. FMDV consists of seven different serotypes (A, O, C, Asia1, SAT (South African
                                                              territories) 1, SAT2 and SAT3) with many subtypes [6]. It is characterised by vesicular erup-
                                                              tions in the oral cavity, foot and udder; these lesions are associated with fever, lameness,
                                                              salivation and anorexia [7]. The virus can be transmitted either directly, e.g. via contact
                                                              with an infected host/s [8, 9], or indirectly, e.g. via contact with a contaminated environment
                                                              with FMDV-infected secretions and excretions [10, 11].
                                                                  The transmission dynamics of infectious diseases like FMD have important effects on the
                                                              epidemiology of the disease and measures that can be taken to control them. A parameter
                                                              often used to describe the magnitude of transmission is the basic reproduction ratio (R0).
        © The Author(s) 2019. This is an Open Access          The R0 is defined as the average number of secondary infections caused by one typical infec-
        article, distributed under the terms of the
                                                              tious individual in a fully susceptible population during its entire infectious period [12].
        Creative Commons Attribution licence (http://
        creativecommons.org/licenses/by/4.0/), which          Whether an outbreak spreads or dies out depends on whether the R0 is greater than or less
        permits unrestricted re-use, distribution, and        than one. If R0 exceeds one, an infected animal infects on average more than one susceptible
        reproduction in any medium, provided the              animal, and thus it may cause a major outbreak, but if R0 is smaller than one, the disease will
        original work is properly cited.                      die before being generalised to a major outbreak [13, 14]. A limitation of R0, however, is that it
                                                              does not include a time factor, which is important in epidemic modelling to analyse the course
                                                              of the epidemic. A suitable parameter to use in modelling that does have a time dimension is
                                                              the transmission rate (β), which is defined by the average number of new infections caused by
                                                              one infectious individual per unit of time [15].

Downloaded from https://www.cambridge.org/core. IP address: 46.4.80.155, on 17 Oct 2020 at 23:42:17, subject to the Cambridge Core terms of use, available at https://www.cambridge.org/core/terms.
https://doi.org/10.1017/S0950268819000803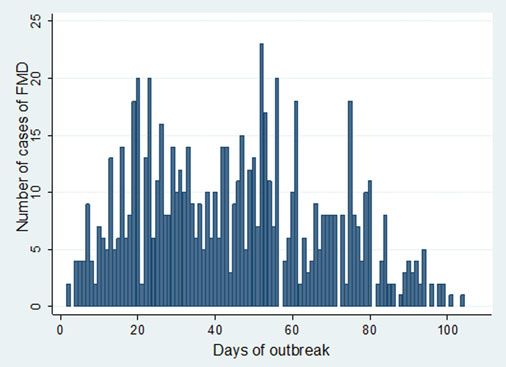
2 B. Tadesse et al.
To understand the transmission behaviour of FMDV and be FMD. While the two kebeles (Tsion and Enfranz) included in
able to predict its transmission dynamics, quantification of the study from Gondar zuria district are separated by a mountain
FMDV transmission parameter is essential. Quantification of R0 range that limits animal contact between these two kebeles, so
for FMDV can be performed by using field data [16] and data they were taken as two different epidemiological units. Each
from animal experiments [17]. Different authors determine R0 commercial dairy farm was taken as a separate epidemiological
for FMD in different settings using different approaches. For unit. Most of the animals in the CLM type of herds are
example, R0 was quantified from the final size of infection in local Zebu breed, while animals in the commercial herds are
sheep as 1.1 [9], from transmission experiment in cattle as 2.52 Holstein-Friesian local Zebu cross.
[8] in the Netherlands and from sero-prevalence data in cattle
in Ethiopia as 1.45 [18].
Outbreak follow-up and infection status of animals
FMDV is endemic in Ethiopia in all production systems since
it was first recorded in 1957 [19] and a large number of outbreaks Monitoring of the FMD outbreaks was done from September
were reported every year [20, 21]. Based on data over the years 2017 to May 2018 in Estie district (in three affected kebeles),
2007–2012, the annual district-level incidence of FMD outbreaks Gondar zuria district (in two affected kebeles) and Gondar
was estimated at 0.24, 0.39 and 0.85 per district year in the CLM, town (in five affected dairy farms) to study the transmission
pastoral and market-oriented systems, that are caused by sero- dynamics of FMD outbreaks. Follow-up of herds and field case
types O, A, SAT 2 and SAT 1 [22]. Different studies undertaken observations were conducted in the outbreak-affected kebeles
on FMD so far also revealed the existence of the disease in differ- during the active outbreak periods.
ent parts of the country, with different sero-prevalence ranging FMD outbreak-affected kebeles in each district were identified
from 5.6% to 24.2% [21, 23, 24, 25, 26, 27, 28]. Quantitative infor- from the records of district veterinary offices. In each district, the
mation on the transmission dynamics of FMD is essential in follow-up study started immediately after the FMD index case
order to make sound decisions about its control. Despite a large observed in the districts. In kebeles affected by the outbreak,
number of FMD outbreaks reported in Ethiopia every year, its herds were visited once per week to check the occurrence of
transmission dynamics have not been properly quantified before. FMD cases until the end of the outbreak. If a case was found in
Therefore, the current study was undertaken with the objective of a herd, the infection chain within the herd was monitored by vis-
determining the transmission rate and reproduction ratio of FMD iting the affected herd twice a week until the end of the outbreak
using field outbreak data collected from some selected areas of and the FMD status (susceptible, infected and recovered) of all
northwest Ethiopia. animals were recorded. Animals showing lameness, salivation
(drooling), smacking of the lips, grinding of teeth, vesicles/lesions
in the mouth (on the tongue, gum, cheeks, lips), unwillingness to
Materials and methods move or stand, significant drop in milk production, and high
Description of the study area morbidity and low mortality in the herd were considered FMD
cases [29]. Herd owners were asked to record new cases each
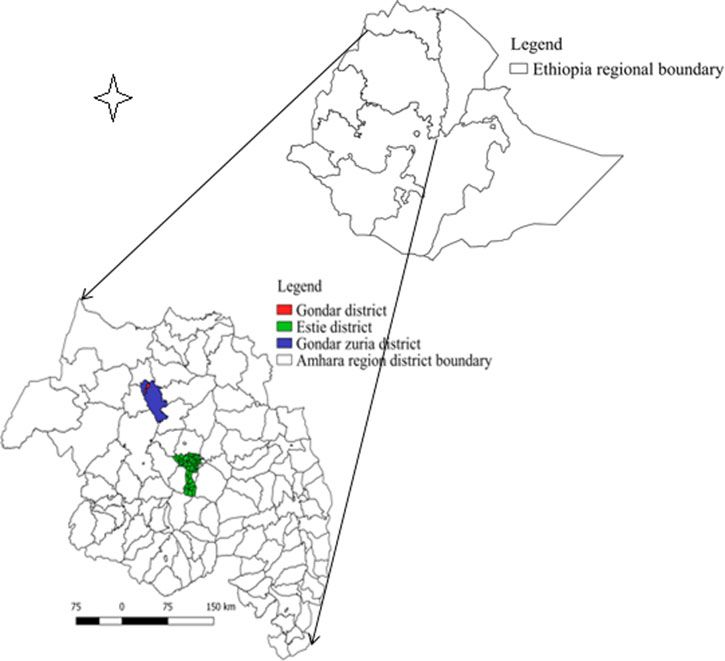
The study was conducted in two districts in the CLM production day and report to the investigator. At the start of the study, all cat-
system (Estie district of South Gondar zone and Gondar zuria dis- tle, sheep and goat in the affected kebele in the CLM production
trict of North Gondar zone) and five commercial dairy farms in system were assumed susceptible. In the commercial dairy farms,
Gondar town (Fig. 1). These districts and Gondar town were all animals on the farm were taken as susceptible. In this study,
selected for study because of the current FMD outbreak during animals were considered infected when they showed clinical
the time. signs of FMD during the follow-up period of the outbreak.
Animals were registered as a new case on the date they were
reported or seen with FMD clinical signs and as infectious on
Study herds, animals and animals contact patterns
the same day [30]. Infected cattle were assumed to stay infectious
The study populations were household herds (group of animals on average for 6 days, whereas sheep and goats were assumed to
that may comprise cattle, sheep or goat and owned by a house- stay infectious on average for 28 days. These infectious periods
hold for subsistence) in FMD outbreak-affected kebeles (the smal- were determined by taking into account the duration of virus iso-
lest administrative unit in Ethiopia) for CLM system and lation in blood and oropharyngeal swab for 5.5 (95% CI 4.5−6.7)
FMD-affected dairy herds in the commercial dairy system. days [11] and in saliva for 10 days [31] for cattle, and 52 days [32]
A total of 1296 herds: 745 herds from Estie district, 546 herds and 28 days (95% CI 19–42) [17] for sheep. Animals that died
from Gondar zuria district and five commercial dairy farms before the completion of the infectious period were considered
from Gondar town were used for the transmission study. These infectious only for the days they lived after being infectious.
herds comprise 16 984 animals: 8706 animals from Estie district, Parallel to the transmission follow-up, samples from FMD
8190 animals from Gondar zuria district and 88 animals from clinically infected animals (vesicular fluids and epithelium from
Gondar town commercial dairy farms. ruptured vesicles in the oral cavity and inter-digital space) were
The animals’ contact network depends on a number of factors, collected and tested using antigen detection ELISA following
including housing system, herd size, nature of grazing lands, the procedure described by OIE [33] at the National Animal
watering points, herd density and availability of main livestock Health Diagnostic and Investigation Center, Sebeta, Ethiopia to
transporting roads within the district. Animals in Estie and confirm that the clinically observed disease was truly FMD.
Gondar zuria districts were managed extensively, whereas the
five dairy farms in Gondar town managed intensively. In Estie
Quantification of FMD transmission parameters
district, animals from different kebeles regularly mix at communal
grazing areas and watering points, so that they all were considered The transmission parameters were estimated based on a SIR
as one epidemiological unit for studying the transmission of epidemic model in which individuals in the population were
Downloaded from https://www.cambridge.org/core. IP address: 46.4.80.155, on 17 Oct 2020 at 23:42:17, subject to the Cambridge Core terms of use, available at https://www.cambridge.org/core/terms.
https://doi.org/10.1017/S0950268819000803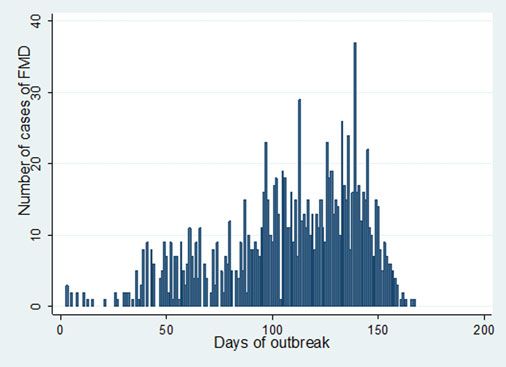
Epidemiology and Infection                                                                                                                                                     3

                                                                                                                                    Fig. 1. Map of Amhara region showing FMD trans-
                                                                                                                                    mission study sites.

        categorised either susceptible (S), infectious (I) or recovered and                        transmission rate β (β = eb, where b is the coefficient of the
        immune (R). During the study, the numbers of infectious, suscep-                           intercept of the model) was quantified using GLM [38] with
        tible and recovered animals observed in each herd were recorded                            number of new cases as dependent variable, complementary
        at the start of each observation interval. Transmission of FMDV                            log log-LINK function, S as binomial total and the natural
        between animals was estimated from the relationship between                                logarithm of (I×Δt/N) as the offset variable using the GLM
        the number of infectious animals at the start of the time interval                         expression cloglog E(Ct/St) = ln(β) + ln(I×Δt/N). Finally, R0 was
        and the number of newly infected animals at the end of the time                            estimated by multiplying β with the average length of the
        interval.                                                                                  infectious period [11, 36].
            The transmission rate parameter was estimated by a GLM [11,
        34, 35] based on a stochastic SIR epidemic model [36] in which
                                                                                                   Data management and statistical analysis
        transmission of FMD between individuals are described by the
        change in the number of susceptible, infectious and recovered ani-                         The data collected from the field case follow-up was entered into
        mals. In the SIR model, susceptible animal becomes infected with                           an Excel spreadsheet and the data were checked for errors of entry
        a rate of                                                                                  and then imported to STATA version 12 for analysis. The GLM
                                                                                                   was used to estimate the transmission rates. Statistical analyses
                                dS/dt = −b × I(t) × S(t) /N(t)                                     were also conducted to test the significance of differences in trans-
                                                                                                   mission rate between production systems. A P-value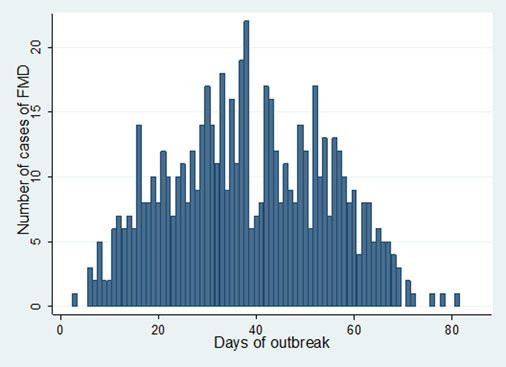
4                                                                                                                                                          B. Tadesse et al.

       Fig. 2. Epidemic curve of FMD in Estie district, northwest Ethiopia in 2017/18.            Fig. 3. Epidemic curve of FMD in Enfranz area, northwest Ethiopia in 2017/18.

           In Estie district, the FMD outbreak started at the end of
       August 2017 and continued until the end of February 2018, but
       in Gondar zuria district and Gondar town, the outbreak started
       at the first week of October 2017 and ended in the last week of
       February 2018. The epidemic curve of FMD outbreaks in Estie
       district and in Enfranz and Tsion Kebeles of Gondar zuria district
       are presented in Figs 2, 3 and 4, respectively. The outbreaks in all
       study areas were confirmed as FMD and the causal virus was
       identified as serotype O by antigen detection ELISA.

       Transmission parameters of FMD
       The transmission rate between animals in the CLM production
       system was 0.31 (95% CI 0.27–0.36), 0.23 (95% CI 0.19–0.31)
       and 0.24 (95% CI 0.20–0.31) per day in Estie, Tsion and
       Enfranz, respectively, whereas in the commercial dairy farms,
       it varied from 0.21 (95% CI 0.09–0.48) to 0.42 (95% CI 0.23–                               Fig. 4. Epidemic curve of FMD in Tsion area, northwest Ethiopia in 2017/18.
       0.73) in the different farms (Table 1). The average transmission
       rate between animals in the commercial dairy farms was 0.33
       (0.26–0.42) per day, but it was 0.26 (95% CI 0.22–0.32) in the                             CLM and 0.21–0.42/ day in commercial dairy farms). The average
       CLM production system (Table 1). There was a significant differ-                           per day transmission rates of FMD between animals estimated in
       ence (P < 0.05) in the average transmission rate between animals                           this study were higher than the transmission rate from sheep to
       in the CLM production system and commercial dairy farms.                                   cattle (0.037) reported previously [17]. This might be because of
       A reproduction ratio of 2.12, 1.45 and 1.52 between animals                                the difference in the study population and management of
       was estimated in the CLM production system in Estie, Tsion                                 animals.
       and Enfranz areas, respectively, while the average R0 value for                               It is widely believed that FMDV is transmitted from infected to
       CLM production system was 1.68. In commercial dairy farms,                                 susceptible hosts directly or indirectly through contaminated
       R0 values between animals were varying from 1.26 to 2.52,                                  environment and/or fomites [8, 11]. However, in this study, it
       while the average R0 value was 1.98 (Table 1).                                             was impossible to identify clearly, which specific infected animal
                                                                                                  transmitted the infection to which susceptible animal in the trans-
                                                                                                  mission chain due to the mixing up of animals at common graz-
       Discussion
                                                                                                  ing areas and watering points and hence it was difficult to separate
       To the best of our knowledge, this is the first study in Ethiopia in                       the transmission as direct and or indirect (environmental). Due to
       which the transmission parameters for FMD have been quantified                             the mixed nature of herds (i.e. cattle, sheep and goats) in the CLM
       from real outbreak situations in the field. This knowledge is help-                        system, it was also not possible to know from which species an
       ful to understand the disease transmission dynamics and design                             animal acquired the infection and the estimated transmission
       sets of measures that efficiently control the disease.                                     rate includes both the intraspecies and interspecies transmissions.
           In this study, the average between animal transmission of                                 In this study, the estimated R0 values were in the range 1.45–
       FMDV was estimated at 0.26/day for CLM system and 0.33/day                                 2.12 between animals in the CLM production system with an
       for the commercial farms with some variations among the epi-                               average value of 1.68. This value is higher than the R0 of 1.45 pre-
       demiological units within each system (0.23–0.31/day in the                                viously reported in Ethiopia in the CLM production system from

Downloaded from https://www.cambridge.org/core. IP address: 46.4.80.155, on 17 Oct 2020 at 23:42:17, subject to the Cambridge Core terms of use, available at https://www.cambridge.org/core/terms.
https://doi.org/10.1017/S0950268819000803
Epidemiology and Infection 5
Table 1. Transmission rate parameter and reproduction ratio of FMDV in CLM herds and within the five commercial dairy farms in northwest Ethiopia during the
2017/18 outbreaks
Average infectious
Production system District/farm No. of cases β (95% CI) per day period in days R0 (95% CI)
CLM Estie 1697 0.31 (0.27–0.36) 6.84 2.12 (1.85–2.46)
Tsion 775 0.23 (0.19–0.27) 6.20 1.45 (1.2–1.67)
Enfranz 1003 0.24 (0.21–0.27) 6.34 1.52 (1.33–1.71)
Average of all districts 3475 0.26 (0.22–0.32) 6.46 1.68 (1.42–2.07)
Commercial dairy farms Farm 1 7 0.32 (0.2–0.57) 6 1.92 (1.2–3.42)
Farm 2 8 0.42 (0.23–0.73) 6 2.52 (1.38–4.38)
Farm 3 8 0.21 (0.09–0.48) 6 1.26 (0.54–2.88)
Farm 4 11 0.36 (0.24–0.6) 6 2.16 (1.44–3.6)
Farm 5 14 0.34 (0.24–0.51) 6 2.04 (1.44–3.06)
Average of all farms 48 0.33 (0.21–0.57) 6 1.98 (1.26–3.42)
P = 0.001 for difference in average transmission rate between animals in the CLM production system and commercial dairy farms.
sero-prevalence data [18]. It is also higher than the report from Acknowledgements. The authors would like to acknowledge the National
sheep to cattle (1.0) [17] and from sheep to sheep (1.1) [9] and Animal Health Diagnostic and Investigation Center of Ethiopia for confirming
lower than other previous reports in intraspecies transmission the outbreak and the animal health personnel’s in the study districts for their
collaboration during data collection and to the farmers who participated and
in cattle of 2.52 [8] and ∞ (1.3−∞) [39]. As reported in the pre-
provided information for the study.
vious studies, the transmission from cattle to cattle is higher than
sheep to cattle and cattle are more infectious than sheep [8, 17]. Financial support. This work was supported by the University of Gondar.
The cattle population in the CLM production system in the cur-
rent study is higher (82%) than sheep and goat population (18%) Conflict of interest. None.
and this may increase the transmission rate between these mixed
populations than the sheep to sheep and sheep to cattle transmis- References
sion reported in the previous studies. The R0 in the CLM produc-
1. CSA (2017) Agricultural Sample Survey, 2016/17 (2009 E.C.), Volume II:
tion system in the current study is lower than the R0 in the
Report on livestock and livestock characteristics (Private peasant hold-
commercial dairy farms; this is due to the high rate of contact ings). Statistical Bulletin 585. Central Statistical Agency (CSA), Addis
of cattle in the commercial dairy farms. Ababa, Ethiopia: Federal Democratic Republic of Ethiopia.
The R0 values within the commercial dairy farms in the cur- 2. MoARD (2007). Livestock Development Master Plan Study. Phase I
rent study were in the range of 1.26–2.52 with an average value Report–Data Collection and Analysis. Volume V–Policy and Institutions.
of 1.98. These R0 values were lower than the R0 value of 4.4 quan- Ministry of agriculture and rural development, Government of Ethiopia,
tified from both direct and indirect transmission and 3.7 from dir- Addis Ababa, Ethiopia.
ect transmission reported from experimental studies in calves in 3. MoA and ILRI (2013) Animal health strategy and vision for Ethiopia.
the Netherlands [11] and R0 value of ∞ (1.3−∞) in unvaccinated Ministry of Agriculture and International Livestock Research Institute,
cattle in the Netherlands [39]; while it was close to the R0 value of Addis Ababa, Ethiopia.
4. Thomson GR, Vosloo W and Bastos AD (2003) Foot and mouth disease
2.52 reported in cattle in the Netherlands [8]. The difference
in wildlife. Virus Research 91, 145–161.
might be explained by the study type, different study population, 5. Goris N, Vandenbussche F and De Clercq K (2008) Potential of antiviral
the environmental difference and the production system set up. therapy and prophylaxis for controlling RNA viral infections of livestock.
In the current study, the average transmission rates were Antiviral Research 78, 170–178.
medium, 0.26 and 0.33 per day between animals in CLM produc- 6. Mort M et al. (2005) Psychosocial effects of the 2001 UK foot and mouth
tion system and the commercial dairy farms, respectively. The disease epidemic in a rural population: qualitative diary based study.
estimated between-animals R0 was greater than the threshold Biomedical Journal 331, 1234.
level and moderate both in the CLM production system and in 7. Grubman MJ and Baxt B (2004) Foot and mouth disease. Clinical
the commercial dairy farms. The moderate R0s estimated here Microbiology Reviews 17, 465–493.
indicate the vaccination coverage required to stop the disease 8. Orsel K et al. (2005) Vaccination against foot and mouth disease reduces
virus transmission in groups of calves. Vaccine 23, 4887–4894.
transmission is not very high. In the CLM production system,
9. Orsel K et al. (2007a) Quantification of foot and mouth disease virus
the R0 was quantified for a mixed population of cattle, sheep excretion and transmission within groups of lambs with and without vac-
and goat, but does not estimate the contribution of each species cination. Vaccine 25, 2673–2679.
to the total transmission. Therefore, future research should 10. Pharo HJ (2002) Foot and mouth disease: an assessment of the risks
focus on the estimation of the contribution of each species of ani- facing New Zealand. New Zealand Veterinary Journal 50, 46–55.
mals for the transmission of FMD and on the implementation 11. de Rueda et al. (2015) Quantification of transmission of foot-and-mouth
and evaluation of effective control measures that bring R0 below disease virus caused by an environment contaminated with secretions and
the threshold level. excretions from infected calves. Veterinary Research 46, 43–62.
12. Diekmann O, Heesterbeek JAP and Metz JA (1990) On the definition
Author ORCIDs. W. Molla, 0000-0003-0793-5960 and the computation of the basic reproduction ratio R0 in models for
Downloaded from https://www.cambridge.org/core. IP address: 46.4.80.155, on 17 Oct 2020 at 23:42:17, subject to the Cambridge Core terms of use, available at https://www.cambridge.org/core/terms.
https://doi.org/10.1017/S09502688190008036 B. Tadesse et al.
infectious diseases in heterogeneous populations. Journal of Mathematical zone, Somalia regional state, eastern Ethiopia. African Journal of
Biology 28, 365–382. Microbiology Research 5, 3559–3563.
13. Velthuis AG et al. (2002) Quantification of transmission in one-to-one 27. Zerabruk G, Romha G and Rufael T (2014) Sero-epidemiological inves-
experiments. Epidemiology and Infection 128, 193–204. tigation of foot and mouth disease in cattle managed under extensive
14. Van Roermund HJ et al. (2010) No between-pen transmission of husbandry system in Tigray, northern Ethiopia. Global Veterinary 13,
foot-and-mouth disease virus in vaccinated pigs. Vaccine 28, 4452–4461. 112–116.
15. De Jong MCM and Kimman TG (1994) Experimental quantification of 28. Mishamo S (2016) Isolation, Molecular Characterization and Sero-
vaccine-induced reduction in virus transmission. Vaccine 12, 761–766. Prevalence Study of Foot-And-Mouth Disease Virus Circulating In Central
16. Hagenaars TJ et al. (2011) Estimation of foot and mouth disease trans- Ethiopia. MSc Thesis Addis Ababa University Bishoftu, Ethiopia. pp. 41–46.
mission parameters, using outbreak data and transmission experiments. 29. FAO. Case definition of livestock disease 2010. Available at http://www.
Review on Scientifiqe Technique (International Office of Epizootics) 30, fao.org/docrep/014/al859e/al859e00.pdf. (Accessed 31 January 2019).
467–477. 30. Charleston B et al. (2011) Relationship between clinical signs and trans-
17. de Rueda CB et al. (2014) Estimation of the transmission of foot and mission of an infectious disease and the implications for control. Science
mouth disease virus from infected sheep to cattle. Veterinary Research 332, 726–729.
45, 58. 31. Parthiban ABR et al. (2015) Virus excretion from foot-and-mouth dis-
18. Jemberu WT (2016) Bioeconomic modelling of foot and mouth disease ease virus carrier cattle and their potential role in causing new outbreaks.
and its control in Ethiopia (Doctoral dissertation, Wageningen PLoS ONE 10, 6.
University). pp. 95. 32. Eblé PL, Orsel K and Dekker A (2012) FMDV infection in vaccinated
19. Martel JL (1974) Foot and mouth disease in Ethiopia. Distribution of ser- and non-vaccinated sheep: transmission to contact animals and diagnostic
otypes of foot and mouth disease virus. Review on Medicine Veterinary aspects. In Session of the Research Group of the Standing Technical
Pays Tropical 27, 169–175. Committee of EuFMD; 29–31 October 2012. Jerez de la Frontera: FAO
20. Ayelet G et al. (2012) Study on the epidemiology of foot and mouth dis- of the United Nations.
ease in Ethiopia. Journal of Emerging Infectious Disease 31, 789–798. 33. OIE. Manual of diagnostic tests and vaccines for terrestrial animals,
21. Desissa F et al. (2014) Epidemiological study on foot and mouth disease Chapter 2.1.8., 2018. Available at http://www.oie.int/fileadmin/Home/eng/
in cattle: seroprevalence and risk factor assessment in Kellem Wollega Health_standards/tahm/2.01.08_FMD.pdf. (Accessed 2 February 2019).
Zone, West Ethiopia. African Journal of Agricultural Research 9, 1391– 34. Heffernan JM, Smith RJ and Wahl LM (2005) Perspectives on the basic
1395. reproductive ratio. Journal of the Royal Society Interface 2, 281–293.
22. Jemberu WT et al. (2016) Epidemiology of foot and mouth disease in 35. Chowell G, Nishiura H and Bettencourt LM (2007) Comparative estima-
Ethiopia: a retrospective analysis of district level outbreaks. tion of the reproduction number for pandemic influenza from daily case
Transboundary Emerging Disease 63, 246–259. notification data. Journal of the Royal Society Interface 4, 155–166.
23. Sahle M (2004) An epidemiological study on the genetic relationships of 36. Velthuis AG et al. (2003) Design and analysis of an Actinobacillus
foot and mouth disease viruses in east Africa. University of Pretoria, Pleuropneumoniae transmission experiment. Preventive Veterinary
South Africa, Pretoria, PhD Thesis. pp. 84–107. Medicine 60, 53–68.
24. Jembere S (2008) Participatory epidemiology and seroprevalence of Foot 37. Velthuis AG, de Jong MCM and De Bree J (2007) Comparing methods
and Mouth Disease in Afar pastoral region, Ethiopia. MSc thesis, FVM, to quantify experimental transmission of infectious agents. Mathematical
AAU, Debre Ziet, Ethiopia. pp. 36–38. Biosciences 210, 157–176.
25. Mekonen H et al. (2011) Study on the prevalence of foot and mouth disease 38. McCullagh P and Nelder JA (1989) Generalized Linear Models. London,
in Borana and Guji Zones, southern Ethiopia. Veterinary World 4, 293–296. UK: Chapman and Hall, pp. 21–44.
26. Mohamoud A, Tessema E and Degefu H (2011) Seroprevalence of bovine 39. Orsel K et al. (2007b) The effect of vaccination on foot and mouth disease
foot and mouth disease (FMD) in Awbere and Babille districts of Jijiga virus transmission among dairy cows. Vaccine 25, 327–335.
Downloaded from https://www.cambridge.org/core. IP address: 46.4.80.155, on 17 Oct 2020 at 23:42:17, subject to the Cambridge Core terms of use, available at https://www.cambridge.org/core/terms.
https://doi.org/10.1017/S0950268819000803You can also read