Profitably and Sustainably Growing in West Africa - Virtual 33rd Annual ROTH Conference March 2021

Page created by Jimmie Adams
 
CONTINUE READING
Profitably and Sustainably Growing in West Africa - Virtual 33rd Annual ROTH Conference March 2021
Profitably and
    Sustainably Growing
       in West Africa
Virtual 33rd Annual ROTH Conference
                          March 2021
    VAALCO Energy, Inc.                NYSE: EGY   LSE: EGY
Profitably and Sustainably Growing in West Africa - Virtual 33rd Annual ROTH Conference March 2021
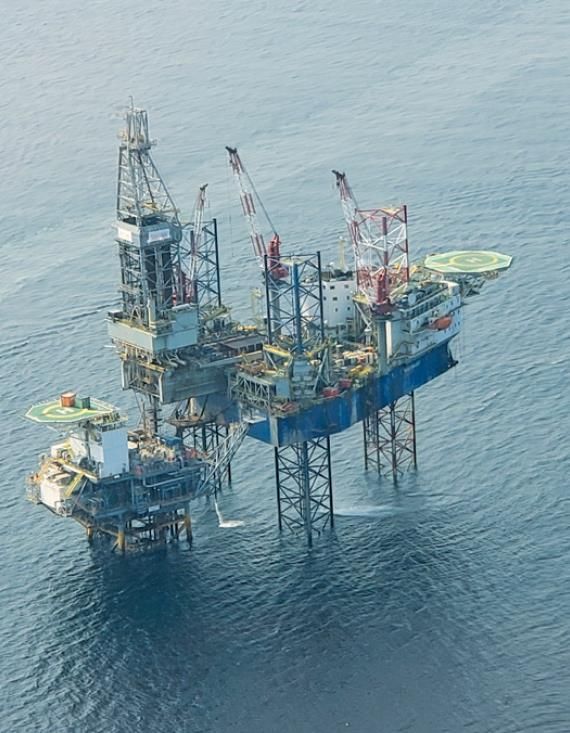
Safe Harbor Statement
This presentation is prepared by Vaalco Energy, Inc. (“VAALCO” or the “Company”) and does not carry any right of publication or disclosure, in whole or in part. This has been prepared for
information purposes only and it is not a prospectus for the purposes of the UK Prospectus Regulation Rules as it does not constitute an offer to the public. It is not intended to solicit the
dealing in securities, nor does it form part of any invitation, offer or sale or subscription or any solicitation for any offer to buy or subscribe for securities. This presentation does not form
the basis of, nor should it be relied upon in connection with or act as any inducement to enter into, any contract or commitment with respect to VAALCO’s securities.
This presentation contains "forward-looking statements" within the meaning of Section 27A of the Securities Act of 1933,as amended, and Section 21E of the Securities Exchange Act of
1934, as amended. All statements, other than statements of historical facts, included in this presentation that address activities, events, plans, expectations, objectives or developments
that VAALCO expects, believes or anticipates will or may occur in the future are forward-looking statements. These statements may include statements related to the pending transaction,
the impact of the COVID-19 pandemic, including the recent sharp decline in the global demand for and resulting global oversupply of crude oil and the resulting steep decline in oil prices,
production quotas imposed by Gabon, disruptions in global supply chains, quarantines of our workforce or workforce reductions and other matters related to the pandemic, well results,
wells anticipated to be drilled and placed on production, future levels of drilling and operational activity and associated expectations, the implementation of the Company’s business plans
and strategy, prospect evaluations, prospective resources and reserve growth, its activities in Equatorial Guinea, expected sources of and potential difficulties in obtaining future capital
funding and future liquidity, its ability to restore production in non-producing wells, future operating losses, future changes in crude oil and natural gas prices, future strategic alternatives,
future acquisitions, capital expenditures, future drilling plans, acquisition and interpretation of seismic data and costs thereof, negotiations with governments and third parties, timing of
the settlement of Gabon income taxes and expectations regarding processing facilities, production, sales and financial projections.
These statements are based on assumptions made by VAALCO based on its experience and perception of historical trends, current conditions, expected future developments and other
factors it believes are appropriate in the circumstances. Such statements are subject to a number of assumptions, risks and uncertainties, many of which are beyond VAALCO’s control.
These risks include, but are not limited to, crude oil and natural gas price volatility, the failure of the transaction to close, the impact of production quotas imposed by Gabon in response to
production cuts agreed to as a member of OPEC, inflation, general economic conditions, the outbreak of COVID-19, the Company’s success in discovering, developing and producing
reserves, production and sales differences due to timing of liftings, decisions by future lenders, the risks associated with liquidity, lack of availability of goods, services and capital,
environmental risks, drilling risks, foreign regulatory and operational risks, and regulatory changes. These and other risks are further described in VAALCO's annual report on Form 10-K for
the year ended December 31, 2020, quarterly reports on Form 10-Q and other reports filed with the SEC which can be reviewed at http://www.sec.gov, or which can be received by
contacting VAALCO at 9800 Richmond Avenue, Suite 700, Houston, Texas 77042, (713) 623-0801. Investors are cautioned that forward-looking statements are not guarantees of future
performance and that actual results or developments may differ materially from those projected in the forward-looking statements. Except as required by law, VAALCO disclaims any
intention or obligation to update or revise any forward-looking statements, whether as a result of new information, future events, or otherwise.
The SEC permits oil and gas companies, in their filings with the SEC, to disclose only proved, probable and possible reserves that meet the SEC’s definitions for such terms, and price and
cost sensitivities for such reserves, and prohibits disclosure of resources that do not constitute such reserves. The Company uses terms in this presentation, such as “potential reserves”,
“potential resources”, “2P”, “2P reserves”, “2C”, “EUR”, “contingent resources”, “net resources”, “recoverable resources”, “prospective resources”, “gross reserves and resource potential”,
“gross unrisked”, “unrisked gross resource”, “prospective mean resources”, “gross unrisked recoverable prospective and contingent resources” and similar terms or other descriptions of
volumes of reserves potentially recoverable that the SEC’s guidelines strictly prohibit the Company from including in filings with the SEC. These terms refer to the Company’s internal
estimates of unbooked hydrocarbon quantities that may be potentially added in accordance with the 2018 Petroleum Resources Management System approved by the Society of Petroleum
Engineers. These estimates are by their nature more speculative than estimates of proved, probable and possible reserves and accordingly are subject to substantially greater risk of being
actually realized. Actual quantities of reserves that may be ultimately recovered from the Company’s interests may differ substantially from those presented herein. Factors affecting
ultimate recovery include the scope of the Company’s ongoing drilling program, which will be directly affected by the availability of capital, decreases in oil and natural gas prices, drilling
and production costs, availability of drilling services and equipment, drilling results, lease expirations, transportation constraints, processing costs, regulatory approvals, negative revisions
to reserve estimates and other factors as well as actual drilling results, including geological and mechanical factors affecting recovery rates. Estimates of unproved reserves may change
significantly as development of the Company’s assets provides additional data. In addition, the Company’s production forecasts and expectations for future periods are dependent upon
many assumptions, including estimates of production decline rates from existing wells and the undertaking and outcome of future drilling activity, which may be affected by significant
commodity price declines or drilling cost increases.
Estimates of reserves provided in this presentation are estimates only and there is no guarantee that estimated reserves will be recovered. Actual reserves may be greater than or less than
estimates provided in this presentation and differences may be material. There is no assurance that forecast price and cost assumptions applied by NSAI or by the Company in evaluating
VAALCO’s reserves will be attained and variances could be material. References to thickness of oil pay or of a formation where evidence of hydrocarbons have been encountered is not
necessarily an indicator that hydrocarbons will be recoverable in commercial quantities or in any estimated volume. Well test results should be considered as preliminary and not
necessarily indicative of long-term performance or of ultimate recovery. Well log interpretations indicating oil accumulations are not necessarily indicative of future production or ultimate
recovery.

VAALCO Energy, Inc.                                                                    NYSE: EGY   LSE:
                                                                                                    LSE:EGY
                                                                                                         EGY                                                                              2
Profitably and Sustainably Growing in West Africa - Virtual 33rd Annual ROTH Conference March 2021
Established Operator Generating Free Cash Flow
 Recent Acquisition and Successful Drilling Programs Increase Size and Scale(1)
• International E&P focused on low-risk, producing assets in West
  Africa with net cash and significant cash flow generation
• Operator of Gabon offshore Etame license
         •     Participating interests: VAALCO (operator) 63.6%, Addax (Sinopec) 33.9%,
               PetroEnergy 2.5%

• Produced ~120 gross MMBO to date with remaining reserves and
  resources of ~113 gross MMBO at Etame(4)
                                                                                                                                                                                                                  Etame Marin Permit
• Highly successful 2019/2020 work program; resulting in ~40% year                                                                                                                                             Working Interest 58.8%
  over year increase in production for FY’20 to 4,853 NRI BOPD                                                                                                                                                        46,200 gross acres
                                                                                                                                                                                                                        27,200 net acres
• Accretive acquisition of Sasol’s WI at Etame nearly doubles VAALCO’s
  total net production and reserves
• Inventory of well locations available for multiple future drilling
  campaigns de-risked by new proprietary 3-D seismic data at Etame                                                                                                                                         Etame                                                  Gross                    WI(2)                 NRI(3)
                                                                                                                                                                        YE’20 SEC Proved Reserves (MMBO)(5)                                                         11.9                     7.0                   6.1
• 2021/2022 drilling program forecasted to increase gross production
                                                                                                                                                                        YE’20 2P CPR Reserves (MMBO)(6)                                                             33.7                   19.6                   17.1
  by 7,000 – 8,000 BOPD when program is completed
                                                                                                                                                                        YE’20 Resources (MMBO)(4)                                                                   78.8                   46.6                   40.5
• Significant potential in Equatorial Guinea with 98.7 MMBOE unrisked                                                                                                                       Equatorial Guinea
  working interest resources(4)                                                                                                                                         YE’20 Best Est Contingent Resources(4)                                                      24.4                   10.5
                                                                                                                                                                        YE’20 Best Est Prospective                                Resources(4)                     282.8                   88.2
                                                                                                                                                             4)   Netherland, Sewell & Associates, Inc. (“NSAI”) 12/31/2020 CPR report which includes 2P and contingent (“2C”) as well as VAALCO’s internal prospective
 VAALCO Energy, Inc. 1)   All numbers in the presentation include the impact of the Feb’21 Sasol transaction , reserve and resource
                          numbers as of YE’20 are on a proforma basis and include Sasol’s interest                                    NYSE: EGY   LSE: EGY        resource estimate                                                                                                             3
                     2)   Etame - 58.8% WI , Tullow is a 7.5% WI owner but not a joint owner; Block P – 43% WI                                               5)   “SEC reserves” are Netherland, Sewell & Associates estimates prepared in accordance with the definitions and regulations of the U.S. Securities and Exchange
                     3)   Net volumes are after royalty deduction of 13% for Etame                                                                                Commission as of December 31, 2020
                                                                                                                                                             6)   “2P CPR Reserves” are NSAI’s proved plus probable estimates prepared in accordance with the 2018 Petroleum Resources Management Systems approved
                                                                                                                                                                  by the Society of Petroleum Engineers as of 12/31/20 using VAALCO management assumptions
Profitably and Sustainably Growing in West Africa - Virtual 33rd Annual ROTH Conference March 2021
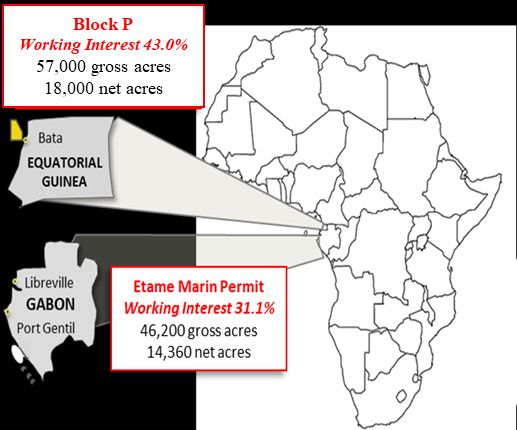
Etame Track Record of Success
                      Repeatable Ability to Create Value
                     140
                                     Etame Marin : Gross Proven EUR                                                                           •         Gamba reservoir plus deeper Dentale resource potential
                     120
                                                                                                                                              •         30 MMBO initial gross proven EUR at YE 2002
                     100
1P Reserves (MMBO)

                     80
                                                                                                                                              •         >120 MMBO gross barrels of oil produced
                     60                                                                                                                       •         ~131 MMBO gross proven EUR at YE 2020(1)
                     40
                                                                                                                                              •         Seven successful drilling programs over 20 years
                     20

                      0                                                                                                                       •         Three development wells drilled in 2019/2020

                     25,000
                                        Etame Marin : Production Gross BOPD                                                                   •         Infrastructure in place for continued development

                     20,000                                                                                                                   •         Typical gross development well cost:
                                                                                                                                                        $20 - $30 million
                     15,000
    BOPD

                     10,000                                                                                                                   •         2019/2020 drilling program cost ~$29 million, $4.30/ NRI
                                                                                                                                                        barrel of 2P reserves (2)
                      5,000

                           0

                      Etame 2002-2010       Avouma       Ebouri        Etame 2015           N. Tchibala         19/20 Drilling

                     VAALCO Energy, Inc.                                                                                                  NYSE: EGY         LSE: EGY                                                                            4
                                           1)   12/31/2020 NSAI SEC pricing reserve report
                                           2)   For purposes of this calculation, costs for the Etame 9P appraisal well have been excluded and 2P reserves includes NRI barrels of 3.3 million for the three completed wells plus 2.4 million
                                                for field life extension.
Profitably and Sustainably Growing in West Africa - Virtual 33rd Annual ROTH Conference March 2021
Vision 2025
Significant Success Already Achieved Towards Our Long-term Goals
                                                                                                                  2021/22 Etame
Since 2018 VAALCO has made material progress towards growth targets:                                               Work Program
                                                                                                                 Targeting 7,000 –
• Achieve material increase in scale as a premier Africa operator                                                8,000 Gross BOPD
    ↗ 2018 license extension increased license acreage by 60% and added a                                       Production Increase
       further 31 MMBO of Best Estimate Resources(1)
• Pursue value accretive M&A opportunities within strategic focus                                                World-Class Etame
    ↗ Acquisition of Sasol WI at Etame nearly doubles net production,                                             Asset Generates
       reserves and resources and increases free cash flow per barrel                                             Significant Free
                                                                                                                     Cash Flow
• Maintain operational excellence, cost discipline and strong balance sheet
    ↗ Best-in-class balance sheet, net cash, decreased opex per barrel by ~$5
       (~18%) YE’18 to YE’20                                                                                      ~100 MMBO WI
                                                                                                                  Resource Upside
• Execute work programs at Etame to grow production and reserves                                                    Potential at
                                                                                                                   Block P in EG(2)
     ↗ Highly successful 2019/2020 drilling program increasing production by
       6,900 BOPD between FY’19 and FY’20
• Unlock meaningful potential in Equatorial Guinea                                                                  Accretive
                                                                                                                  Opportunities,
    ↗ VAALCO appointed operator of asset in 2020. Active discussions to                                          New Ventures and
       partner with established company in exploration opportunity.                                                   M&A

VAALCO Energy, Inc.   1)   VAALCO’s internal reserve and resource estimate at 12/31/18   NYSE: EGY   LSE: EGY                5
                      2)   12/31/2020 NSAI CPR report
Profitably and Sustainably Growing in West Africa - Virtual 33rd Annual ROTH Conference March 2021
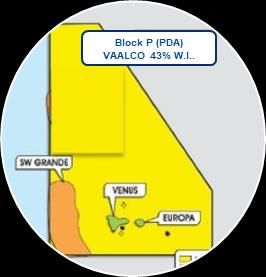
Sasol Acquisition Highlights
   Closed February 25, 2021 and Immediately Accretive to VAALCO

❑ Acquired an additional 27.8% WI in the VAALCO operated Etame Marin block offshore Gabon, increasing
  VAALCO’s total WI to 58.8%
❑ Nearly doubles VAALCO’s total net production and reserves
       ❑ Increases NRI production from 4,853 BOPD to 9,190 BOPD for FY 2020
       ❑ Acquired 2.7 MMBO of proved NRI reserves(1) as of February 25, 2021
       ❑ Acquired 7.9 MMBO of 2P CPR NRI reserves(1) as of February 25, 2021
       ❑ Estimated acquisition cost per NRI barrel of $14.41 for SEC proved reserves and $4.91 for 2P CPR reserves
❑ Acquisition Terms
       ❑ Agreed to $44 million purchase price and paid $4.3 million cash deposit in November 2020
       ❑ Cash paid at closing $29.6 million after taking into consideration the net cash flows attributable from the
         July 1, 2020 effective date until the February 25, 2021 closing date
       ❑ Acquisition was funded by cash on hand
       ❑ Contingent payment of $5 million if Brent averages >$60/bbl for 90 consecutive days 7/1/20 to 6/30/22

      Transformational Acquisition Forecasted to Meaningfully Increase 2021 Free Cash Flow
                         1)   Management’s estimate of Sasol’s interest as of Feb. 25, 2021
   VAALCO Energy, Inc.                                                                        NYSE: EGY   LSE: EGY   6
Profitably and Sustainably Growing in West Africa - Virtual 33rd Annual ROTH Conference March 2021
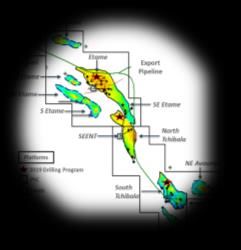
Step Change in Total Production and Reserves
Significant Increase in Size and Scale
                                                                                                                                       PROVED NRI RESERVES(1) (MMBO)
                                 Production Outlook                                                                           4.0
           10,000
                                                                      Full quarter Sasol                                      3.0
                                                                       production and Includes 7-day
                                                                       natural decline planned field                          2.0
                                                                                         maintenance and                                      3.2
                                                                                                                                                                      2.7
                                                                                          natural decline                     1.0
            7,500
                                                                                                                               -
                                         Includes 1 month                                                                               VAALCO YE 2020    Sasol Interest as of Feb 25,
                                        of Sasol Production                                                                                                          2021
                                          and OPEC+ Cuts
NRI BOPD

            5,000                                                                                                                      2P CPR NRI RESERVES(2) (MMBO)
                                                                                 8,300                                        12.0
                                                                                                         7,500
                                                                                                                               9.0

            2,500                                  5,250                                                                       6.0
                       4,853
                                                                                                                                              9.0                     7.9
                                                                                                                               3.0

                                                                                                                                   -        Combined 17,090
                                                                                                                                         VAALCO YE 2020   Sasol Interest as of Feb 25,
               0
                      FY 2020                  Q1 2021Est                     Q2 2021Est               2H 2021E                                                      2021

                      1)   SEC reserves are NSAI estimates as of December 31, 2020, and management’s
VAALCO Energy, Inc.        estimate of Sasol’s interest as of Feb. 25, 2021                            NYSE: EGY   LSE: EGY                                                  7
                      2)   2P CPR Reserves are NSAI estimates as of December 31, 2020 with VAALCO’s
                           management assumptions for escalated crude oil price and costs and
                           management’s estimate of Sasol’s interest as of Feb. 25, 2021
2019/2020 Program Internally Funded
Successful Results Build Size and Scale
  Completed the September 2019 to March 2020 drilling campaign with a 100% success rate, on time and
  within budget
            ↗ The 6-month drilling campaign increased FY production by ~40% between 2019 to 2020
            ↗ SE Etame discovery well and 2 development wells with 6.7 NRI MMBO 2P CPR Reserves(1)
            ↗ Discovery in the Dentale with 2.7 NRI MMBO contingent and prospective resources (1)
                                                                        Highly Successful Development Wells
                             IP Gross                                          2020 Prod’n             2P Reserves            2C Resources
   Well Name                                           1st Prod                                                                                              Remarks
                              (BOPD)                                            (MMBO)                  (MMBO)(1)              (MMBO) (1)
    Etame 9H                    5,500                Dec 2019                         0.94                  4.7                   3.6        Significantly exceeded predrill estimates
   Etame 11H                    5,200                 Jan 2020                        1.28                  4.2                   3.0        Significantly exceeded predrill estimates
  SE Etame 4H                   2,200                Mar 2020                         0.54                  1.5                   0.1          Strong results in new step out area

                                                                                                   Appraisal Wellbores
     Wellbore Name                                                                                                            Remarks

          Etame 9P                              Discovered oil-filled Dentale and Gamba reservoirs, each was ~45 feet thick - In addition to Etame 9H
                                                                        Gamba, the Dentale added 5.3 MMBO gross resources(1)
  South East Etame 4P                                                                    Verified good-quality Gamba oil sands in new step out area

VAALCO Energy, Inc.   1)   12/31/2020 NSAI CPR report and VAALCO’s internal prospective resource       NYSE: EGY   LSE: EGY                                                          8
                           estimate
Meaningful Production Growth
        Positive Impacts from 2019/2020 Drilling Program

                                                                                                                                              • Etame 9H well online in Q4’19
                                                                                                                                                above pre-drill expectations
                                                                                                                                              • Etame 11H well online in Q1’20
                                                                                                     (1,823) Gross                              above pre-drill expectations
                                                          6,923 Gross
                                                                                                                                              • Successful subsea repair restored
                                                                                                                                                production at Etame 4H in Dec
      BOPD

                                                                                                                                     17,963     2019
                   12,863                                                                                                            Gross
                   Gross                                                                                                                      • Successful workover replaced
                                                                                                                                                ESP and restored production at
                                                                                                                                                Etame 10H in Jan 2020
                                                                                                                                              • South East Etame 4H well online
                                                                                                                   (1)                          in Q1’20 within pre-drill
                                                                                                                                                estimates
WI                  4,000                                      2,153                                       (567)                     5,586
                                                                                                                                              • Successful workover replaced
NRI                 3,476                                      1,871                                       (493)                     4,853      ESP and restored production at
                                                                                                                                                South East Etame 2H in March
        WI and NRI numbers exclude the impact of the Sasol Acquisition which closed in Feb’21                                                   2020

                                   Highly Successful Drilling Results Exceeded Pre-drill Expectations
      VAALCO Energy, Inc.   1)   Other production deferrals includes impacts of OPEC+ curtailment and Q3      NYSE: EGY   LSE: EGY                                       9
                                 planned maintenance turnaround
Etame 3-D Seismic Acquisition
Optimizing and De-Risking Future Drilling Locations

  Expected to optimize future drilling
  locations, provide better imaging of existing
  satellite and infill locations, as well as
  identify additional upside opportunities

  •     New proprietary 3-D seismic data over the
        entire Etame Marin block
            •     Full Acquisition Area: 742 Km2 (green polygon)

  •     Survey was completed in Q4 2020

  •     Seismic processing started in January 2021 and
        will be completed by Q4 2021

  •     Significant improvements in imaging and will be
        1st full field 3-D seismic of Etame Marin Block
        since discovery in 1998

VAALCO Energy, Inc.                                                NYSE: EGY   LSE: EGY   10
2021/22 Drilling Campaign
Converting Capital Into Additional Scale And Production

               New 2020/2021 Proprietary 3-D Seismic Data Over Entire Etame Marin Block
   •      Improved 3D seismic will help VAALCO optimize future drilling locations
                                                                      2,000
   •      Allows for better planning to help reduce costs
   •      Identifies additional upside opportunities                  2,000

                                        2021/2022 Drilling Program
                                                                          3,000
    •     Program includes up to four wells
             • Potentially two development and two appraisal wells
    •     Expected to begin in Q4 2021                                 3,000

    •     Forecasted to increase gross production 7,000 – 8,000 BOPD when program is completed
    •     Targeting 2P reserves and prospective resources which could add materially to reserves
          (likely in 2022)
    •     Preliminary cost estimate $115 to $125 million gross or $73 to $79 million net to VAALCO

                      Potential to Add Material Free Cash Flow In 2022 and Beyond
VAALCO Energy, Inc.                                NYSE: EGY   LSE: EGY                              11
Etame Organic Growth
                 Underpinning Vision 2025

               30,000

               25,000

               20,000
Gross BOPD

               15,000

               10,000

                5,000

                     0
                      2019        2020                2021                2022                2023               2024         2025           2026           2027        2028         2029         2030   2031

                                                Base           Drilling2019/2020                  Drilling 2021/22          Drilling 2023/24         Drilling 2025/26   Drilling 2027/28    CSP

                                                                        Reserve and Resource Growth – Est. Ultimate Recovery(1)
               250                                                                                                                                                                                       232
                                                                                                                                                              204                    217
               200                                                                                     181                        195
                                                                  167
  Gross MMBO

                               146                                                                                                                             85                     98                 113
               150                                                48                                    62                           76
                               30
               100

               50              116                                119                                  119                        119                          119                   119                 119
                 0
                              Base                     Drilling2019/2020                      Drilling 2021/22              Drilling 2023/24            Drilling 2025/26       Drilling 2027/2028        CSP

                                                                                Cum. Production @ 12/31/20                        Remaining Reserves & Resources

                 VAALCO Energy, Inc.   (1) Chart contains combination of VAALCO’s internal reserve and resource estimates   NYSE: EGY     LSE: EGY                                                              12
                                        and 12/31/2020 NSAI CPR report
Significant Remaining Upside at Etame
       Organic Growth Opportunities                                                                                                                  East Ebouri

Gamba Development: 1 South East Etame and 1 South Tchibala Gamba wells

Gamba Leads/Prospects: 5 potential satellite prospects identified                                                                                                  Etame
                                                                                                                                         Ebouri
Dentale Sub Crop & Dentale Development: 3 sub crop wells and 10                                                                      West Etame
development wells                                                                                                                   South West
                                                                                                                                     Etame
Crude Sweetening Project: Reactivation of 3 shut in wells, 2 potential new wells                                                                                                      South East Etame
                                                                                                                                           South Etame
and testing a satellite prospect
                                                                                                                                                                                          North
Extension based on economics: Reserves and resources beyond economic life                                                                                    SEENT                        Tchibal
which management estimates can be recovered prior to end of PSC in 2038                                                                          Platforms                                a
                                                                                                                                                   2019/2020 Drilling Program                 North East Avouma
                                                          (1)                     (1)                 (2)
                                                                                                                                                   PSC

                                                                                                                                                                           South
                                                                                                                                                                           Tchibala
                                                                                                                                                                                                         Avouma

                                                                                                                                                                                        South West Avouma

      VAALCO Energy, Inc.   1)   12/31/2020 NSAI CPR report                                                  NYSE: EGY   LSE: EGY                                                                   13
                            2)   12/31/2020 NSAI CPR report for the Gamba Satellite Prospects and VAALCO’s
                                 internal prospective resource estimate
Equatorial Guinea
Significant Upside Potential
                                                         • 16.5 million BOE unrisked gross 2C resource(1) Venus discovery;
                                              Noble        7.9 million BOE unrisked gross 2C resource(1) Europa discovery
                                            210MMboe

                                                         • Well defined exploration opportunity with 164.4 MMBOE
                                                           unrisked gross resource(1) and 44.9 MMBO unrisked WI
                                                           resource(1) potential in SW Grande on Block P
                                                         • PSC license period is for 25 years from date of approval of a
                                                           development and production plan
                                                         • VAALCO 43%, Atlas 32%, Crown 5%, GEPetrol 20% carried
                                                           interest through first production; GEPetrol carried interest will be
                                                           recovered from their share of production
                  VAALCO                                 • Farm-down to another company
                Block P PDA
                                                              • Would acquire a portion of VAALCO EG’s 43% WI in
                                                                  Block P carried for substantially all exploration well costs
                                                              • Subject to approval by the government
                                                         • Evaluating Venus stand-alone development scenarios
                                                         • Discoveries on Block were made by Devon, a prior
                                                            operator/owner
                                     Kosmos
                                   600MMboe                         Low-Cost Optionality with Significant Upside

VAALCO Energy, Inc.     1) 12/31/2020 NSAI CPR report   NYSE: EGY   LSE: EGY                                            14
Health, Safety, Security & Environment
Our Commitment to World Class Safety
 Health & Safety
 • Distinguished health and safety record with only one recordable incident
   in 2019 and one in 2020 across 2,000,000+ man hours combined
 • Aligning the safety management systems with international standards
   (ISO 45001, 2018)
 • Empowering workforce to take ownership of safety performance in order
   to reduce risk
 Environmental Management                                                           VAALCO Energy’s People Based Safety Program –
                                                                              complementing Behaviour Based Safety through strengthening
 • Committed to environmental stewardship with dedicated emergency                             Safety Leadership Skills

   environmental response capabilities
 • Gathering greenhouse gas emissions data for building base line study to
   determine operational modifications required to meet recognized
   international standards
 • Enhance environmental performance through Process Safety
   Management by creating awareness and accountability

                      2019 Inaugural Sustainability Report is Available on VAALCO’s Website;
                             2020 Expanded ESG Report to be Delivered by Mid-Year
VAALCO Energy, Inc.                                  NYSE: EGY   LSE: EGY                                                         15
Key Performance Metrics
Profitable Results Build Financial Strength(1)

                                      NRI Production by Quarter                                                                                          Realized Price and Avg Brent Price
           6,000                                                                                                                   $70.00

           5,000                                                                                                                   $60.00
                                                                                                                                   $50.00
           4,000
                                                                                                                                   $40.00
NRI BOPD

                                                                                                                            $/BO
           3,000                                                                                                                              $65.80
                                                         5,410                                                                     $30.00                   $59.54
                                     4,944                                                           4,662
           2,000                                                              4,405                                                $20.00                                                          $43.63      $42.07
                     3,664
                                                                                                                                                                              $28.31
                                                                                                                                   $10.00
           1,000
                                                                                                                                    $0.00
              0                                                                                                                               Q4 2019      Q1 2020           Q2 2020              Q3 2020      Q4 2020
                    Q4 2019         Q1 2020             Q2 2020             Q3 2020                 Q4 2020
                                                                                                                                                            Realized Price            Avg Brent Price

                                          Adjusted EBITDAX                                                                                        Net Income (Loss)/Adjusted Net Income (Loss)
            $12.0                                                                                                                    $20.0
                                                                                                                                                 $5.5          $6.9                 $5.3                $2.3
                                                                                                                                     $10.0
            $10.0                                                                                                                                                                                                -$5.6
                                                                                                                                      $0.0
                                                                                                                                                                                                        7.6
             $8.0                                                                                                                    -$10.0      1.0                                0.6
                                                                                                                                                                                                                 -3.6
    $MM

                                                                                                                                     -$20.0
             $6.0                                                                                                             $MM
                      $10.4                                  $10.1                                                                   -$30.0
             $4.0                                                                                                                    -$40.0
                                                                                   $7.0
                                         $6.0
             $2.0                                                                                                                    -$50.0
                                                                                                        $3.5
                                                                                                                                     -$60.0                  -52.8
             $0.0                                                                                                                              Q4 2019      Q1 2020            Q2 2020              Q3 2020    Q4 2020
                     Q4 2019          Q1 2020              Q2 2020               Q3 2020              Q4 2020
                                                                                                                                                                      Adjusted NI           NI

VAALCO Energy, Inc.            1)   See reconciliation of non-GAAP financial measures in Appendix               NYSE: EGY      LSE: EGY                                                                                  16
VAALCO Free Cash Flow Overview (Q2-Q4 2021E)
 Maximize Margins Through Cost Discipline
                         2021 Operational Margin Per Barrel                                                                                 2021 Free Cash Flow Per Barrel

         $80.00                                                                                                         $80.00
         $70.00                                                                                                         $70.00
                                                                          $38.3                                                                                                           $32.5
         $60.00                                                                                                         $60.00
                                              $29.4                                                                                                                     $23.6
                                                                                                                                              $14.6
         $50.00            $20.4                                                                                        $50.00
$/BO Sales

                                                                                                           $/BO Sales
                                                                                                                                                                         $1.8               $1.8
                                                                                                                                               $1.8                      $2.8               $2.8
         $40.00            $2.8               $2.8                         $2.8                                                                $2.8
                                                                                                                                                                         $4.0             $4.0
                                                                                                                        $40.00                 $4.0
                           $5.8               $6.8                         $7.9                                                                                          $6.8             $7.9
                                                                                                                                               $5.8
         $30.00                                                                                                         $30.00
         $20.00            $26.0              $26.0                       $26.0                                         $20.00                $26.0                     $26.0             $26.0
         $10.00                                                                                                         $10.00
               $-                                                                                                          $-
                         $55               $65                        $75                                                                $55                         $65              $75
                                    Realized Oil Price                                                                                                         Realized Oil Price
                           OPEX     Tax        Workovers               Margin                                                           OPEX          Tax      G&A      Workovers   ARO     FCF
                                                 All numbers are prorated estimates of Q2’21 to Q4’21: OPEX excludes workovers, G&A excludes stock-based compensation

             Each $5/barrel improvement in oil price increases Free Cash Flow by ~$12.5 million and increases Adjusted EBITDAX by ~$14 million

                               Operational Margin Excludes Hedging                                    Free cash flow per barrel excludes Hedging and Capex

                      Approximately 90% of estimated opex is fixed, majority of costs don’t increase with additional production levels

                         Generating $23.60/BO of Free Cash Flow at $65 Realized Pricing in 2021
 VAALCO Energy, Inc.                                                                                NYSE: EGY              LSE: EGY                                                                17
Working Capital and Adjusted Working Capital
Liquidity Position Remains Strong(1)

                          $70.0
                                                                                                                                                                                                       $61.0
                          $60.0                                                                                                                                  $57.2

                                                                                                                                              $48.6                                                                                                         $47.9
                          $50.0                                                                                            $46.2                                                    $45.9                                 $44.8
                                                                                                                                                                                                                                             $42.0
                                                                     $40.5
                          $40.0                                                                                                     $38.1

                                                $32.2
                                                                                         $33.7        $33.4 $33.8
                                                                                                  $29.7                                                $29.0                                                                       $29.3
                          $30.0                                                                                                                                                              $25.8
  $ Millions

                                                                                                                                                                                                                $24.1                                 $24.3
                                                                                                                                   22.8
                                                                                                 17.8           18.8                                                      $18.3
                          $20.0                                                                                                                       16.2                                                                        16.6
                                                            $13.3                                                                                                                           13.4
                                                                                                                                                                                                               11.7                                  11.4
                                          $10.2                                $9.2
                          $10.0             $7.0                                                                                                                         6.0
                                                          1.2 $0.0                   $0.0               $0.0           $0.0               $0.0               $0.0              $0.0                $0.0               $0.0               $0.0
                           $0.0
                                       (1.7)                                 (2.8)
                         -$10.0
                                         Q1 2018           Q2 2018            Q3 2018             Q4 2018         Q1 2019           Q2 2019            Q3 2019           Q4 2019             Q1 2020            Q2 2020            Q3 2020            Q4 2020
               Working Capital              (1.7)              1.2              (2.8)               17.8             18.8             22.8               16.2                  6.0             13.4               11.7               16.6               11.4
                                   (1)
               Adj. Working Capital         10.2              13.3               9.2                29.7             33.8             38.1               29.0              18.3                25.8               24.1               29.3               24.3
               Debt                          7.0                 -                   -                  -              -                  -                  -                  -                  -                  -                  -
               Cash(2)                      32.2              40.5              33.7                33.4             46.2             48.6               57.2              45.9                61.0               44.8               42.0               47.9

VAALCO Energy, Inc.           1)      See reconciliation of non-GAAP financial measures in Appendix                                NYSE: EGY          LSE: EGY                                                                                                      18
                              2)      Excludes the current portion of lease liabilities and current assets and liabilities
                                      attributable to discontinued operations
                              3)      Includes cash equivalents, excludes restricted cash
Near-Term and Long-Term Catalysts
Strong Upside Potential at Etame and Block P

  Gabon Etame – Seismic & Future Drilling                                               Equatorial Guinea Block P
  •     New proprietary 3-D seismic data over                                  •   Future potential with PSC license period of
        entire Etame Marin block completed in                                      25 years from date of approval of a
        Q4’20 with processing to be completed in                                   development and production plan
        2021                                                                   •   16.5 MMBOE unrisked gross 2C resource
  •     Optimizes future drilling locations,                                       Venus discovery;
        provides better imaging of existing satellite                              7.9 MMBOE unrisked gross 2C resource
        and infill locations, as well as identifies                                Europa discovery
        additional upside opportunities                                        •   Well defined exploration opportunity with
  •     High upside potential with relatively low                                  164 MMBOE unrisked gross resource
        risk Gamba satellite and extension                                         potential in SW Grande
        prospects targeted for 2021/2022 drilling                              •   Continuing to evaluate timing and
        program                                                                    budgeting for development and
  •     PSC in place for up to 17 years with                                       exploration activity
        significant remaining reserves and                                     •   Evaluating Venus stand-alone development
        resources of ~113 gross MMBO at Etame                                      scenarios

VAALCO Energy, Inc.                                     NYSE: EGY   LSE: EGY                                                 19
Contact
 Corporate Office                  Branch Office

 9800 Richmond Avenue,             VAALCO Gabon SA
 Suite 700, Houston, Texas 77042   B.P. 1335,
                                   Port Gentil, Gabon
 T 713.623.0801
 F 713.623.0982
 E vaalco@vaalco.com               T +241-(0)1-56-55-29

 Investor Contacts

 U.S. - Al Petrie                  U.K. - Ben Romney / Kelsey Traynor / James Husband

 T 713.543.3422                    T 44.0.20.7466.5000
 E apetrie@vaalco.com              E vaalco@buchanan.uk.com

 www.vaalco.com

VAALCO Energy, Inc.                                     NYSE: EGY   LSE: EGY
Appendix

VAALCO Energy, Inc.   NYSE: EGY   LSE: EGY
2021 Guidance(1)
(As of March 9, 2021)
                                                                                                                                                              Q1 2021                                     FY 2021
                                                                                                                  WI(2)                                    5,850 - 6,200                               7,800 – 8,500
  Production (BOPD)
                                                                                                                  NRI(2)                                   5,100 - 5,400                                6,800 - 7,400
                                                                                                                  WI(2)                                    7,700 - 8,050                               8,150 – 8,950
  Sales Volume (BOPD)
                                                                                                                  NRI(2)                                  6,700 – 7,000                                 7,100 - 7,800
  Production Expense(3)                                                                                   WI(2) & NRI(2)                             $16.5 - $18.5 MM                                  $69 - $77 MM

                                                                                                                  WI(2)                                 $22.50 - $27.00                                $21.25 - $25.50
  Production Expense per                           BO(3)
                                                                                                                  NRI(2)                                $26.00 - $31.00                                $24.50 - $29.25
  Workovers                                                                                               WI(2) & NRI(2)                                         $0 MM                                  $5 - $10 MM
  Cash G&A(4)                                                                                             WI(2) & NRI(2)                                $2.5 - $3.5 MM                                 $10 - $12 MM
  FY 2021 CAPEX (excl. 2021/2022 drilling                                                                 WI(2) & NRI(2)                                    $2 - $3 MM                                  $3 - $6 MM
  campaign)(5)
  2021/2022 Drilling Campaign Total Capex Forecast $73 - $79 MM WI(2) & NRI(2) (Split between 2021 and 2022
  depends on rig availability and 1st well spud date)
              To Date, VAALCO’s Operations Have Not Been Materially Impacted By Worldwide COVID-19 Pandemic.
                      This Guidance Excludes Any Potential Future Impact Not Currently Being Experienced.
VAALCO Energy, Inc.                                                                                               NYSE: EGY   LSE: EGY                                                                                   22
         1)    Assumes OPEC+ mandate to curtail production is achieved after Q1’21 through natural decline                    3)   Excludes workover expense
         2)    WI uses working interest of 31.1% through Feb 24,2021 and 58.8% thereafter, whereas NRI uses net               4)   Excludes stock-based compensation
               revenue interest after 13% royalty deduction                                                                   5)   Excludes spending related to alternatives to current FPSO charter
Supplemental Non-GAAP Financial Measures

This presentation contains crude oil and natural gas metrics which do not have standardized meanings or standard methods of calculation as classified by the SEC and therefore such
measures may not be comparable to similar measures used by other companies. Such metrics have been included herein to provide readers with additional measures to evaluate the
Company’s performance; however, such measures are not reliable indicators of the future performance of the Company and future performance may not compare to the performance in
previous periods.
PV-10 Value and Probable Reserves
PV-10 is a non-GAAP financial measure and represents the period-end present value of estimated future cash inflows from VAALCO’s reserves, less future development and production costs,
discounted at 10% per annum to reflect timing of future cash flows. PV-10 values for both SEC reserves and 2P CPR reserves have been calculated using SEC pricing assumptions in the case of
SEC reserves and using VAALCO’s management assumptions for escalated crude oil price and cost in the case of 2P CPR reserves. PV-10 generally differs from standardized measure, the most
directly comparable GAAP financial measure, because it generally does not include the effects of income taxes; however, VAALCO’s PV-10 does include the effect of income taxes. PV-10 is a
widely used measure within the industry and is commonly used by securities analysts, banks and credit rating agencies to evaluate the estimated future net cash flows from proved reserves
on a comparative basis across companies or specific properties. VAALCO’s PV-10 on an SEC basis and 2P CPR basis includes the effect of income taxes, and the PV-10 on an SEC basis is the
same as its standardized measure for the periods presented herein. Neither PV-10 nor the standardized measure purports to represent the fair value of the Company’s crude oil and natural
gas reserves.
VAALCO has provided summations of its PV-10 for its proved and probable reserves on a 2P CPR basis in this press release. The SEC strictly prohibits companies from aggregating proved,
probable and possible reserves in filings with the SEC due to the different levels of certainty associated with each reserve category. GAAP does not provide a measure of estimated future net
cash flows for reserves other than proved reserves and accordingly it is not practicable to reconcile the PV-10 value of 2P CPR reserves to a GAAP measure, such as the standardized measure.
Investors should be cautioned that estimates of PV-10 of probable reserves, as well as the underlying volumetric estimates, are inherently more uncertain of being recovered and realized
than comparable measures for proved reserves. Further, because estimates of probable reserve volumes have not been adjusted for risk due to this uncertainty of recovery, their summation
may be of limited use. Nonetheless, VAALCO believes that PV-10 estimates for probable reserves present useful information for investors about the future net cash flows of its reserves in the
absence of a comparable GAAP measure such as standardized measure.
2P CPR Reserves
2P CPR reserves represent proved plus probable estimates as reported by NSAI and prepared in accordance with the definitions and guidelines set forth in the 2018 Petroleum Resources
Management Systems approved by the Society of Petroleum Engineers as of December 31, 2020 using escalated crude oil price and cost assumptions made by VAALCO’s management. The
SEC definitions of proved and probable reserves are different from the definitions contained in the 2018 Petroleum Resources Management Systems approved by the Society of Petroleum
Engineers as of December 31, 2020. As a result, 2P CPR reserves may not be comparable to United States standards. The SEC requires United States oil and gas reporting companies, in their
filings with the SEC, to disclose only proved reserves after the deduction of royalties and production due to others but permits the optional disclosure of probable and possible reserves in
accordance with SEC definitions.
2P CPR reserves the PV-10 value for 2P CPR reserves, as calculated herein, may differ from the SEC definitions of proved and probable reserves because: Pricing for SEC is the average closing
price on the first trading day of each month for the prior year which is then held flat in the future, while the 2P CPR pricing is based on management pricing assumptions for future Brent oil
pricing for 2021 -2029: $51.75, $55.90, $57.52, $59.41, $62.72, $67.85, $73.28, $77.29, $80.08 and thereafter escalated 2% per year. Lease operating expenses are not escalated in the SEC
case, while for the 2P CPR reserves case they are escalated at 2% annually beginning on January 1, 2023.
Management uses 2P CPR reserves as a measurement of operating performance because it assists management in strategic planning, budgeting and economic evaluations and in comparing
the operating performance of the Company to other companies. Management believes that the presentation of 2P CPR reserves is useful to its international investors, particularly those that
invest in companies trading on the London Stock Exchange, in order to better compare the Company’s reserve information to other London Stock Exchange-traded companies that report
similar measures. VAALCO also believes that this information enhances its investors’ and securities analysts’ understanding of its business. However, 2P CPR reserves should not be used as a
substitute for proved reserves calculated in accordance with the definitions prescribed by the SEC. In evaluating VAALCO’s business, investors should rely on the Company’s SEC proved
reserves and consider 2P CPR reserves only supplementally.

VAALCO Energy, Inc.                                                                 NYSE: EGY   LSE:
                                                                                                 LSE:EGY
                                                                                                      EGY                                                                           23
Non-GAAP Reconciliations
(in thousands)                                                                                                      Three Months Ended

Reconciliation of Net Income (Loss) to Adjusted EBITDAX             December 31, 2019         March 31, 2020          June 30, 2020          September 30, 2020       December 31, 2020
Net income (loss)                                                   $         1,014       $          (52,800)   $                596     $               7,618    $             (3,595)
Add back:
  Impact of discontinued operations                                              37                       63                     (11)                      (11)                     57
  Interest expense (income), net                                               (152)                    (116)                    (11)                      (23)                     (5)
  Income tax expense (benefit)                                                4,248                   33,478                  (2,249)                   (2,759)                   (789)
  Depreciation, depletion and amortization                                    2,112                    3,103                   2,801                     2,212                   1,266
  Exploration expense                                                            —                        —                       —                         16                   3,572
  Impairment of proved crude oil and natural gas properties                      —                    30,625                      —                         —                       —
Non-cash or unusual items:
  Stock-based compensation                                                      736                   (2,569)                   720                       (248)                  2,211
  Unrealized derivative instruments (gain) loss                               3,095                   (6,621)                 7,254                         —                        6
  Other operating income (expense), net                                          20                       31                    815                         37                     786
  Gain on revision of asset retirement obligations                             (379)                      —                      —                          —                       —
  Bad debt (recovery) recovery and other                                       (371)                     810                    179                        151                      25
Adjusted EBITDAX                                                    $        10,360       $            6,004    $            10,094      $               6,993    $              3,534

(in thousands)                                                                                                      Three Months Ended

Reconciliation of Net Income (Loss) to Adjusted Net Income          December 31, 2019         March 31, 2020          June 30, 2020          September 30, 2020       December 31, 2020
Net income (loss)                                                   $         1,014       $          (52,800)   $                596     $               7,618    $             (3,595)
Adjustment for discrete items:
  Discontinued operations, net of tax                                            37                       63                     (11)                      (11)                     57
  Impairment of proved crude oil and natural gas properties                      —                    30,625                      —                         —                       —
  Unrealized derivative instruments (gain) loss                               3,095                   (6,621)                  7,254                        —                        6
  Deferred income tax expense (benefit)                                       1,755                   35,638                  (3,367)                   (5,299)                 (2,813)
  Other operating income (expense), net                                          20                       31                     815                        37                     786
  Gain on revision of asset retirement obligations                             (379)                      —                       —                         —                       —
Adjusted Net Income (Loss)                                          $         5,542       $            6,936    $              5,287     $               2,345    $             (5,559)

Diluted adjusted net income (loss) per share                        $           0.09      $              0.12   $               0.09     $                0.04    $               (0.10)
                                                             (1)
Diluted weighted average shares outstanding
(1) No adjustments to weighted average shares outstanding                    59,136                   57,975                 57,594                    57,741                   57,493

VAALCO Energy, Inc.    All amounts in the tables are in thousands            NYSE: EGY   LSE: EGY                                                                                    24
Non-GAAP Reconciliations
(in thousands)                                                                                                        As of
Reconciliation of Changes in Working Capital from Continuing Operations              March 31, 2018   June 30, 2018    September 30, 2018   December 31, 2018
Current assets                                                                       $     49,507     $    59,439      $        44,591      $       58,794
Current liabilities                                                                       (51,252)        (58,193)             (47,343)            (41,044)
Working capital                                                                            (1,745)          1,246               (2,752)             17,750
Less current assets - discontinued operations                                              (3,030)         (3,172)              (3,222)             (3,290)
Add operating lease liabilities - current portion                                              —               —                    —                   —
Add current liabilities - discontinued operations                                          15,002          15,186               15,191              15,245
Adjusted Working Capital                                                             $     10,227     $    13,260      $         9,217      $       29,705

(in thousands)                                                                                                        As of
Reconciliation of Changes in Working Capital from Continuing Operations              March 31, 2019   June 30, 2019    September 30, 2019   December 31, 2019
Current assets                                                                       $     62,026     $    69,914      $        74,543      $       69,758
Current liabilities                                                                       (43,267)        (47,136)             (58,341)            (63,750)
Working capital                                                                            18,759          22,778               16,202               6,008
Less current assets - discontinued operations                                                   -               -                    -                   -
Add operating lease liabilities - current portion                                          10,334          10,500               12,432              11,990
Add current liabilities - discontinued operations                                           4,675           4,847                  326                 350
Adjusted Working Capital                                                             $     33,768     $    38,125      $        28,960      $       18,348

(in thousands)                                                                                                        As of
Reconciliation of Changes in Working Capital from Continuing Operations              March 31, 2020   June 30, 2020    September 30, 2020   December 31, 2020
Current assets                                                                       $     79,049     $    62,234      $        54,398      $       63,978
Current liabilities                                                                       (65,687)        (50,498)             (37,823)            (52,576)
Working capital                                                                            13,362          11,736               16,575              11,402
Less current assets - discontinued operations                                                   -               -                    -                   -
Add operating lease liabilities - current portion                                          12,050          12,274               12,696              12,890
Add current liabilities - discontinued operations                                             395              48                   15                   7
Adjusted Working Capital                                                             $     25,807     $    24,058      $        29,286      $       24,299

VAALCO Energy, Inc.   All amounts in the tables are in thousands   NYSE: EGY   LSE: EGY                                                                    25
Etame PSC Contractual Summary

                                 PSC Terms                                         Gabon - Etame
                  Royalty Rate                                                             13%
                  Cost Oil                                         80% through Sept. 2028, 70% thereafter
                  Profit Oil Split/Income Tax                                      See Table Below
                  Government back-in - Tullow                           7.5% carried through June 2026,
                                                                                10% thereafter
                  Abandonment                                Cost recoverable: Estimated $61.8MM, Pre-
                                                                          funded $37.4MM
                  Production and Development Term              10 yrs through 2028 plus two 5 yr options

                             Profit Oil Split (BOPD)                          Contractor             State
                                   0 - 10,000                                    50%                 50%
                                 10,000 – 25,000                                 45%                 55%
                                    25,000 +                                     40%                 60%
VAALCO Energy, Inc.                                    NYSE: EGY   LSE: EGY                                  26
Management Team
Deep Industry, Technical and Financial Experience
               Cary Bounds – Chief Executive Officer and Director
               Joined VAALCO in 2015 as COO and was named CEO in December 2016. Mr. Bounds began his career at Conoco in 1991. Most recently led Noble’s Central Africa
               BU, overseeing operations in Equatorial Guinea. Held technical and leadership positions with Noble Energy, SM Energy, Dominion, and ConocoPhillips. Fifteen
               years domestic experience and ten years international experience, primarily West Africa and UK. Holds B.S. in Petroleum Engineering from Texas A&M University.

               Elizabeth Prochnow – Chief Financial Officer
               Joined VAALCO in 2015. Over thirty years serving in senior level accounting and financial officer roles with publicly traded companies.
               Holds a Bachelor of Arts and a Masters of Accounting from Rice University and is a certified public accountant in the State of Texas.

                David DesAutels – Executive Vice President Corporate Development
               Joined VAALCO in 2017. Over forty years of domestic & international experience in oil and gas development and exploration. Held technical and
               leadership positions with Noble Energy and Occidental. Holds a M.S. in Geology from University of Minnesota-Twin Cities.

                Thor Pruckl – Executive Vice President International Operations
                Joined VAALCO in 2019. Over thirty years of domestic & international experience in both upstream and midstream operations and is well versed in both
                onshore and offshore operations. Held technical and leadership positions with Noble Energy, Talisman Energy, Nexen Energy and BP Resources Canada.
                Holds an undergraduate degree from the University of Saskatchewan and a Master’s from Royal Roads University, UK.

                Michael Silver – Executive Vice President and General Counsel
                Joined VAALCO in 2018. Over thirty years of experience as in-house counsel with ExxonMobil and BHP Billiton supporting international petroleum
                operations. Areas of experience includes M&A, negotiations, compliance and dispute resolution. Holds a J.D. from the Duke University School of Law, an
                M.B.A. from the Fuqua School of Business and a B.A. in International Affairs from Lafayette College.

VAALCO Energy, Inc.                                                         NYSE: EGY   LSE: EGY                                                                 27
You can also read