INVESTOR PRESENTATION - AUGUST 2021 "Generac's mission is to ensure peace of mind by developing power products and solutions that make the world ...
←
→
Page content transcription
If your browser does not render page correctly, please read the page content below
INVESTOR
PRESENTATION
AUGUST 2021

               "Generac's mission is to ensure peace of mind by
               developing power products and solutions that make
              the world safer, brighter, and more productive."
                                                                   1
INVESTOR
RELATIONS

Aaron Jagdfeld
PRESIDENT & CEO

York Ragen
CHIEF FINANCIAL OFFICER

Mike Harris
VICE PRESIDENT – CORPOR ATE
DEVELOPMENT & INVESTOR REL ATIONS

Kris Rosemann
INVESTOR REL ATIONS MANAGER
(262) 506-6064
InvestorRelations@generac.com

                                    2
FORWARD LOOKING
STATEMENTS

Certain statements contained in this news release, as well as other      • frequency and duration of power outages impacting demand for          • changes in environmental, health and safety, or product
information provided from time to time by Generac Holdings Inc.            our products;                                                           compliance laws and regulations affecting our products,
or its employees, may contain forward looking statements that            • availability, cost and quality of raw materials and key components      operations, or customer demand.
involve risks and uncertainties that could cause actual results            from our global supply chain and labor needed in producing our
to differ materially from those in the forward looking statements.       products;                                                               Should one or more of these risks or uncertainties materialize,
Forward-looking statements give Generac's current expectations           • the impact on our results of possible fluctuations in interest        Generac's actual results may vary in material respects from
and projections relating to the Company's financial condition,             rates, foreign currency exchange rates, commodities, product          those projected in any forward-looking statements. In the current
results of operations, plans, objectives, future performance and           mix and regulatory tariffs;                                           environment, some of the above factors have materialized and
business. You can identify forward-looking statements by the fact        • the possibility that the expected synergies, efficiencies and         may or will continue to be impacted by the COVID-19 pandemic,
that they do not relate strictly to historical or current facts. These     cost savings of our acquisitions will not be realized, or will not    which may cause actual results to vary from these forward-looking
statements may include words such as "anticipate," "estimate,"             be realized within the expected time period;                          statements. A detailed discussion of these and other factors that
"expect," "forecast," "project," "plan," "intend," "believe,"            • the risk that our acquisitions will not be integrated successfully;   may affect future results is contained in Generac's filings with the
"confident," "may," "should," "can have," "likely," "future,"            • the duration and scope of the impacts of the COVID-19                 U.S. Securities and Exchange Commission (“SEC”), particularly in
“optimistic” and other words and terms of similar meaning in               pandemic are uncertain and may or will continue to adversely          the Risk Factors section of the 2020 Annual Report on Form 10-K
connection with any discussion of the timing or nature of future           affect our operations, supply chain, and distribution for certain     and in its periodic reports on Form 10-Q. Stockholders, potential
operating or financial performance or other events.                        of our products and services;                                         investors and other readers should consider these factors carefully
                                                                         • difficulties we may encounter as our business expands globally        in evaluating the forward-looking statements.
Any such forward looking statements are not guarantees of                  or into new markets;
performance or results, and involve risks, uncertainties (some           • our dependence on our distribution network;                           Any forward-looking statement made by Generac in this
of which are beyond the Company's control) and assumptions.              • our ability to invest in, develop or adapt to changing technologies   presentation speaks only as of the date on which it is made.
Although Generac believes any forward-looking statements are               and manufacturing techniques;                                         Generac undertakes no obligation to update any forward-
based on reasonable assumptions, you should be aware that many           • loss of our key management and employees;                             looking statement, whether as a result of new information, future
factors could affect Generac's actual financial results and cause        • increase in product and other liability claims or recalls;            developments or otherwise, except as may be required by law.
them to differ materially from those anticipated in any forward-         • failures or security breaches of our networks, information
looking statements, including:                                             technology systems, or connected products; and

                                                                                                                                                                                                                        3
GENERAC
BY THE NUMBERS

     LTM
                                    ~7,900EMPLOYEES
     NET SALES
     $3.2 BILLION

      LTM ADJ EBITDA
                                               26%
  $807 MILLION                      66%
           25.3% MARGIN
                                                      8%

                     LTM FREE CASH FLOW
                                                      OMNI CHANNEL
                                                   DISTRIBUTION
                    $561 MILLION                THOUSANDS OF DEALERS, WHOLESALERS,
                                                 RETAILERS AND E-COMMERCE PARTNERS

                                                                                     4
MEGA
TRENDS

"Grid 2.0" - Evolution of the                     Legacy infrastructure needs
traditional electrical utility model              major investment cycle
Technology, regulation and the “electrification   Rebuilding of transportation, water & power
of everything” will create Clean Energy and       will take decades
Grid Services opportunities

                                                  Telecommunications
Attitudes around global warming                   infrastructure shifting to
and climate change are changing                   next generation
Expectation of more severe weather driving        5G will enable new technologies requiring
power outages                                     significant improvement in network uptime

Natural Gas will be an important                  Home as a Sanctuary
fuel of the future                                Working, learning, shopping, entertaining,
Huge supply & increasing demand for               aging in place, and in general, spending more
applications beyond standby power                 time at home

                                                                                                  5
MACRO CREATING A LEADING “ENERGY
TECHNOLOGY SOLUTIONS” COMPANY
INVESTMENT THEMES
Power Quality Issues Continue To Increase
- Power outage severity increasing significantly over LT baseline average during 2017-2021
- Aging and under-invested electrical grid more vulnerable to unpredictable and severe weather
- Aging population and overall consumers are more dependent on power
$4,000
Home Standby Market Growth Opportunity is Massive
15% ORGANIC CAGR $3,500
- ~5.0% of US HH’s have a HSB today (TAM=55M HH’s)
- Every 1.0% of penetration is approximately $2.5 billion market opportunity (at retail)
SINCE IPO IN 2010 - Generac’s 75%+ share due to unique go to market strategy
$3,000 California and Texas markets for backup power
increasing significantly
- Represents two largest addressable market opportunities within U.S. for home standby generators
$2,500 - HSB penetration rates in both states well below national average of ~5.0% (CA ~1%, TX ~3%)
- California - numerous power shutoff events impacting millions of customers in an
attempt to mitigate risk of wildfires
$2,000 - Texas – recent major outage event expected to accelerate demand for backup power
over the next several quarters
$1,500 Energy Storage & Monitoring Markets Developing Quickly
- New markets focused on energy cost reduction and resiliency
- Battery cost and performance continue to improve
- Generac uniquely positioned with distribution, marketing & brand
$1,000
Natural Gas Generators Driving Superior Growth Rates
- Cleaner, greener & more cost effective for on-site power
$500
- US is ~40% gas gen sales annually and growing 2x diesel
- Global opportunity is nascent – low-single digits percentage of market
$- Rollout of 5G Will Require Improved Network Reliability
'92 '95 '98 '01 '04 '07 '10 '13 '16 '19 '21E - 5G will enable many new technologies - uptime critical
- ~400K cell towers in U.S., ~40% penetration, Generac #1 market share
Note: $ amounts in millions. Represents gross sales excluding freight revenue. Excludes “Portable Product” sales prior to the division’s divestiture in 1998. Figures - Technology to rollout globally – Generac footprint can serve
include results from acquisitions completed during 2011 – present; see slide titled “Summary of Acquisitions” for further details.
2021 figure assumes midpoint of guidance. 6
ENERGY TECHNOLOGY
  SOLUTIONS

                                                                                DER: Distributed Energy Resource –
   CONNECTIVITY &                                                               Generates, Stores or Manages Power
   GRID SERVICES
    Residential DERs                     Energy Storage & Management DERs    Commercial & Industrial DERs
                   Air-cooled                                                           Gaseous Generators
                   Home Standby                         PWRCell                         Up to 1MW
                   Generators                           Battery Storage

                                                                                   Liquid-cooled
                                                                            commercial generators
 Liquid-cooled
Home Standby                                  Energy
    Generators                           Monitoring &
                                         Management                                                 Transfers
                                                                                                    Switches

  Other Capabilities                        Chore
                                            Products                        Mobile
     Portable                CARB
                             Compliant
                                                                            Products
   Generators

                                                                                                                     7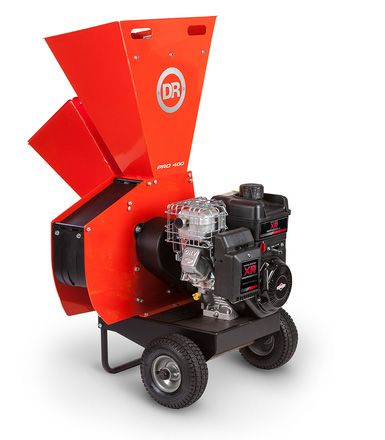
GENERAC'S EVOLVING
BUSINESS MODEL ...

Increasing use of renewables
leading to variability of supply   ISO/Utilities/Energy Retailers
and grid instability

Address peaks in
electricity demand
                                   Virtual Power Plant (VPP) Network
Provides resiliency
from outages

Digital platform enables
assets to be connected             Connectivity + Software Platform
more seamlessly as DERs

Generac DER ASSETS
GENERATE/STORE/MANAGE POWER        Smart Grid                                                Evolution into Energy
Residential + C&I End Users        Ready                  Load     Residential     C&I
                                                                                             Technology Solutions Company
                                            PV+Storage   Control                 Generator
                                                                   Generator

                                                                                                                        8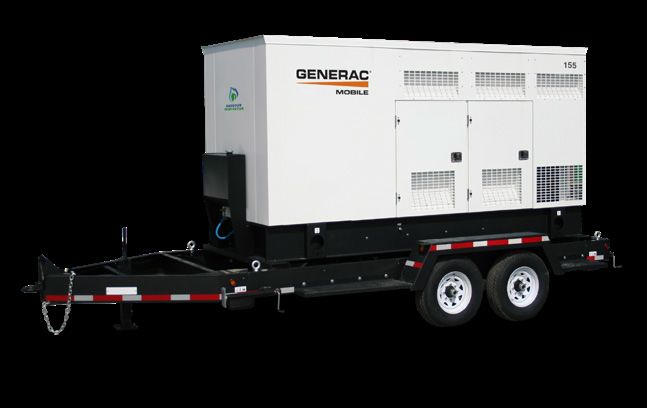
…ALIGNED WITH CHANGING
LEGACY ELECTRICAL UTILITY MODEL

GENERAC’S CAPABILITIES PROVIDE UNIQUE
POSITION TO ENABLE UTILIZATION OF PRODUCTS
AS DERs ON A VERY LARGE SCALE

Current
•   Generators: backup and beyond standby            • Connectivity
•   Battery storage systems                          • Grid services – Enbala
•   Energy monitoring devices                          software platform
•   Energy management devices                        • DER assets and devices are
                                                       Smart Grid Ready

Near Term
• Generator integration within battery storage       • Develop roadmap for full suite of
• Next-gen load control with energy                    grid-support solutions
  management devices                                 • AC-coupled inverter for retrofit solar
• DC generator integrated into                         market
  battery storage system                             • Generac branded microinverter

Future
• Generac’s Smart Grid Ready DER assets              • Develop various new grid services revenue
  aggregated into Virtual Power Plant (VPP)            streams
  solutions                                          • Performance services that deliver mega-
• Bundling VPP solutions with vertical operational     watts of power to various customers
  services that enable more turnkey solutions
                                                                                                   9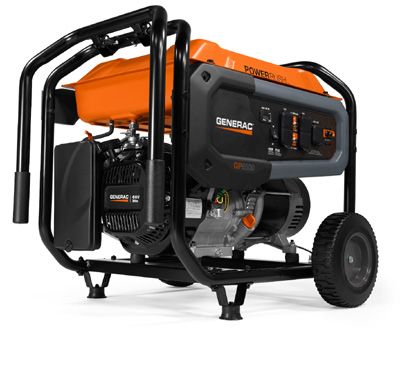
ENERGY TECHNOLOGY –
GENERAC’S ENERGY STORAGE SOLUTION

MORE POWER
                                                           OUTDOOR RATED
- 9/11 kW Max. Continuous
                                                           - Type 3R Battery Cabinet
- 50A Motor Starting Current
                                                           -10 to 50°C Operating
                                                            Temperature Range

                                                              WHOLE HOME BACKUP
MORE CAPACITY                                                 - 200 A and 100A
                                                                Whole Home Transfer Switches
- 3.0 kWh Battery Modules
- 9 - 18 kWh per Cabinet

LOAD MANAGEMENT
- 50A and 100A Automatic
  Smart Management Modules
                                                                                               PWRcell Whole Home Backup…
 Coming Soon – Generator Integration, AC-Coupled Solution, Next-Gen Load Control,
                                                                                               CLEAN & SIMPLE
 Integrated DC-Generator, Smart Grid Ready
                                                                                                                            10
2021 ACQUISITIONS
• Founded 1975 • Founded 2010
• Headquartered Hunmanby, UK • Headquartered Los Angeles, CA
• Closed June 1st • Closed July 2nd
Company Profile Company Profile
• Designer and manufacturer of advanced controls for a • Designer and provider of grid-interactive microinverter
range of energy technology applications. and monitoring solutions for the solar market.
Strategic Rationale Strategic Rationale
• Bolster electronics and controls capabilities. • Dramatically increase SAM via entry into solar-only
• Accelerate product roadmap for the future by adding inverter market, which represents 75-80% of residen-
technical expertise and engineering bandwidth. tial solar installations.
• Help advance Generac product use beyond standby • Global residential solar-only inverter market estimated
power applications. to reach ~$4.5B by 2023 from ~$2.5B in 2020.
• Complex, systems-level controls for distributed gener- • Microinverters expand Clean Energy suite of solutions
ation, storage and other DER assets used in microgrid and deepen relationships with solar channel partners
applications. and installers.
• DSE’s solutions will help enable the decentralized • Apply proven Generac playbook previously used for
power grid of the future. other clean energy acquisitions with a focus on
scaling the business.
11RESIDENTIAL AND C&I
DEALERN
ETWORK
R ESIDENTIAL
AND
C&I D EALER ONTHER
ETWORK KEY C
O KEY C
RESIDENTIAL AND
C&I
DEALER N
THER
ETWOR
O KEYEY C
OO KKKEY C
GLOBAL DISTRIBUTION
THER
EYCK
Global Distribution Channels
Other Key Channels
OTHER
O THER
THER
THER OTHER
H
H
OTHER KEY C
CHANNELS
R C&I D
ESIDENTIAL AND N O O K CK C EALER ETWORK
THER THER
EY HANNELS
EY HANNELS
OTHER KCEY CHANNELS
O THER K
EO
EY HANNELS
Residential and C&I Dealer Network THER K
LECTRICAL EY CWEHANNELS
Electrical Wholesalers
ELECTRICAL MASSMass
MASSRetailers
M CATALOGCATALOG
C AND
AND P
LECTRICAL ASS ATALOG AND
ELECTRICAL MASS R
WEHOLESALERS CATALOG
E-C
MM CCATALOG
O K C
WHOLESALERS AND
HOLESALERS
ETAILERS
RETAILERS OMMERCE
E-COMMERCE
EELECTRICAL
LECTRICAL
THER ELECTRICAL
LECTRICAL
EY MASS
ASS
RETAILERS ASS MASS E-C
HANNELS CATALOG
ATALOG AND
CAND
OMMERCE AND A
ATALOG
OTHER KEY CHANNELS
W ELECTRICAL
HOLESALERS
WHOLESALERS
WHOLESALERS R
WHOLESALERS
W HOLESALERS R ETAILERS
RRETAILERS
ETAILERS MASS
E-C
RETAILERS
ETAILERS E-C E-C
E-C E-CCOMMER
OMMERCE
OMMERCE
OMMERCE
OMMERCE ATALOG
• International network of over 10,000 dealers
WHOLESALERS RETAILERSOmniChannel
Significant E-CDistri
OMM
Significant OmniChannel Distribu
8
• Installation and after sale service support Significant OmniChannel Distri
8 Significant
Significant
Significant OmniChannel
OmniChannel
OmniChannel
Significant Distr
Distr
Distrib
OmniChannel
Significant OmniChannel Distr
Significant OmniChann
• Work with professional engineering firms to 8 8and E-Commerce
develop customized solutions OTHER KEEY
ELECTRICAL CHANNELS
LECTRICAL MASS MASS 8
Catalog 8
8 CATALOGCATALOG
8
AND PRIVATE PLRIVATE
AND
Licensing
LD
ABELPartners
IRECT TO
ABEL GLOBAT
DIRECT
WHOLESALERS IRECT A
ELECTRICAL
ELECTRICAL MASS MRASS
WHOLESALERS ETAILERS
RCETAILERS E-COMMERCE
CATALOG
ATALOG AND
AND
E-C
PRIVATE PARTNERS
PRIVATE
LABEL
OMMERCE LABEL DTO
PARTNERS
DIRECT GLOBALGLOBAL
TOCCOUNTS
ACC
DI
• Thousands of technicians trained each year W ELECTRICAL
HOLESALERS
WHOLESALERS R
RETAILERS MASSE-COMMERCE
ETAILERS E-C CATALOG AND
OMMERCE P PRIVATE LABEL
ARTNERS
PARTNERS A
DIRECT TO GLOB
CCOUNTS
ACCOUNTS CO
WHOLESALERS RETAILERS E-COMMERCE PARTNERS ACCOUNTS
• Support for global large account sales ELECTRICAL Significant
MASSOmniChannel CATALOG AND
DistributionPRIVATE LABEL
Creates DIRECT
Barriers TO G
to Entry
WHOLESALERS Significant OmniChannel
RETAILERS E-COMMERCE Distribution Creates Barriers
PARTNERS ACCOUN
Significant OmniChannel Distribution Creates Barriers to Entry
Significant OmniChannel Distribution Creates Barriers to Entry
8
8 Direct
Significant OmniChannel Distribution to Consumer
Creates Barriers to Entry
Significant Omni-Channel Distribution 8 8
8 Significant OmniChannel Distribution Creates Barriers to E
Direct to Global Accounts
ELECTRICAL MASS CATALOG AND PRIVATE LABEL DIRECT TO GLOBAL DIRECT TO
WHOLESALERS RETAILERS 8
E-COMMERCE PARTNERS ACCOUNTS CONSUMER
MASS CATALOG AND PRIVATE LABEL DIRECT TO GLOBAL DIRECT TO
Clean Energy
RETAILERS E-COMMERCE Significant P ACCOUNTS
ARTNERS Distribution Creates
OmniChannel Barriers to Entry CONSUMER 12
8FINANCIAL
SUMMARY
($’S IN MILLIONS)
Adjusted EBITDA Adjusted EBITDA margin %
Total Net Sales Gross Margin %
$806.5 50.0%
$3,500 60.0% $800
$3,189.9
$3,000 $700
50.0% 40.0%
$2,485.2 $600 $583.8
$2,500
$2,204.3
$2,023.5 38.8% $500 $454.1 30.0%
$2,000 $1,679.4 40.0% $424.6 25.3%
$400
38.5% $317.3
$1,500 35.8% 36.2%
34.8% 30.0% $300 23.5% 20.0%
21.0% 20.6%
$1,000 $200 19.0%
$500 20.0% $100 10.0%
2017 2018 2019 2020 LTM 2017 2018 2019 2020 LTM
Free Cash Flow Consolidated Gross Debt Consolidated Gross Debt Leverage Ra�o
$600 $561.1 $1,200 5.0x
$550
$500 $1,000 $928.7 $924.0 4.0x
$427.1 $898.9 $885.2 $870.6
$450
$400 $800
3.0x
$350 $600
$300 2.9x 2.0x
$250.7
$250 $227.9 $203.6 $400 2.2x 2.0x
$200 1.5x 1.0x
$150
$200 1.1x
$100 $0 0.0x
2017 2018 2019 2020 LTM 2017 2018 2019 2020 LTM
Note: Adjusted EBITDA margin calculated using adjusted EBITDA before deducting for non-controlling interest.
13CAPITAL DEPLOYMENT
PRIORITIES
1 Organic
Growth
|Invest in technology, innovation, and R&D capabilities
|Capacity expansion; Global systems; High ROI automation
Asset Lite
2
|Target 2-3x leverage
Pay Down Deleveraging
|Term Loan matures 2026, ABL matures 2026
Debt Story
|$500mm notional swapped fixed
3
|Demonstrated ability to execute; 19 deals since 2011
Accelerate the
M&A |Accelerates “Powering Our Future” strategic plan
strategy
|Seek high synergy opportunities with above WACC returns
4 Return of
Capital
|As future cash flow permits, will evaluate options opportunistically
|$250mm remaining on current share repurchase authorization
Strong balance sheet and cash flow generation enables disciplined
and balanced approach toward capital deployment that creates
Opportunistic
value for shareholders
142021 BUSINESS OUTLOOK
(AS REPORTED ON JULY 28, 2021)
Consolidated net sales
• Consolidated revenue: increase between 47% to 50%
• Approximately 3% favorable impact from
acquisitions and foreign currency
• Does not assume benefit of another major outage
event in the second half of year
Adjusted EBITDA margins
• Between 24.5 to 25.0%
Cash income tax rate
• Between 21.0 to 21.5%
Free cash flow Expect to Utilize Strong Free Cash Flow
• Conversion of adjusted net income of approximately 90%
Generation to Increase Shareholder Value
15APPENDIX
16GENERAC WORLDWIDE
LOCATIONS
Vermont, USA
Wisconsin, USA Country Home Products
Generac
Eagle Germany
Janesville Maine, USA Motortech
Jefferson
Oshkosh
Pika Energy Pramac GMBH
Vertically Integrated Manufacturing
Vancouver, BC Poland
Waukesha (HQ)
Whitewater Neurio
Enbala
United Kingdom
Pramac UK Pramac SP. ZOO
Motortech
Capacity Serving a Globally Diverse
Generac Mobile Products Deep Sea Electronics
Berlin
France Commercial Footprint
Illinois, USA Pramac France
Deep Sea Electronics Russia
Spain Pramac Russia
Colorado, USA Pramac Iberica
Enbala
Ohio, USA
Mean Green Romania
California, USA Italy Pramac Generators
Pramac Industrial
Energy Systems South Carolina, USA Italy
Chilicon Power Generac Trenton Generac Mobile Products
Kingdom of India China
Dominican Republic Bahrain Captiva Pramac Fu Lee Foshan
Pramac Caribbean Pramac Middle East Deep Sea Electronics Power Equipment
Mexico
Ottomotores United Arab Emirates
Selmec
Pramac Middle East
Deep Sea Electronics
Brasil Australia
Pramac Australia
Generac Pramac Brasil
17SUMMARY OF
ACQUISITIONS
Acquisitions Prior
to 2016
MAR. APR. Acquisitions used to
2016
Stationary, mobile and portable generators sold
2019
Leading manufacturer of smart storage solutions
accelerate Powering
OCT.
2011
into over 150 countries worldwide Siena, Italy and smart batteries Portland, ME Our Future strategy
JAN. SEP. Revenue synergies
2017 2020
DEC. • New products, customers, end
Gaseous-engine control systems and accessories Leading manufacturer of an innovative commercial
2012 markets
sold to engine OEMs and aftermarket customers line of battery powered turf care products
Celle, Germany Ross, OH • Numerous cross-selling opportunities
• Geographic and international
AUG. JUN. OCT. expansion
2013 2018 2020
Cost synergies
Larger kW and container gensets; service and Leading provider of distributed energy optimization
remote monitoring platform for Latin America and control software for the electrical grid • Strategic global sourcing initiatives
NOV. market Mexico City, Mexico Denver, CO • Innovation and cost-reduction
2013 engineering
FEB. JUN.
2019 2021 • Adopt Generac’s lean cost culture
OCT. Captiva Energy Solutions, founded in 2010 and Designer and manufacturer of advanced controls for
• Operational excellence focus
2014 headquartered in Kolkata, India specializes in a range of energy technology applications
customized industrial generators. Kolkata, India Hunmanby, UK
Smaller acquisitions of Gen-Tran completed in February
2012 (manual transfer switches for portable generators
AUG. MAR. JUL. -Alpharetta, GA); Pramac America in September 2017
2015 2019 2021 (portable generators – Marietta, GA); Energy Systems in
July 2020 (industrial distributor – Stockton, CA)
The leading energy data company focused on Designer and provider of grid-interactive microinverter
metering technology and sophisticated analytics and monitoring solutions for the solar market
to optimize energy use Vancouver, BC Los Angeles, CA 18HSB:
A PENETRATION STORY
North American Penetration Opportunity(1)
90%
90% 86.9%
90%
80%
80%
86.9%
Aging Population Fits Demographic
86.9%
80%
70%
70% • ~65% of buyers age 60 and older
% of US Addressable Market
% of US Addressable Market
60%
• ~Median home value of approximately $425k
70% 60%
% of US Addressable Market
60% 50% 50%
40%
• ~80% retro-fit application
50% 40%
40%
30%
30%
26.0%
• ~$130K median household income
20% 26.0%
30%
20% 26.0% 16.1% • Between 8-10% replacement units
20% 10% 16.1%
16.1% 5.0%
10%
10% 0%
5.0%
5.0%
0%
0%
Central Air Condi�oning Every 1% of increased penetration equals
Central Air Condi�oning Central Air Condi�oning
Home Security Alarms (professionally monitored)
Portable Generators
~$2.5 billion of market opportunity
Home Security Alarms (professionally
Home Security monitored)
Alarms (professionally monitored)
Home Standby Generators
Portable Generators Portable Generators
Home Standby Generators
(1) Source: Company estimates;Home
basedStandby Generators
on addressable market for HSB generators consisting of all single-family detached, owner-occupied homes valued > $125K; portables and central A/C use all single-family homes regardless of value;
penetration rate for home security alarms was estimated from a variety of industry sources and focuses on the professionally monitored market.
19EXPANDING POWER
OUTAGE SEVERITY(1)
Total Outage Hours (Severity) 2,000,000
Legacy Residen�al Organic Sales - LTM
1,800,000
1,600,000
1,400,000
1,200,000
1,000,000
800,000
600,000
400,000
200,000
0
Q1 Q2 Q3 Q4 Q1 Q2 Q3 Q4 Q1 Q2 Q3 Q4 Q1 Q2 Q3 Q4 Q1 Q2 Q3 Q4 Q1 Q2 Q3 Q4 Q1 Q2 Q3 Q4 Q1 Q2 Q3 Q4 Q1 Q2 Q3 Q4 Q1 Q2 Q3 Q4 Q1 Q2 Q3 Q4 Q1 Q2
2010 2011 2012 2013 2014 2015 2016 2017 2018 2019 2020 2021
(1) Represents power outage hours for mainland U.S. only
Elevated Baseline Outages + Major Events +
Home as a Sanctuary = Catalysts for Growth
20PWRCELL® WHOLE HOME
POWER COMPARISON
USEABLE ENERGY CONTINUOUS POWER PEAK POWER
20
15
Power/Energy (kW / kWh)
+33%
10
+20%
+29%
5
0
Tesla LG Energy Enphase
PWRcell Powerwall+ Solution RESU Encharge 10
PWRcell Tesla LG Energy Solution Enphase
Useable Energy 18kWh 13.5kWh 16kWh 10.1kWh Note: Shaded lines represent market leading
Continuous Power 9kW 7kW 7kW 3.8kW advantage in terms of power capability, with
specific percentages as compared to Tesla
Peak Power (seconds) 12kW 10kW 7kW 5.76kW
21PWRCELL ® WHOLE HOME POWER
SCALABLE MODULAR APPROACH
# of Modules 6 5 4 3
Old Capacity (kWh) 17.1 14.3 11.4 8.6
New Capacity (kWh) 18 15 12 9
22SOLAR INVERTER COMPARISON
FOR RESDIENTAL APPLICATIONS
DC MLPE System AC Microinverter
with Module-level Optimizers + Central Inverter System
with Module-level Microinverters
Microinverters
Module-Level DC-DC Optimizers
String Inverter
AC Power
DC Power
DC PWRzone System AC 2:1 Microinverter
with DC Sub-string Optimizers System
with Module-level Microinverters
Sub-string String Inverter
Optimizers
Performance FULL SUN PARTIAL SUN LOW SUN
Comparison DC MLPE System
Microinverter System
Ideal Conditions DC PWRzone System
2:1 Microinverter System
23RAPIDLY BUILDING
CLEAN ENERGY DISTRIBUTION
NATIONAL REGIONAL LONG TAIL
24ENBALA'S
REVENUE MODEL
Current SaaS Model - $/MW Assets Connected/year Current Performance Model - $/MW Delivered/year
• Fundamentally a Software-as-a-Service business • Fundamentally a pay-for-performance business
• Enbala is paid as assets/devices are connected • Enbala is paid by utilities for the energy performance delivered
to the platform on a recurring basis
UTILITY/ENERGY RETAILERS
UTILITY/ENERGY RETAILERS
CUSTOMER 1 CUSTOMER 2
... CUSTOMER X CUSTOMER 1 CUSTOMER 2
... CUSTOMER X
Enbala Opportunities:
• Energy imbalance markets
• Real time capacity markets
• Emerging wholesale markets from FERC Order 2222
• Predictive energy management for customers
• Ancillary Service, Frequency Control and other aggregation markets
25NET SALES BY
PRODUCT CLASS
($’S IN MILLIONS)
$2,000 $2,100
$1,800
$1,600
$1,557
$1,400
$1,200
$1,144
$1,000 $1,043
$870 $872
$800 $820 $831
$702
$600 $684
$400
$200 $227 $259
$160 $189
$125
$0
2017 2018 2019 2020 LTM
RESIDENTIAL COMMERCIAL & INDUSTRIAL OTHER Figures include results from acquisitions completed during 2011 –
2021; see slide titled “Summary of Acquisitions” for further details.
26Q2 2021 & LTM
FINANCIAL OVERVIEW
($’S IN MILLIONS)
Actual Y/Y % Actual Y/Y %
Q2 2021 Change LTM Change
(unaudited) (unaudited)
Residential $600.0 75.8% $2,099.7 67.1%
Industrial 254.3 64.2% 831.5 9.5%
Other 65.7 29.8% 258.7 29.8%
Net Sales $920.0 68.2% $3,189.9 44.0%
Gross Profit $339.7 62.6% 1,237.9 50.8%
% Margin 36.9% 38.8%
Adjusted EBITDA $217.7 76.8% $806.5 73.7%
% Margin (1) 23.7% 25.3%
Net Income - GHI (2) $127.0 92.1% $516.0 101.7%
Adjusted Net Income - GHI $153.2 73.2% $574.6 74.1%
Adjusted EPS - GHI $2.39 71.1% $8.98 71.8%
Free Cash Flow $96.3 8.2% $561.1 60.7% (1) Adjusted EBITDA (margin) calculated using adjusted EBITDA before
deducting for non-controlling interest.
Consolidated Gross Debt $870.6
Consolidated Gross Debt Leverage Ratio 1.1x
27ADJUSTED EBITDA
RECONCILIATION
($’S IN MILLIONS)
2017 2018 2019 2020 LTM
Net income $159.6 $241.2 $252.3 $347.2 $518.1
Interest expense 42.7 41.0 41.5 33.0 31.5
Depreciation and amortization 52.0 47.4 60.8 68.8 75.3
Income taxes provision 44.1 69.9 67.3 99.0 152.8
Non-cash write-down and other charges 5.8 3.5 0.8 (0.3) (4.4)
Non-cash share-based compensation expense 10.2 14.6 16.7 20.9 23.3
Loss on extinguishment of debt - 1.3 0.9 - 0.8
Transaction costs and credit facility fees 2.1 3.9 2.7 2.2 7.6
Loss on pension settlement, restructuring and other 0.8 1.8 11.0 13.1 1.5
Adjusted EBITDA $317.3 $424.6 $454.0 $583.8 $806.5
Adjusted EBITDA attributable to noncontrolling interests (6.1) (7.8) (5.0) (2.4) (6.5)
Adjusted EBITDA attributable to Generac Holdings, Inc. $311.2 $416.8 $449.0 $581.4 $799.9
28ADJUSTED EBITDA
RECONCILIATION
($’S IN MILLIONS)
Net income to Adjusted EBITDA reconciliation Three months ended
June 30, LTM Ended June 30,
2021 2020 2021 2020
(unaudited) (unaudited)
Net income attributable to Generac Holdings. Inc. $127,036 $66,145 $516,000 $255,793
Net income attributable to noncontrolling interests 873 (2,553) 2,069 (3,957)
Net income 127,909 63,592 518,069 251,836
Interest expense 7,721 7,932 31,450 37,805
Depreciation and amortization 21,229 16,803 75,320 66,339
Income taxes provision 46,362 18,473 152,786 61,404
Non-cash write-down and other charges 1,173 (893) (4,413) 1,872
Non-cash share-based compensation expense 6,973 5,400 23,329 18,740
Loss on extinguishment of debt 831 - 831 926
Transaction costs and credit facility fees 5,172 358 7,645 1,627
Loss on pension settlement, restructuring and other 309 11,475 1,465 23,717
Adjusted EBITDA 217,679 123,139 806,481 464,266
Adjusted EBITDA attributable to noncontrolling interests (2,015) (132) (6,535) (2,182)
Adjusted EBITDA attributable to Generac Holdings, Inc. $215,664 $123,007 $799,946 $462,083
29ADJUSTED NET INCOME
AND FREE CASH FLOW RECONCILIATIONS
($’S IN MILLIONS)
Net income to Adjusted net income reconciliation Three months ended
June 30, LTM Ended June 30,
2021 2020 2021 2020
(unaudited) (unaudited)
Net income attributable to Generac Holdings. Inc. $127,036 $66,145 $516,000 $255,793
Net income attributable to noncontrolling interests 873 (2,553) 2,069 (3,957)
Net income 127,909 63,592 518,069 251,836
Provision for income taxes 46,362 18,473 152,786 61,404
Income before provision for income taxes 174,271 82,065 670,855 313,240
Amortization of intangible assets 11,052 7,667 36,863 31,499
Amortization of deferred financing costs and OID 649 644 2,607 3,622
Loss on extinguishment of debt 831 - 831 926
Transaction costs and credit facility fees 4,954 191 4,084 (103)
Loss on pension settlement, restructuring and other - 11,460 (3,646) 24,222
Adjusted net income before provision for income taxes 191,757 102,027 711,594 373,406
Cash income tax expense (37,406) (13,877) (133,775) (44,552)
Adjusted net income $154,351 $88,150 $577,819 $328,854
Adjusted net income attributable to noncontrolling interests (1,121) 342 (3,235) 1,131
Adjusted net income attributable to Generac Holdings. Inc. $153,230 $88,492 $574,584 $329,985
Free Cash Flow Reconciliation
Net cash provided by operating activities $122,450 $101,768 $648,412 $399,387
Proceeds from beneficial interests in securitization transactions 651 706 2,690 $2,558
Expenditures for property and equipment (26,753) (13,438) (90,018) (52,758)
Free cash flow $96,348 $89,036 $561,084 $349,187
30You can also read


