COMPANY PRESENTATION - September 2019 - Mytilineos
←
→
Page content transcription
If your browser does not render page correctly, please read the page content below
September
                            2019

COMPANY PRESENTATION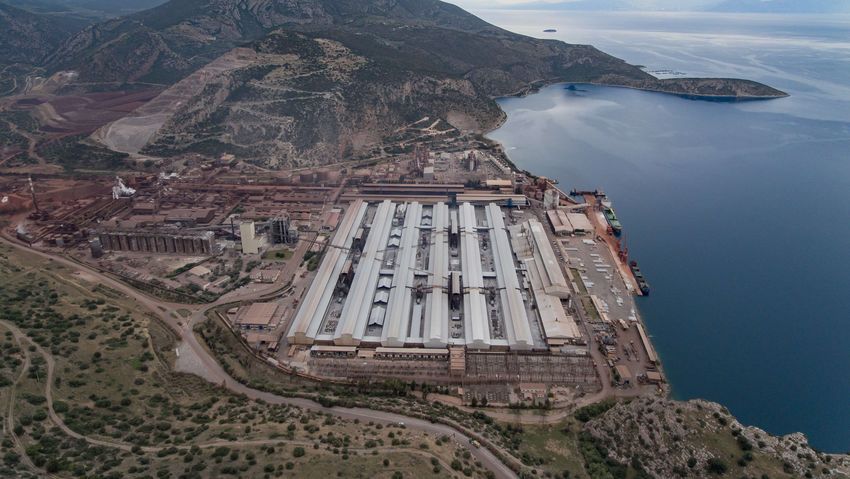
Disclaimer
These preliminary materials and any accompanying oral presentation (together, the “Materials”) have been prepared by MYTILINEOS S.A. (the
“Company”) and are intended solely for the information of the Recipient. The Materials are in draft
form and the analyses and conclusions contained in the Materials are preliminary in nature and subject to further
investigation and analysis.

The Materials are not intended to provide any definitive advice or opinion of any kind and the Materials should not be relied on
for any purpose. The Materials may not be reproduced, in whole or in part, nor summarized, excerpted from, quoted or otherwise publicly
referred to, nor discussed with or disclosed to anyone else without the prior written consent of the Company.

The Company has not verified any of the information provided to it for the purpose of preparing the Materials and no representation or
warranty, express or implied, is made and no responsibility is or will be accepted by the Company
as to or in relation to the accuracy, reliability or completeness of any such information. The conclusions contained in
the Materials constitute the Company’s preliminary views as of the date of the Materials and are based solely on the information received by
it up to the date hereof. The information included in this document may be subject to change
and the Company has no obligation to update any information given in this report. The Recipient will be solely responsible
for conducting its own assessment of the information set out in the Materials and for the underlying business decision to
effect any transaction recommended by, or arising out of, the Materials. The Company has not had made an independent evaluation or
appraisal of the shares, assets or liabilities (contingent or otherwise) of the Company.

All projections and forecasts in the Materials are preliminary illustrative exercises using the assumptions described herein, which assumptions
may or may not prove to be correct. The actual outcome may be materially affected by changes in economic and other circumstances which
cannot be foreseen. No representation or warranty is made that any estimate contained herein will be achieved.

                                                                                                                                                  2
AGENDA

01 MYTILINEOS Overview

02 Key Sector Analysis

03 Appendix

                         3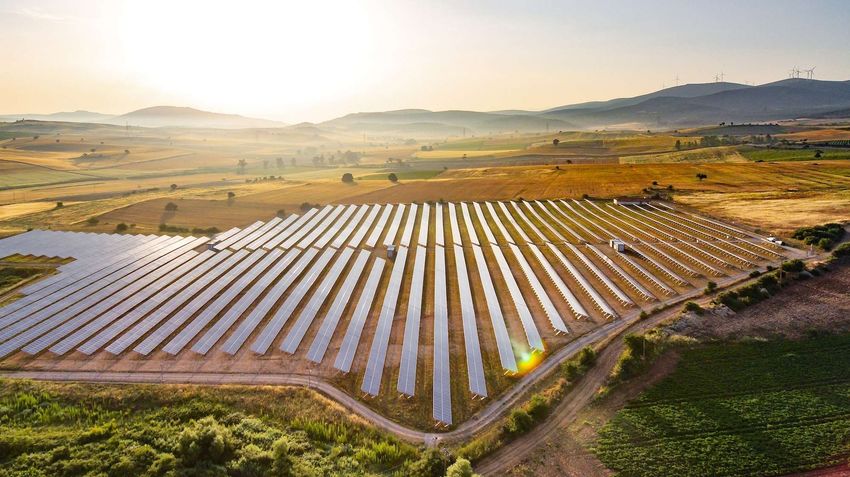
01 MYTILINEOS Overview

                         4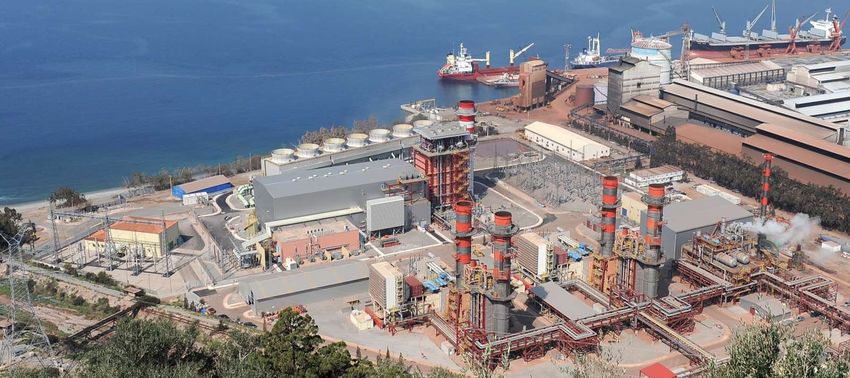
MYTILINEOS Overview

Leading diversified industrial company in South-East
                                                                                                      FY 2018
Europe, founded in 1908 with activities in Metallurgy,
Power & Gas and EPC & Infrastructure
listed on Athens Stock Exchange (ASE) since 1995
                                                                               €1,527 mn revenue

INTERNATIONAL PRESENCE                                                               €290 mn              EBITDA1

                                                                                     €144 mn              NPAT1
                                          >50%
                                          sales outside Greece
                                                                                                             1
                                                                      €1.009/share                        EPS
                                          >2,700
                                          employees
                                                                                      €1.42 bn Market             Cap2

RES projects

Thermal power projects
                                                                 Note 1: Adjusted figures
                                                                 Note 2: Share price as of 9/9/2019
                                                                                                                         5
MYTILINEOS Overview

                                                                                                                  Natural Gas Operations support each
                                                                                                                  business segment through sourcing / trading
                                                                                                                  of LNG and pipeline gas, while maintaining
                                                                                                                  maximum flexibility to select alternative
                                                                                                                  sources and reduce energy costs

   Metallurgy                                                 Power & Gas                                        EPC & Infrastructure
   •   The only vertically integrated producer of             •   Largest domestic independent                   •   EPC contractor specialized in turn-key
       refined alumina and primary aluminium                      electricity producer.                              energy projects.
       in South-East Europe.                                  •   Leading private retail electricity supplier.   •   International presence.
   •   World class assets including bauxite mines,            •   Largest private Natural Gas importer,          •   Strong ties with the global technology
       alumina refinery and aluminium smelter.                    consumer & distributor.                            providers.

   €550mn, 36% of FY18 Revenues                               €608mn, 40% of FY18 Revenues                       €367mn, 24% of FY18 Revenues
   €169mn, 59% of FY18 EBITDA                                 €64mn, 22% of FY18 EBITDA                          €55mn, 19% of FY18 EBITDA

Note: % EBITDA breakdown excludes non-segment related items
                                                                                                                                                                6
MYTILINEOS consistently outperforming the market
                                                                                                         350
                                                                                                                                                               +186%
Share Price Information                                     Shareholder Structure                        300

•   Market Cap*: €1,42 bn / $1,56 bn
•   Total No of shares: 142,891,161
                                                                                                         250

•   Free Float: 73.5%                                                                                    200
•   Listing: FTSE LARGE CAP 25
•   Listed on Athens Exchange (ATHEX)                                                                    150

                                                                                                         100
                                                                                                                                                                 -52%
                                                                                                          50

                                                                                                           0

                                                                                                                                      MYTIL   INDEX

 Liquidity                                                     FTSE Large Cap                                  mn €
                                                                                Average Daily Turnover                                                         €2,40 mn
                                                              Companies Rank
•   Mytilineos is among the most liquid
                                                                 (ex. Banks)
                                                                                  FY2018 (EURO mn)
                                                                                                                                                 Post merger
    shares in Athens Stock exchange                                                                                              Completion
                                                                         1               7.1
•   Ranked 4th in 2018 among FTSE                                                                                     €0,97 mn
                                                                                                                                 of merger

    Large Cap companies ex. Banks                                        2               4.0
                                                                         3               3.2
                                                                MYTILINEOS: 4            2,4
                                                                         5               1.9

Source: Company Information, Bloomberg.   * Share price as of 9/9/2019                                                                                                    7
Strategy: Focused on Long Term Performance
                                   12% CAGR of Book Value per Share in                                                      Become regional leader in each sector through continuous
                                   the last 23 Year                                                Strategy
                                                                                                                            reinvestment while ensuring stable shareholder returns

                                                                                                     Corporate                   Metallurgy
                                                                                                     Restructuring
€/Share                                                                                                                          •   Continuous improvement in productivity & efficiency
                                                                                                 Enter retail
                                                                                                 electricity
                                                                                                                                     to remain within the lowest cost producers
                                                                                      KP CCGT    market                          •   Expansion into scrap recycling via acquisition of EPALME,
                                                                                   (65% owned)
                                                                 Ag Nikolaos
                                                                                     436,6 MW                                        top Aluminium recycler in Greece
                                                                 CCGT 444,8 MW
                                               AoG acquisition                                                                   •   In the process of Basic Engineering Study for a new 1 mn
                                                                 Commence gas
                                                                 imports & trade
                                                                                                                                     tonnes per - year Alumina refinery
                           Start electricity
                           production &                    CHP 334 MW
                           trading
                                                                                                                                 Power & Gas
                                                                                                                                 •   Largest independent power producer
                     METKA
                     acquisition                                                             +51%                                •   Agreement with General Electric in place to provide a 826 MW, H class
                                                                                            in 8 yrs                                 shaft turbine with more than 63% efficiency, to be operational end of 2021
                                                                                                                                 •   Reduction of carbon footprint through further investments in RES
     MYTILINEOS
     listed on ASE                                                                                                               •   Independent leader in the retail electricity market
                                                                         Beginning of
                                                                        operations of 3
                                                                          generators                                             EPC & Infrastructure
                                                                                                                                 •   Focus on gas fired and solar powered energy turn-key
                                                                                                                                     projects in both gas to power & solar
                                                                                                                                 •   Expansion in existing and new developing markets
                                                                                                                                 •   Opportunities on large scale infrastructure projects
                                                                                                                                     in developing countries
 Source: Company Information. /* 2005 – 06 figures adjusted for the acquisition of AoG in 2005 followed by the merger in 2007.                                                                                    8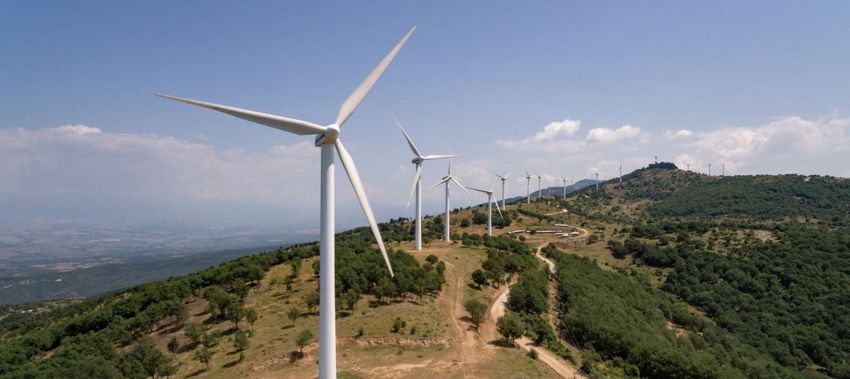
Corporate Governance

Company is aligned with EU and
international best practices

•   Adoption of UK Code with implementation underway
•   SRD II compliant
•   11 member BoD with 64% independence
•   100% independence in both Audit, and Remuneration &
    Nomination Committees
•   Lead Independent Director
•   High disclosure standards
    - Disclosure of board remuneration policy
    - Unbundled BoD elections
    - CEO remuneration contract
•   Dedicated corporate governance department
    (first of its kind in Greece for non-banking listed
    companies)

                                                          9
ESG: Top Tier Scores by ISS                                                      ESG Rating
MYTILINEOS’ strength also lies in its’ respect toward the                     MYTILINEOS is a constituent company in the
environment & heightened social consciousness                                 FTSE4Good Index Series since June 2019 (Score
                                                                              3.9/5). FTSE4Good certificate

                                        May18    Oct18       Dec18    Sep19
 Governance                               9         6           4      5      ESG Score: 55.30 (Average score globally 50.07)
                                                                              GC Score: 59.95 (Average score globally 51.42)
 Broad Structure                          9         7           6      4
 Compensation                             6         6           6      7
 Shareholder Rights                       9         1           1      5                        ESG Score: A-
 Audit & Risk Oversight                   5         5           1      1

                                                                                       ESG Score: 63.64 /100 (Year 2017)
                                                 Oct18       Dec18    Sep19
 Environment                                        2           2      2
 Risk & Opportunities                               1           1      1            Governance and E&S Quality Score:
 Carbon & Climate                                   4           4      4                      Ε:2 S:2 G:5
                                                                                               1 low risk 10 high risk
 Natural Resources                                  1           1      1
 Waste & Toxicity                                   1           1      1

                                                 Oct18       Dec18    Sep19               Water Security Score: B-
 Social                                             1           1      2
 Human Rights                                       2           2      3
 Labor, Health & Safety                             1           1      2
                                                                                      CSR/ESG Overall rating: 61/100
 Stakeholders & Society                             2           2      1
 Product Safety, Quality & Brand                    1           1      1

Latest ISS score as of September 2019     * 1 low risk 10 high risk                                                             10
02 Key Sector Analysis
11Significant Synergies across Sectors
Metallurgy
Supporting with Supporting
Natural Gas Competitive continuous capex
Operations Gas prices plans
Provides steady gas
offtake (crucial for
Power & Gas
Planning)
Power & Gas EPC &
Infrastructure
Supporting key
investment
projects of the
Company
through
construction
expertise
(new CCGT)
12Metallurgy
Activity
• Vertically integrated bauxite, alumina & aluminium producer
• Lowest cost producer in EU for both alumina and aluminium
Presence
• World class assets in Greece
• Exports mainly routed to core European markets
Company Focus
• Strict commitment to employees health & safety
• Continuous cost cutting and product quality improvement
• Increase production volumes through creeping
and debottlenecking
• Innovative technologies to enhance productivity
and performance standards
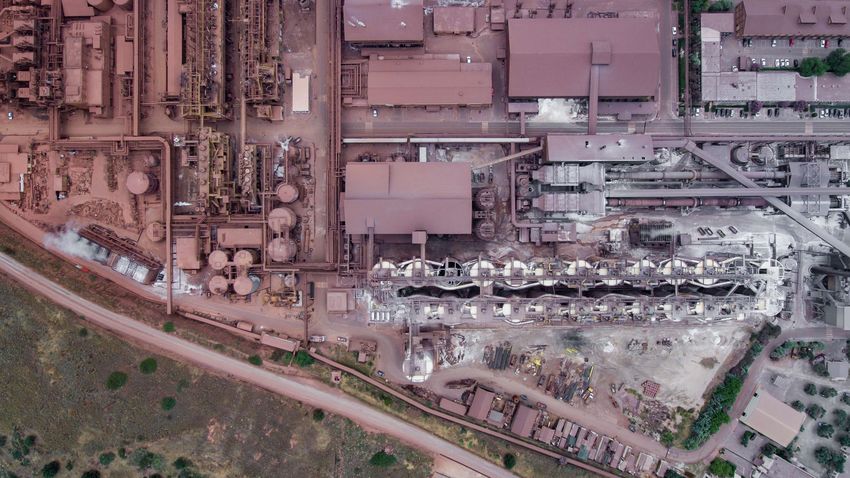
13Metallurgy Unit: Aluminium of Greece Plant
Aluminium Bauxite mine Alumina refinery Aluminium smelter
Value Chain 4 tons of bauxite 2 tons of alumina 1 ton of aluminum
Alumina Refinery
Aluminium Smelter
2 Power Stations
14Fully vertically integrated operations from mine to port
MYTILINEOS is the only vertically integrated bauxite,
alumina and aluminium production plant in Europe
Mytilineos Production Cycle
Own Bauxite Mines Alumina Refinery 17% of total Dedicated 334MW Cogen Alumina Aluminium Smelter Port Facilities – onsite
2nd largest in Europe European output secures steam supply Own use facilities for 45,000T vessels
350 ktpa
Own Bauxite mine
Alumina 820 ktpa Alumium 190 ktpa
600 ktpa
Alumina revenue Aluminium revenue With the acquisition of Greek scrap
recycling company, EPALME, our
470 ktpa sold via offtake contracts Export oriented total capacity
will increase to 250ktpa
within 2 years
15Lowest cost producer in EU for both alumina and aluminium
Implementation of investments and operating
Global Primary Aluminum Smelting Output Cash Cost Curve by Company (before casting) cost reduction programs Boosted the Company
competiveness
1ST QUARTILE 2ND QUARTILE 3RD QUARTILE 4TH QUARTILE
2012 - 2014
“MELLON”
MYTILINEOS Cost Cutting Program
2015 - 2016
“EXCELLENCE”
ROW COMPANIES Cost Cutting Program
CHINESE COMPANIES
2017 – 2018
$/mton % capacity
“The BEST”
Cost Cutting Program
2019 – 2021 (Ongoing)
Global Metallurgical Alumina Refining Output Cash Cost Curve by Company
“Hephaestus”
1ST QUARTILE 2ND QUARTILE 3RD QUARTILE 4TH QUARTILE Cost Cutting Program
Actions & Investments
• Competitive Electricity Tariff, when translated
into USD and adjusting for ETS compensation
• CHP Commercial Operation
• Labor Cost - Productivity
MYTILINEOS
• Logistics – Freight Costs
• Raw Materials
• Replacement of HFO with NG
$/mton of Alumina
% capacity • Investments in new Technology
• Ongoing digitalization of operations
Source: HARBOR Aluminum as of 1Q 2019, MYTILINEOS Company estimate of 1Q 2019 ($/ton) 16Lowest cost Aluminium & Alumina producer in E.U.
Metallurgy Sector EBITDA Annual Performance - All in Aluminium Prices
“MELLON” “EXCELLENCE” “The BEST”
Cost Cutting Program Cost Cutting Program Cost Cutting Program
170
169,0 3.200
160
150 141,5 3.000
140
130
120 2.800
110 98,0
100 87,0 84,3 2.600
90
80
70 58,9 2.400
60
50 2.200
40 31,9 29,3
30 18,2 2.000
20
10
0 1.800
2010 2011 2012 2013 2014 2015 2016 2017 2018
EBITDA (mn. €) All-in Aluminium sales price ($/ton)
Metallurgy Sector 2010 2011 2012 2013 2014 2015 2016 2017 2018
Revenues 501.4 521.3 506.0 435.9 470.8 549.4 447.9 516.9 549.5
EBITDA 58.9 31.9 29.3 18.2 87.0 98.0 84.3 141.5 169.0
EBITDA margin 12% 6% 6% 4% 18% 18% 19% 27% 31%
Safeguarding • Mytilineos reaping the benefits of drastically improved productivity through extensive investments
supporting cost cutting programs (three in a row 2012-14, 2015-16, 2017-18 and a fourth now in place).
profitability through • In 2018 metallurgy sector EBITDA reached a record high €166.0 mn, driven by increased alumina prices.
the cycle • As a result, EBITDA margin reached 30.2% at 2018, a new record high for the unit, largely due to the
contribution of alumina EBITDA margin that reached 47.3%.
Source: Company Information. Bloomberg 17Market Review – Prices
Market Review – Prices
LME & Premium prices Alumina price ($/TN)
1.000 700 30
3.200
900 28
3.000 600
800
2.800 26
700
2.600 600 500 24
2.400 500 22
2.200 400
400 20
2.000 300
300 18
1.800 200
1.600 100 16
200
1.400 0 14
USD/TN USD/TN 100 12
Apr-15
Jul-15
Oct-15
Apr-16
Jul-16
Oct-16
Apr-17
Jul-17
Oct-17
Apr-18
Jul-18
Oct-18
Apr-19
Jul-19
Jan-15
Jan-16
Jan-17
Jan-18
Jan-19
USD/TN % of LME
3mLME All In Price Premium Billet
(left axis) (left axis) (right axis)
Alumina Price % of LME
• Average 1H2019 3mLME prices decreased by 16.3% vs. 1H2018 to $1,850 • Alumina prices in 2018 recorded an unprecedented rise due to the US
per tn., partially counterbalanced by increased aluminium premia (+16%). sanctions that affected the largest alumina and aluminium producer
outside China and the operation of Brazil’s biggest refinery outside
• The major reasons that led prices in June 2019 to a 2½ year low, were the
China at 50% utilization due to environmental reasons.
lift of US sanctions that affected the largest alumina and aluminium
producer outside China, uncertainty regarding US-China trade relations, • In 1H2019 average alumina prices decreased by 17.9% vs. 1H2018 to
worries from the contraction in world manufacturing activity and declining $373 per tn., as in January 2019 the US sanctions lifted and in May 2019
alumina prices amid reduced supply risks Brazil’s refinery resumed normal operations.
Source: CRU, Bloomberg, Company Information 18Power & Gas
Activity
• Power generation capacity from thermal plants (1,200
MW) and renewables (192 MW)
• Wholesale electricity sales and cross border trading
• Retail electricity sales in Greece
Presence
• Largest independent electricity producer in Greece
(10% of total domestic generation)
• Leading private retail electricity supplier
• Largest independent natural gas importer,
consumer and supplier
Company Focus
• Increase of power production
• Increase of retail & wholesale electricity
market share in Greece
• Largest independent utility in Greece
• New round of Renewables Investments underway
• Brand new CCGT 826MW to replace Greece’s ageing
lignite fleet by end 2021
19Growing presence in the domestic market
MYTILINEOS is the largest domestic independent electricity producer
Group Power Production (GWh)
+152
Market Power Production mix Domestic Power Generation from
5.2TWh 5.1TWh 1H19 (25.9 TWh) conventional* units 6M19 (15.4 TWh)
272 311
4.4TWh
188 HYDRO On the Grid
1.731 +32 % 6% Production
1.997 RES
RES 10%
1.563 12% MYTILINEOS 17.0%
2.8TWh Korinthos Power
2.5TWh Net
2.0TWh 2.1TWh 203 Ag. Nikolaos CCGT
PPC
125 N.G. Imports 70.3%
92 624 2.011 113 1.048 31% Other Private
1.475 1.671 CHP 19%
324 Producers 12.7%
602 921 LIGNITE
454
994 22%
534
1.166 1.163 1.146 1.163 1.154
572 577
FY14 FY15 FY16 FY17 FY18 1H18 1H19
MYTILINEOS thermal power plants produced 2.6 TWh during 6Μ 2019 Favourable Prospects ahead
• New H class shaft turbine of 826 MW expected to operate by the end of 2021
32.7% 57.2% solidifies the position of the Company as the largest independent power
of the total gas of the gas • Rising CO2 prices boost natural gas competitiveness over lignite plants
generation generation production of • Installed total RES capacity increased to 192 MW in 1H19 from 129 MW
production the IPPs
in 1H18
• Market impact related to market incumbent, PPC
Source: IPTO, Company Information. * Includes thermal and large hydro units 20Largest domestic independent electricity producer
Investments of over €1 billion in the past ten years has established the Company as the dominant independent power producer in Greece
1.2 GW from Thermal Plants in Greece
CCGT Viotia CCGT Korinthos CHP Viotia
• Combined cycle natural gas fired unit. • Combined cycle natural gas fired unit • Among the largest CHP plants in South Europe
• Gross capacity 444.5MW. • Site located in Korinthos, within the MOH • Gross Capacity 334 MW
• Net efficiency 58% (LHV) refinery complex • 100% owned
• 100% owned • Gross capacity 436.6MW
• Net efficiency 57.7% (LHV)
• 65% owned
192 MW in operation from Renewables Energy Sources
wind solar hydro
174 MW*
Operational
30.2 MW
12MW 6MW
Under construction
Operational Operational
Within 2H 2019
Source: HTSO, Company Information. * Includes 18 MW with lower than 50% participation 21Largest supplier of Natural Gas in Greece
Gas Supply Portfolio
• Natural gas plays a pivotal role in MYTILINEOS business set-up, embedded either directly or indirectly in its Power Production,
Metallurgy, EPC and retail and trading activities, both at local and international level.
• MYTILINEOS has a significant portfolio size, which ensures the constant and uninterrupted supply of natural gas to its associates
(power plants and industrial associates with varying consumption levels).
• MYTILINEOS represents the 32% of the total Greek Market imports and the 46% of the total LNG imports while is expected to
reach a 50% at the end of the year.
• Its portfolio is composed of term contracts (pipeline gas & LNG) and spot purchases.
LNG
• MYTILINEOS has developed a wide network of suppliers with Master Supply Agreements (MSAs) in place
• Its extensive business development activity creates alternative supply and demand options that result in business opportunities at
maturity stage
• Constant communication to secure optimal supply costs:
✓ Already imported: 6 LNG cargoes in 1H 2019 & 5 LNG cargoes in Q3 2019
✓ and booked: 4 LNG cargoes for Q4 2019
• Discussions with various LNG suppliers to book additional LNG cargoes for Q4 2019 and 2020 on a spot or a long-term basis.
Competitive Advantage
• Main Competition: Public Power Corporation (PPC) and 2 IPPs
• MYTILINEOS further to its Pipeline gas supplies, enriches its supply portfolio with LNG imports on an ongoing basis gaining
significant competitive advantage in terms of cost and availability.
• MYTILINEOS average portfolio price ranges from 8% - 30% lower than its competitors relevant gas mix throughout 2019,
depending on LNG and pipeline contribution and market conditions at time.
• This supply position enables the company to successfully acquire material share in the Wholesale NG market by term supplies to
3rd parties on top of its spot transactions
Source: Company Information. 22Sourcing of natural gas at below market rates
MYTILINEOS gas price for 1H 2019 was on average 22% lower than the prevailing gas market price in Greece
33,0
32,0
31,0
30,0
29,0
28,0
27,0
26,0
-9% -6%
€ / ΜWh
25,0 -7%
-18%
-19%
24,0
-26% -15%
23,0 -10%
-13%
22,0
21,0 -11% -17%
-26% -25%
20,0
19,0
WA Gas Price (€/MWh)
18,0
MYT Gas Price Indication (€/MWh)
17,0
16,0
15,0
Jun18 Jul18 Aug18 Sep18 Oct18 Nov18 Dec18 Jan19 Feb19 Mar19 Apr19 May19 Jun19CO2 & SMP Price
CO2 Bid (Avg m-1) SMP
30 80
75,3
25 25,8 25,6
23,1 23,4 70
22,1 69,0
21,1 68,1
20
65,9
62,4
15 60 60,7
14,8 59,9
13,4
56,3
11,6 53,5
10
9,5 51,6
8,4 50 50,3
7,6
05
44,3 2018 2019
2018 2019
00 40
Jan Feb Mar Apr May Jun Jan Feb Mar Apr May Jun
€/tn €/MWh
Source: Bloomberg, IPTO 24Merit Order
MYTILINEOS continues to rank first in the merit order among thermal energy producers
Merit Order based on Bids – 1H 2019
AVG SMP: 66.75 €/MWh
90 (Effective SMP: 69.54 €/MWh) Total Hours
81,4 82,6 82,6 82,9 83,3 83,7 Price Makers per Fuel type % of Hours
80 76,4 76,5 77,3 77,4 77,5 1H 2019
73,8
67,3 67,6 68,3 69,8 70,2
70 Lignite 1,013 23.3%
63,1 63,5 64,4 64,7 65,4
58,8 59,8
60 Gas 2,400 55.3%
50
Hydro 279 6.4%
40
Imports 492 11.3%
30
Exports 155 3.6%
20
Pumping 4 0.1%
10
Total 4,343 100,0%
0
Avg effective CO2: 23,53 €/tn 5,273 100,0%
Fuel + Variable O&M Cost (€/MWh) CO2 Cost (€/MWh) Avg SMP (€/MWh)
25Domestic Retail Electricity Market – Growing market share
Retail Electricity Market – Number of active customers
Protergia consistently ranks first among active customers, reaching 157,550 in June 2019 with 5.1% market share
Protergia: 157,550
Competitor 1: 147,510
Competitor 2: 136,925
Competitor 3: 107,252
Competitor 4: 32,550
Jun-17
Jun-18
Jun-19
Jan-17
Feb-17
Mar-17
Apr-17
May-17
Jul-17
Aug-17
Sep-17
Oct-17
Nov-17
Dec-17
Jan-18
Feb-18
Mar-18
Apr-18
May-18
Jul-18
Aug-18
Sep-18
Oct-18
Nov-18
Dec-18
Jan-19
Feb-19
Mar-19
Apr-19
May-19
Source: IPTO, LAGIE, Company Information. 26EPC & Infrastructure
METKA at a glance
Activity
• EPC contractor, owner and operator of a large portfolio of
thermal power plants and renewables
• World-class manufacturer of high value-added, complex
infrastructure and industrial constructions
Presence
• International presence with projects on 5 continents, in 25
countries throughout Europe, Middle East, Asia and Africa,
Australia and the Americas
• Excellent track record of projects delivered to top tier clients
Company Focus
• Expansion in regional growth markets with strong fundamentals
• Explore new opportunities in local infrastructure projects
• Development and construction of utility scale projects for the
global solar power and energy storage markets
27Leading EPC contractor with International Profile
With over 50 years experience, EPC segment is internationally recognized
segment for its reliability, flexibility and strong execution track-record
ENGINEERING,
PROCUREMENT, OPERATION &
DEVELOPMENT
CONSTRUCTION MAINTENANCE
Activity Sensors
Infrastructure Main domains
Industrial Manufacturing
• METKA, the business unit of the Company, is classified in • RES, Gas Power Plant Solutions and Electricity Transmission &
• 50 years of experience in complex, high value-added
the highest category of construction contractors for Distribution
manufacturing
major public works projects in Greece (including high
value-added construction works for civil infrastructure
• Unique capacity for sophisticated, complex steel
Energy EPC for Power Plants & RES constructions and machining through 2 separate
and industrial projects • Solutions approach – emphasis on identifying the right facilities totaling 35,000 m2
• The company’s solid financial position, along with technology and approach for each project
strategic partnerships with key international players,
• Steel constructions and assemblies used in defense
industry, energy production and infrastructure
enable the Company to pursue its development strategy
RES EPC expertise applications
and expand further its business activities within the
• Significant experience in project development, from initial • Almost 100% exports
infrastructure sector, including also the participation in
planning stage through licensing, financing and construction
“BOOT” type of projects
• Emphasis in Solar Project Development with Solar PV
• The Company has gained capability in environment
construction projects of 800MW+ in Europe, US and Asia
friendly waste management solutions and innovative
• 100MW+ of storage projects
solutions in solid and liquid waste treatment.
• Project development: 200MW+ of successfully connected
projects in several European countries.
28Broad International Presence
Countries with projects completed,
under execution or awarded /
committed
LATAM Africa
Chile Algeria
Puerto Rico Ghana
Libya
Europe Nigeria
Bulgaria Tunisia
Cyprus Uganda
France
Greece Middle East
Romania Jordan
Slovenia Iraq
Spain
Turkey Asia
United Kingdom Afghanistan
Australia
Kazakhstan • Major power plant projects throughout Europe, the Middle East and Africa
Korea • Strong emphasis on highly-efficient power plant technology
Pakistan
RES projects • Strong ties with major technology providers
• Excellent track record of projects delivered to top tier clients
Thermal power projects
• Geographically Diverse
With Strong Partners
29New Orders evolution and Prospects
With over 50 years experience, EPC segment is internationally recognized segment for its reliability, flexibility and strong execution track-record
New Orders Evolution & EBITDA margin Major contributors in unit’s 1Η19 performance
• Ghana: Fast-Track EPC for 250MW Power Plant - Contract price of $369mn I Turnover
1.000 20% €66.9mn
17% 17% 17% 18%
900
16% 17% 17% 18%
800 772 15% 15% 16%
700 14%
• Kazakhstan: EPC 100 MWp Solar Power Plant - Contract price of $78.4mn I Turnover
600 566 12% €36,1mn
512 502
500 437 460 465 10%
389
400 8% • Nigeria: EPC services for four universities, hybrid power generation plants & RES
300 294 6% integrated with energy storage, street lighting and training centers, as well as operation
200 4%
and maintenance services - Contractual price of NGN 12.6 billion I Turnover of €22.2 mn
100 2%
0 0%
2011 2012 2013 2014 2015 2016 2017 2018 1H19
• In total, METKA EGN recorded a contribution of €72.4 mn in 1H19 and EBITDA of €10.8 mn.
(amounts in mil €) New Orders Ebitda margin Post 1H 2019 events:
• PV BOT in Australia - Total capacity of 250MW with signed 10-yr PPA signifies the
expansion into the development, construction and sale of photovoltaic parks worldwide
• Project portfolio with solid financial arrangements, primarily
international (80%) • EPC project for new 110MW CHP plant in Slovenia - Contract price € 118m and completion
• Average annually signed projects of c. €500 mil. in the last 7 yrs. of the facility is expected to bring about a 70% reduction in CO2 emissions to the city of
• Balanced mix of higher margin natural gas-fired power plant Ljubljana.
construction with solar PV projects that have shorter timelines
and lower risk profile
3003 Appendix
311H2019 Results Highlights
Consolidated Financial Results
• Turnover increased by 38.2% to € 990.8 mn vs. € 717.1 mn in the same period of 2018
• EBITDA stood at € 175.3 mn vs. € 145.2 mn in the same period of 2018
• Net profit after minority interests and tax stood at € 81.6 mn vs € 83.9 mn in the same
period of 2018. Earnings per share (EPS) of € 0.571 vs. € 0.587 in the same period of
2018
“The Company during the first half of 2019 has returned to high growth rates with turnover for the first time
approaching the €1 billion mark. MYTILINEOS, based on the positive momentum and synergies created between
the three business units, recorded strong operating cash flows that strengthen its balance sheet and provide
confidence for the successful implementation of our planned investments at the lowest possible cost.”
Evangelos Mytilineos
321H2019 Results Overview – P&L
Geographical Sales
Breakdown
(amounts in mil €)
1Η2019
P&L 1H19 1H18 Δ%
Turnover 990.8 717.1 38.2%
EBITDA 175.3 145.2 20.7%
Other
Depreciation -44.2 -36.7 22%
Net Financial Cost -20.8 -19.9
Greece
Other 0.7 -0.1 56%
EU
PBT 111.0 88.6 25.3% 22%
Income Tax -23.5 -8.5
Discontinuing Operations -1.0 0.0
Non Controlling Interest -4.8 3.8 1Η2018
EATam 81.6 83.9 -2.7%
EPS (€) 0.571 0.587 -2.7%
Other
Margins (%) 1H19 1H18 Δ(bps)
23% Greece
EBITDA 17.7% 20.2% -255 50%
EATam 8.2% 11.7% -346
EU
27%
331H2019 Results Overview – Balance Sheet
(amounts in mil €)
Balance Sheet 1H2019 FY2018
Assets
Tangible & Intangible Assets 1,393 1,377 Cash Flow analysis
Other non current assets 472 481 With the implementation of IFRS 16 as of Jan. 1, 2019
Non Current Assets 1,865 1,858
Inventories 194 184
Trade Receivables 937 799
Other current assets 370 291
Cash & Cash Equivalents 241 208
Current Assets 1,741 1,483
Total Assets 3,606 3,341
Equity 1,595 1,561
Non controlling Interests 57 53
Debt 662 * 598
Trade Payables 706 608
Other Liabilities 643 573
Total Liabilities 2,011 1,780
Total Liabilities & Equity 3,606 3,341
Net Debt 422 390
Key Ratios 1H2019 FY2018
NET DEBT / EBITDA 1.3 1.4
EV / EBITDA 6.0 5.1
EBITDA / NET FIN. EXP. 8.4 7.3
ROCE* 14.06% 13.27%
ROE* 9.00% 9.36%
* Due to the application of IFRS 16 since Jan. 1, 2019, 1H19 Debt includes €52.8 mn of leases
ROCE & ROE calculations are available in 1Η2019 Financial Results Notes 341H2019 Results Overview – Gap Analysis
13,5 68,1 5,7 2,4 990,8
39,7
150,6
717,1 3,1 3,2
24,9 0,5 0,7 7,1 5,0 10,7 175,3
13,5
145,2
9,2 18,9
4,2
23,0
83,9 81,6
8,6 0,9 0,7 15,0
(amounts in mil €)
35Metallurgy
Total volumes
Aluminium
94,326 tons
1H 2019
Total: 329,069 tons
Alumina
234,743 tons
(amounts in mil €)
Revenues EBITDA EBITDA margin
Aluminium
(in mn. €) 1H2019 1H2018 Δ% 1H2019 1H2018 Δ% 1H2019 1H2018 93,762 tons
1H 2018
Alumina 79.6 90.0 -11.6% 29.7 41.7 -28.7% 37.3% 46.3% Total: 339,571 tons Alumina
245,809 tons
Aluminium 214.7 193.1 11.2% 62.7 56.9 10.2% 29.2% 29.5%
Other / Disc. Operations 0.3 0.3 -5.8% 0.1 0.3 -57.4% - -
Total (Cont. Operations) 294.6 283.5 3.9% 92.6 98.9 -6.4% 31.4% 34.9%
36Power & Gas
Revenues EBITDA
460,6
50,3
236,2
12,3
1H2019 1H2018 1H2019 1H2018
(amounts in mil €)
Revenues EBITDA EBITDA margin
(in mn. €) 1H2019 1H2018 Δ% 1H2019 1H2018 Δ% 1H2019 1H2018
Electricity Supply 183.9 113.2 62.4% 6.5 1.1 469.5% 3.5% 1.0%
Electricity Production 162.9 92.0 77.1% 26.7 4.1 557.5% 16.4% 4.4%
Natural Gas Supply 94.8 19.7 381.4% 3.7 -0.2 - 3.9% -
RES 19.0 11.2 69.8% 13.4 7.3 83.3% 70.4% 65.2%
Total 460.6 236.2 95.0% 50.3 12.3 309.1% 10.9% 5.2%
37EPC & Infrastructure
Backlog *
Revenues EBITDA
up to 1
(mn. €) 1-3 years 3-5 years Total
year
235,7
35,0 Libya 83.4 259.6 - 342.9
196,0 Greece 70.6 60.3 73.7 204.6
Spain 160.7 19.3 - 180.0
Ghana 86.2 17.5 - 103.7
34,3 Slovenia 54.0 61.2 - 115.2
Chile 97.7 - - 97.7
Other 144.0 25.7 - 169.7
1H2019 1H2018 Total 696.5 443.5 73.7 1,213.7
1H2019 1H2018
(amounts in mil €) *Note: Backlog related to solar parks amounts to €369.5m
Revenues EBITDA EBITDA margin
(in mn. €) 1H2019 1H2018 Δ% 1H2019 1H2018 Δ% 1H2019 1H2018
EPC & Infrastructure 155.0 126.5 22.5% 23.0 22.1 4.1% 14.9% 17.5%
Solar Parks 72.4 59.6 21.5% 10.8 10.4 3.2% 14.9% 17.5%
Maintenance Services 8.3 9.9 -15.4% 1.2 1.7 -28.1% 14.9% 17.5%
Total 235.7 196.0 20.3% 35.0 34.3 2.2% 14.9% 17.5%
38Metallurgy Unit: Large scale investments
Large scale investments completed to increase efficiency and lower costs
Casthouse CHP Bauxite residue management Flash Kiln
• Increase in production of slabs • Switch from heavy fuel oil use
• The bauxite residues are being filtered,
• Reduction of fuel consumption
dehydrated and stacked
• Improvement in quality to natural gas & production cost
in dry form
• Increasing dimensions • Reduction of total emissions • Reduction of emissions
(length and diameter) • Balancing power cost
• Part of a European Research Program
SCALE in collaboration with NTUA, aimed
• To be completed end of 2019 • Reduction of production cost
at obtaining Rare Earths (Scandium-
• Total cost of €216m
Aluminium alloys from bauxite residues)
• Resulted in cost savings of
over €40m per annum
• Coordinator of RemovAL project with
other partners including ALCOA, RUSAL,
RIO TINTO
39Metallurgy Unit: “Aspra Spitia” fully subsidized community
Aspra Spitia Community
Over 1,000 residencies, in a total area of 61.3 hectares
owned and maintained by Mytilineos company, are
offered to all plant personnel on a subsidized basis
Mytilineos also maintains:
• Schools
• Health services
• Shops
• Open squares
• Cultural and sport facilities
The strong ties between the community and industry
have given rise to a number of plant personnel who are
3rd generation, having grown up within the Aspra Spitia
Community from childhood
40Metallurgy Unit: Alumina production chart
All under one roof
41Metallurgy Unit: Aluminium production chart
All under one roof
42Contact Information
Cleo Lymberis Dimitris Katralis MYTILINEOS S.A.
IR Director IR Officer 8 Artemidos Str.
T: +30 210 6877 412 T: +30 210 6877 476 15125 Maroussi Athens
F: +30 210 6877 400 F: +30 210 6877 400 Greece
E: cleo.lymberis@mytilineos.gr E: dimitrios.katralis@mytilineos.gr T: +30 210 6877 300
43
F: +30 210 6877 400www.mytilineos.gr
You can also read