NOVEMBER 2020 TSX: VLNS OTCQX:VLNCF THEVALENSCOMPANY.COM - The Valens Company
←
→
Page content transcription
If your browser does not render page correctly, please read the page content below

NOVEMBER 2020
T S X : VLNS
OTCQX: VLNCF

               THEVALENSCOMPANY.COM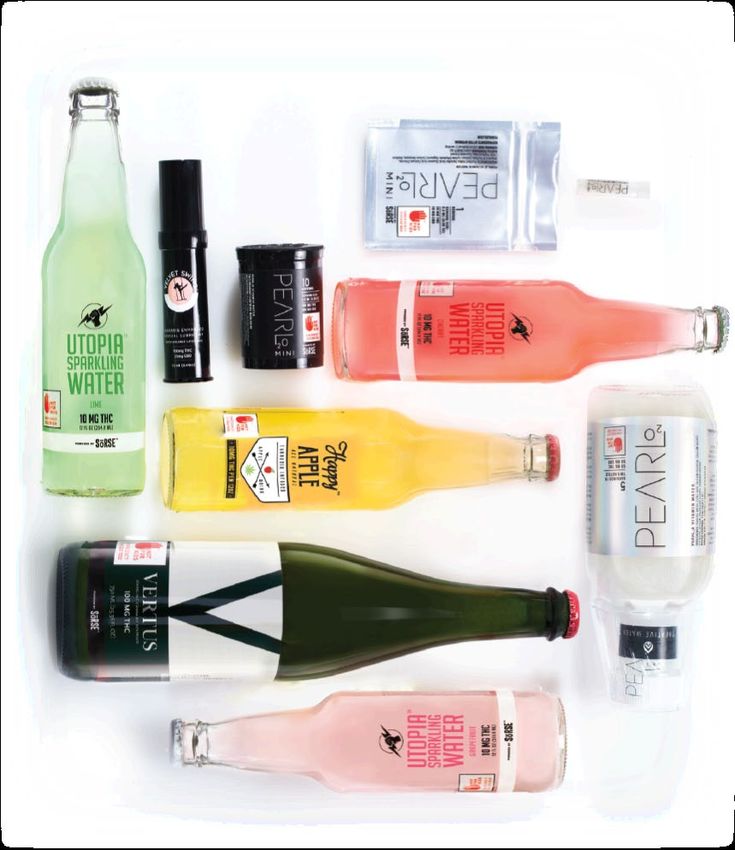
NOTICE TO RECIPIENT
T h i s presentation (the “Presentation”) of The Valens Company Inc. (the “Company,” “The Valens Company” or “Valens”) is an overview
only and does not contain all the information that a prospective investor may require to make investment decisions. T h i s
Presentation is for information purposes only and does not constitute an o f f e r to sell or a solicitation to buy any securities of the
Company. In making an investment decision, investors must rely on their own examination of the Company, including the merits
and risks involved.

FORWARD-LOOKING STATEMENTS
T h i s Presentation contains forward-looking statements and forward-looking information. Often, but not always, forward-looking
statements can be identified by the use of words or phrases or state that certain actions, events or results “may”, “could”, “would”,
“might” or “will” be taken, occur or be achieved. Forward-looking statements involve known and unknown words such as “plans”,
“expects” or “does not expect”, “is expected”, “estimates”, “intends”, “anticipates” or “does not anticipate”, or “believes”, or variations of
such words and risks, uncertainties and other factors which may cause the actual results, performance or achievements of the
Company to be materially different from any future results, performance or achievements expressed or implied by the forward-
looking statements and information.

Examples of such statements include: (A) the financial forecast of the Company; (B) the intention to grow the business and operations
of the Company; (C) anticipated timing for the availability of the Company’s products to market and expected sale prices; (D)expected
growth in the number of users of medical and recreational marijuana anticipated; and (E)the expansion of the Company’s business into
other revenue streams.

Actual results and developments are likely to differ, and may d i f f e r materially, from those expressed or implied by the forward-
looking statements contained in this Presentation. Such forward-looking statements are based on a number of assumptions which
may prove to be incorrect, including, but not limited to: expectations regarding the ability of the Company to raise capital and grow
through acquisitions; growth strategy, joint venture, other commercial opportunities and the ability of the Company to carry out its
stated work program; and expected sources and uses of capital.

There can be no assurance that forward-looking statements will prove to be accurate, as actual results and future events could d i f f e r
materially from those anticipated in such statements. Accordingly, readers should not place undue reliance on forward-looking
statements. The forward-looking statements and information contained in this Presentation are expressly qualified in their
entirety by this cautionary statement.

The forward-looking statements and information included in this Presentation are made as of the date of this Presentation and the
Company assumes no obligation to update such forward-looking statements to reflect new information, subsequent events or
otherwise unless required by applicable securities legislation.

                                                                                              T S X :   V L N S   |   O T C Q X :   V L N C F    2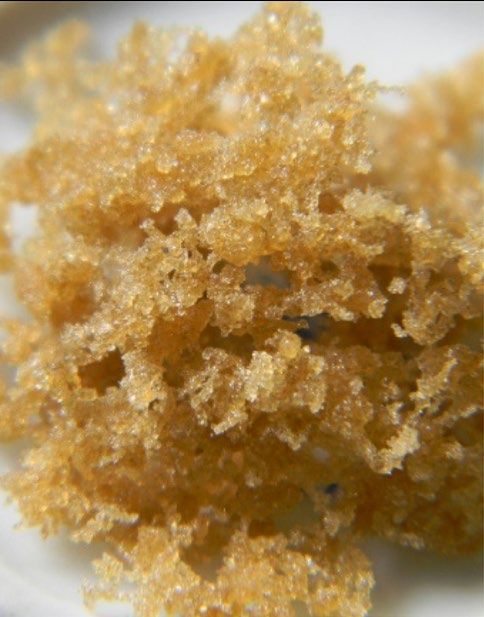
CAUTIONARY NOTE REGARDING FUTURE-ORIENTED FINANCIAL INFORMATION
T o the extent any forward-looking statement in this Presentation constitutes “future-oriented financial information” or “financial
outlooks” within the meaning of applicable Canadian securities laws, such information is being provided to demonstrate the
anticipated market penetration and the reader is cautioned that this information may not be appropriate for any other purpose and the
reader should not place undue reliance on such future-oriented financial information and financial outlooks. Future-oriented financial
information and financial outlooks, as with forward-looking statements generally, are, without limitation, based on the assumptions
and subject to risks as set out above under the heading “Forward-Looking Statements”. The Company’s actual financial position and
results of operations may d i f f e r materially from management’s current expectations and, as a result, the Company’s revenue and
expenses may d i f f e r materially from the revenue and expenses profiles provided in this presentation. Such information is presented
for illustrative purposes only and may not be an indication of the Company’s actual financial position or results of operations.

THIRD-PARTY INFORMATION
T h i s Presentation includes market and industry data which was obtained from various publicly available sources and other sources
believed by the Company to be true. Although the Company believes it to be reliable, the Company has not independently verified any of
the data from third-party sources referred to in this presentation, or analyzed or verified the underlying reports relied upon or
referred to by such sources, or ascertained the underlying assumptions relied upon by such sources. The Company does not make
any representation as to the accuracy of such information.

USE OF NON-GAAP MEASURES
Adjusted E B I T D A is a non-GAAP measure used by management that does not have any standardized meaning prescribed by I F R S
and may not be comparable to similar measures presented by other companies. Management defines adjusted E B I T D A as loss and
comprehensive loss from operations, as reported, before interest, tax, depreciation and amortization, and adjusted for removing share-
based payments, unrealized gains and losses from short term investments and other one-time and non-cash items including
impairment losses. Management believes adjusted E B I T D A is a useful financial metric to assess its operating performance on an
adjusted basis as described above. A description of these financial measures, including a reconciliation of such measures, to the extent
possible, against the most directly comparable I F R S measure, can be found on page 11 of the management’s discussion and analysis of
the Company for the three and six months period ended May 31, 2020.

                                                                                          T S X :   V L N S   |   O T C Q X :   V L N C F   3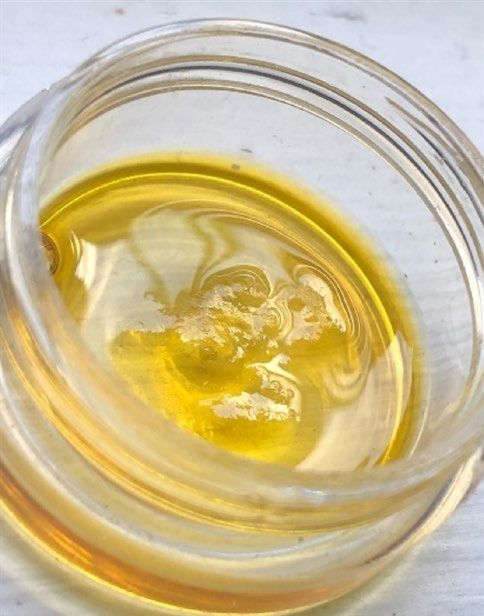
OUR MISSION
        IS TO BRING THE BENEFITS
        OF CANNABIS TO THE
        WORLD.

RECENT ANNOUNCEMENTS
• Launch of premium vape cartridges

     • In partnership with TREC Brands
       under WINK’s product portfolio

     • In partnership with High12 under
       newly-introduced DAIZE brand

• Reported sixth consecutive quarter of
  positive Adjusted EBITDA for third fiscal
  quarter of 2020

             T S X :   V L N S   |   O T C Q X :   V L N C F   4
BE S T PO S IT IO N E D T O DA Y,
AC C E L E R AT ING IN T O T O MOR R O W
CANNABIS PROCESSING AND NEXT GENERATION PRODUCT CAPABILITIES DRIVE OUR ADVANTAGE

BECOMING A GLOBAL ONE-STOP SHOP                        PREPARING FOR THE GROWING MARKET
Providing a full suite of manufacturing                Increasing and improving custom manufacturing
capabilities with the ultimate ability to distribute   capabilities to keep up with expected demand for
products globally to adapt to evolving consumer        cannabis derivative products
and customer demand
                                                       BUILDING REPUTATION
OPERATING WITH GLOBAL STANDARDS                        Gaining more partnerships and establishing The
Readying our business model for exportation to         Valens Company as the trusted partner of choice
high value international markets                       by various leading international brands and
                                                       Consumer Packaged Goods (CPG) companies
PROVIDING UNIQUE, CUSTOMIZED
OFFERINGS
Further developing our unique, IP-based product
technology platform offering customized
manufacturing services

                                                                   T S X :   V L N S   |   O T C Q X :   V L N C F   5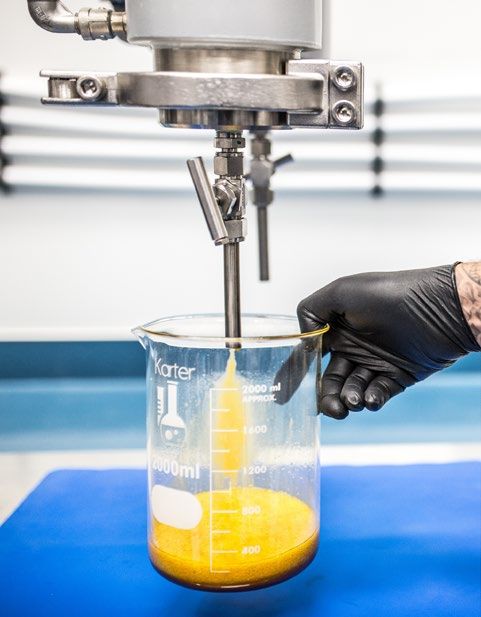
O U R BE L IE F
THE MARKET WILL BE DOMINATED BY OIL-BASED PRODUCTS

                                                                                                        25%
           35%          65%                     49%          51%
                                                                                        75%

                 2017                                 2019                                   FUTURE*

                                     OTHER
                                                                                   PRE-ROLLS
               CONCENTRATES

                                                      6%     9%
                                               9%

   OIL-BASED        EDIBLES
   PRODUCTS                              11%
                                                                                                                    Source: Cowen and
                                                                                   FLOWER                           Company, cannabis
                                                                   42%                                           equity research report
   FLOWER- BASED                                                                                               dated February 24, 2020
   PRODUCTS                                                                                                          (US Market Share).
                                                                                                               *Valens’ forward-looking
                                               23%                                                              prediction in the short-
                         VAPE PENS                                                                               term based on market
                                                                                                                               research

                                                                         T S X :   V L N S   |   O T C Q X :    V L N C F              6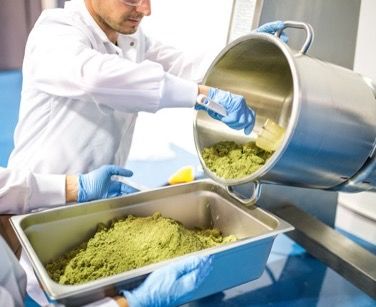
T H E V AL E NS AD V ANT AGE
LEADING THE CANADIAN CANNABIS 2.0 MARKET WITH A FULL SUITE OF MANUFACTURING CAPABILITIES

                             CAPSULES                    TINCTURES                         VAPES   BEVERAGES   CONCENTRATES               TOPICALS                  EDIBLES

                                                                                                                                                  COMING SOON

*Sourced from company presentations, websites and news releases. As at October 30, 2020.

     A W A R D E D     T O P    E X T R A C T I O N     C O M P A N Y
                                                                                                                  T S X :   V L N S   |   O T C Q X :   V L N C F             7
G R O W ING R E T AI L MA R K E T
INCREASED OPPORTUNITY FOR 2.0-FOCUSED COMPANIES LIKE THE VALENS COMPANY
Flower-based and Oil-based Product Sales in AB, BC and
Canadian Annualized Retail Sales (C$,B)
ON (C$,M)
$3.00B $2.88B*
$160M
$140M Post 2.0
$2.50B
$120M
$2.00B
$100M
Pre 2.0
$1.50B $80M
$60M
$1.00B
$40M
$0.50B
$20M
$0.00B $0M
Oct-19
Aug-19
Nov-19
Jan-20
Feb-20
May-20
Sep-19
Apr-20
Jul-20
Aug-20
Dec-19
Jun-20
Mar-20
Oct-18
Feb-19
Oct-19
Feb-20
Apr-19
Aug-19
Apr-20
Aug-20
Jun-19
Jun-20
Dec-18
Dec-19
Flower-based Products Oil-based Products
9 +1K $2.88B*
Product Segments Retail Stores Annualized Revenue
Source: Statistics Canada, Headset
*Annualized sales based on daily retail sales data in August from Statistics Canada.
T S X : V L N S | O T C Q X : V L N C F 8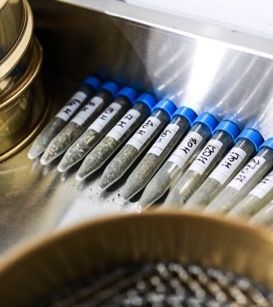
PR O J E C T E D C ANAD IAN R E T AIL C ANNABIS
MAR K E T O PPO R T UN IT Y
CANADA COULD BE AT $10B+ IN SALES IN 2024 BASED ON COLORADO’S GROWTH TRAJECTORY

                                                           OIL-BASED
                                                           PRODUCTS
                                                                                                             ~$2.5B
                                   ~$5.0B                                                         POTENTIAL SIZE OF
                                                                                                OIL-BASED WHOLESALE
                                                                                                MARKET UP FOR GRABS
                                                                                                  BETWEEN LPS AND
                                                                                                  MANUFACTURERS*

                       $10B+
                            2024*                                                          POTENTIAL                                     IMPLIED
                                                                                                                                     REVENUE
                                                                                       MARKET SHARE                              OPPORTUNITY
             ~$5.0B                                                                              10%                                     $250MM
                                                                                                20%                                      $500MM
FLOWER- BASED                                                                                   30%                                      $750MM
PRODUCTS

*C$,B. Used only for illustrative purposes, implies conservative wholesale retail markup of 100% for retailers
Source: Cantor Fitzgerald, Projecting Canada based on the Colorado trajectory, consumer/cannabis equity research report dated June 21, 2020.

                                                                                                   T S X :   V L N S   |   O T C Q X :   V L N C F   9
V AL E NS IN T H E V A L U E C H A I N
 UNLOCKING HIGHER MARGINS FOR OUR CUSTOMERS

              VALENS’ OPERATIONS        PRODUCT      BRANDING               RETAIL
                                     MANUFACTURING                         & SALES

                                       FORMULATION

                             PURIFICATION

                                                            OUR FOCUS
                                                            PROVIDE QUALITY PRODUCTS THAT
                                                            OFFER CUSTOMIZED USER EXPERIENCES
                                                            TO HELP OUR CUSTOMERS BUILD
                                                            DIFFERENTIATED, HIGH VALUE BRANDS
CULTIVATION   EXTRACTION

                                                                T S X :   V L N S   |   O T C Q X :   V L N C F   10
E XT R AC T IO N
CONCEPT IS SIMPLE, QUALITY EXECUTION IS COMPLEX
DRIED
CANNABIS CRUDE OIL OIL REFINEMENT CHROMATOGRAPHY/
OR HEMP OIL (DISTILLATE) SEPARATION
WINTERIZATION (ISOLATE)
OIL
EXTRACTION
T S X : V L N S | O T C Q X : V L N C F 11E XPE R T IS E T H A T D IF F E R E N T I A T E S
DIVERSITY CREATES COMPETITIVE ADVANTAGE
LESS COMMODITIZATION
SUPER/SUB SOLVENT-LESS ETHANOL HYDROCARBON TERPENE
CRITICAL CO2
Capsules, Tinctures, Rosin, Hash, Full Capsules, Tinctures, Concentrates, Vapes, Add back for
Vapes, Topicals, Spectrum Vapes, Topicals, Shatter/Wax, experience, flavour
Beverages, Edibles Beverages, Edibles Crumble/Live Resin, and smell
and Full Spectrum and Others Full Spectrum
ONE SIZE DOES NOT FIT ALL: HIGH QUALITY PRODUCTS NEED CUSTOMIZED PROCESSES
T S X : V L N S | O T C Q X : V L N C F 12BU S INE S S S T R AT E G Y
DELIVERING SUSTAINABLY STRONG EBITDA MARGINS THROUGH THE CYCLE
PHASE 1 EXTRACTION
High margin and low risk entry into market
$ through accelerated scale-up
PHASE 2 CUSTOM MANUFACTURING
Utilize technical expertise to develop unique
$$ product portfolio and maximize margins
PHASE 3 GLOBAL CUSTOM MANUFACTURING
Generate global revenue and high margins in large
$$$ markets by leveraging experience and best practices
T S X : V L N S | O T C Q X : V L N C F 13E XT R AC T IO N E XP E R T IS E F A C IL I T A T E S
R O L L -OUT O F BE S P O K E MA N U F A C T U R IN G
A ONE-STOP-SHOP FOR LEADING LPS AND CPG/BRANDING COMPANIES
EXTRACTION EXTRACTION & WHITE LABEL & CUSTOM MANUFACTURING
MANUFACTURING
+
OTHERS
HIGH QUALITY EXTRACTION NEXT GENERATION PRODUCT DEVELOPMENT
T S X : V L N S | O T C Q X : V L N C F 14T E S T I NG
WE ARE SETTING THE STANDARD
FIRST ISO 17025 ACCREDITED LAB
• Consistent use of validated methodologies
CAN PERFORM ANALYSES IN AS LITTLE AS 2 4 HOURS
• Positioning Valens as the go-to lab with turn arounds 4-5x faster than other leading labs
PUBLISHING FULLY VALIDATED, STANDARDIZED,
AND TURNKEY SOLUTIONS FOR THE GLOBAL CANNABIS INDUSTRY
• Global recognition for methodologies and putting Valens’ name at the forefront of analysis
ADDITIONAL REVENUE SOURCE THROUGH THIRD-PARTY LAB TESTING
• Consistent high margin revenue source, mandated by Health Canada
NAMED A “CENTER OF EXCELLENCE IN PLANT BASED SCIENCE” B Y
Market Cap: 186B*
*As at November 10, 2020
T S X : V L N S | O T C Q X : V L N C F 15V AL E NS IP
CUSTOMIZED USER EXPERIENCES NEED CUSTOMIZED PRODUCT FORMULATIONS
VALENS I S BUILDING A D I V ER S E IP
PORTFOLIO T H A T SPANS ACROSS A L L
T Y P E S OF PRODUCTS AND SERVICES
CANNABINOID AND
TERPENE ISOLATION
SORSE BY VALENS
EMULSION AND
CANNABINOID DELIVERY
C O N C E N T R AT E S
F O R M U L AT I O N S
EXTRACTION C U R RE N T
METHODOLOGIES VALENS’
B E V E RA G E
S O L U T I ON
P R O B L E MS
TESTING
METHODOLOGIES
T S X : V L N S | O T C Q X : V L N C F 16T H IR D - PAR T Y PR O D UC T D E V E L OP ME NT
AND MANU F AC T UR ING
THE FUTURE OF CANNABIS CONSUMPTION
VALENS 1.0 VALENS 2.0
CURRENTLY MANUFACTURING PHASE I PHASE II
CURRENTLY MANUFACTURING H2 2020
Beverages Edibles
Tinctures Two-piece caps
Concentrates Topicals
Soft gels Oral spray Vape pens and More innovative products
cartridges
T S X : V L N S | O T C Q X : V L N C F 17F AC IL IT Y E XPANS IO N F O R W H I T E L A BE L AND
C U S T O M MANU F A C T U R I N G
IP-BASED PRODUCTS TO STRENGTHEN COMPETITIVE ADVANTAGE AND MARGINS
TODAY 2020
230 Carion (K1)
230 Carion (K1) + 180 Carion (K2) GTA Facility
+
Cannabis Processing and Cannabis Processing White Label and Custom Manufacturing
Small-Scale White Label
Crude, Distillate, Full Crude, Distillate, Full Capsules, Tinctures, Vapes, Formulation, Emulsion,
Spectrum, Isolate, Spectrum, Isolate, Sprays, Topicals and Small-Scale Beverage/Edible Co-packing
Formulation and Formulation and Emulsion Beverage Filling
Emulsion
Most output
Most output leaving as a consumer packaged good
leaving as bulk oil
T S X : V L N S | O T C Q X : V L N C F 18AC T IO N PL AN
12 MONTH STRATEGY
1 2
DELIVER ON EXISTING KELOWNA +
CONTRACTS GTA EXPANSION
Optimize existing capacity to Speed to market to maintain
maximize margin advantage
3 4
LAUNCH NEXT GLOBAL EXPANSION
GENERATION Target markets and
opportunities that maximize
PRODUCTS ROI, and export globally with EU
Build IP portfolio with GMP certification
differentiated product offering
A W A R D E D T O P E X T R A C T I O N C O M P A N Y T S X : V L N S | O T C Q X : V L N C F 19I NT E R NAT IO NAL E XPANS IO N
ADVANCED DISCUSSIONS IN KEY MARKETS GLOBALLY
KELOWNA, BC
BOLTON, ON
K1 K2
EU
UNITED STATES CBD
ME X I C O
COLOMBIA
PERU
CURRENT AREAS B R A Z IL
OF INTEREST
LONG TERM AREAS
OF INTEREST URUGUAY
GLOBAL MEDICAL MARKET AUSTRALIA
CURRENT FACILITIES
ALONE ESTIMATED AT $180B
ANNUALLY IN 10-20 YEARS*
PENDING FACILITIES
*Source: Eight Capital Research
T S X : V L N S | O T C Q X : V L N C F 20F INANC IAL S & O U TLOOK
FIRMLY INTO OUR CUSTOM MANUFACTURING AND WHITE LABEL GROWTH PHASE;
FOCUSED ON UNLOCKING SHAREHOLDER VALUE
CAPITALIZATION TABLE $35.0
(In CAD$MM, Unless otherwise noted) $30.6 $32.0
Share Price as of October 30, 2020 $1.62 $30.0
As of August 31, 2020:
Basic Shares O/S 128.3 $25.0
Full Diluted Shares O/S 129.8
Equity Value 210.3 $20.0 $17.6 $18.1 $17.7
$16.5
Cash and Cash Equivalents 30.3 $14.3
ITM Securities 1.2 $15.0
Debt 19.5 $9.8
Enterprise Value 198.4 $10.0
Average Analyst Estimates* 2019 2020 2021 2022 $5.0 $2.7
$1.4
Revenue 58.1 90.4 141.4 195.5
Adjusted EBITDA 27.4 19.7 31.2 52.0 $0.0
EPS -$0.06 -$0.05 $0.05 $0.17
Implied Multiples* 2019 2020 2021 2022 REVENUE (MM) EBITDA (MM)
Valens EV/EBITDA 7.2x 10.3x 6.5x 3.9x
Pharma CMO Average EV/EBITDA* 19.1x 14.2x 12.9x 12.0x 60 56
Packaged Foods CMO Average EV/EBITDA* 11.6x 14.6x 11.3x 8.4x
Canadian Cannabis Peer Average EV/EBITDA* nmf 28.4x 27.0x 14.3x 50
Analyst Target Price*
40 36
Average (10 Analysts) $4.25
Implied Return Potential 162%
30
20
9
10 6
2
*As at October 30, 2020 0
Source: Company Filings, S&P Capital IQ
Q3'19 Q4'19 Q1'20 Q2'20 Q3'20
Note: Shares outstanding and cash balance based on most recent quarterly financials; presented as Treasury Stock
Method. Pharma CMO cohort includes: Catalent Inc., Perrigo Company PLC, Recipharm AB. Packaged Foods CMO
cohort includes: Tate & Lyle PLC, J&J Snack Foods Corp., TreeHouse Foods Inc., Hilton Food Group PLC. Canadian SKUs PRODUCTION (MM of grams)
Cannabis Peers refer t o cohort on next slide.
T S X : V L N S | O T C Q X : V L N C F 21APPE ND IX:
ANALYST OUTLOOK
Broker Date Rating Target ($C)
ATB Financial October 15, 2020 Outperform $4.00
Canaccord Genuity October 15, 2020 Speculative buy $6.00
Desjardins Securities October 15, 2020 Buy $4.00
Eight Capital October 16, 2020 Buy $4.50
Haywood Securities October 15, 2020 Buy $3.50
M Partners October 15, 2020 Buy $5.00
Mackie Research Capital October 19, 2020 Buy $5.00
Raymond James October 15, 2020 Market perform $3.50
RBC Capital Markets October 15, 2020 Outperform $3.25
Stifel GMP October 16, 2020 Buy $3.75
T S X : V L N S | O T C Q X : V L N C F 22APPE ND IX:
KEY MANAGEMENT
Tyler Robson, B.A. & Sc. Jeff Fallows LLB/MBA, CFA
Chair of the Board, Chief Executive Officer & Co-founder President
Mr. Robson has worked extensively over the last decade in Mr. Fallows is an accomplished finance professional with over
cannabis science, focusing on R&D, proprietary extraction 18 years experience working on a wide range of financial
processing and medical application. He attended the University of transactions in the cannabis, consumer products and industrial
Saskatchewan, graduating with a Bachelor of Arts & Sciences products industries. He spent the last 10 years working with a
degree specializing in biology, before returning to Kelowna to number of cannabis companies to raise capital and has advised
pursue his passion for the cannabis industry. Mr. Robson joined on some of the largest transactions in the sector. Prior to joining
The Valens Company in 2012, moved from the role of COO to CEO The Valens Company, Mr. Fallows worked as a Managing Director
in 2017, and has since significantly scaled operations and increased at AltaCorp Capital Inc.
profitability, leading to the Company’s ability to capture market
share and lead the industry as a major player in the supply chain of Everett Knight, CFA
leading Canadian and international brands.
EVP, Corporate Development and Capital Markets
Mr. Knight holds over a decade of experience in
Chris Buysen, MPAcc, CPA, CA Portfolio Management and Private Equity. At Matco Financial, he
Chief Financial Officer launched the first ever institutional long only cannabis mandate in
Mr. Buysen has over 15 years of diverse financial Canada and managed a small cap fund, ranked first in its category.
experience working as a senior financial executive with many He is known for his thought leadership and expertise in
public and private organizations in a wide range of industries. analyzing, lobbying, investing, advising, and consulting
During this time, he was responsible for internal and external throughout the cannabis value chain.
financial reporting, strategic planning, treasury, tax, information
technology, human resources, financial controls and corporate Paul Kunynetz, J.D.
governance.
General Counsel
Mr. Kunynetz practiced law at McCarthy Tétrault in Toronto prior to
Chantel Popoff joining The Valens Company, where he gained extensive
Chief Operating Officer experience working on high-profile and complex transactions. His
Ms. Popoff has over a decade of experience in managing practice focused on mergers and acquisitions,
21+ Western Canadian retail pharmacy chains, including franchisee/distribution, commercial transactions and private
Shoppers Drug Mart. After her time in pharma, she spent over 6 equity with an emphasis on the automotive and cannabis
years in senior managerial roles in the Canadian natural health industries.
food industry.
T S X : V L N S | O T C Q X : V L N C F 23APPE ND IX:
BOARD OF DIRECTORS
Tyler Robson, B.A. & Sc. Karin A. McCaskill, LL.B.
Chair of the Board, CEO and Co-founder Former SVP, General Counsel & Corporate Secretary of Empire
Mr. Robson has over a decade of experience in the cannabis industry, Company Limited and Sobeys Inc.
with expertise in plant genetics and extraction processes. His Ms. McCaskill has been recognized for various achievements within the
contributions and thought leadership in the industry have led to legal community. In her fifteen-year career at Empire and Sobeys, she
recognition from the Kelowna Chamber of Commerce and grew and lead a national legal services team, and provided legal
Marijuana Venture Magazine. leadership on various high-profile transactions.
Ashley McGrath Renee Merrifield, MBA
Director, President & Owner of Glencoe Developments Inc. Chief Executive Officer, Troika Management Corp.
Mr. McGrath has been involved in real estate development for 14 Ms. Merrifield has been awarded various honors for her entrepreneurial
years, overseeing all aspects of the development business and mindset and determination within her community, including founding
oversees the management of multiple development companies in Troika twenty years ago and strategically growing it into a progressive
the commercial, residential and agricultural space. land and real-estate development company.
Deepak Anand
Director, Co-Founder & CEO of Materia Ventures ADVISORS
Mr. Anand is known as global leader in the cannabis sector for his
regulatory, political and industry knowledge. Prior to starting Materia, Phil Donne
he was the VP of Business Development & Regulatory Affairs at
Past President/CEO of Campbell Company of Canada, Past CEO of
Cannabis Compliance Inc.
Kellogg Canada
Mr. Donne brings over 30 years of international brand
Andrew Cockwell, LL.B. management, re-structures and bold brand and communication
Managing Partner, Ursataur Capital Management initiatives including the launch of Vector cereal (the largest new
Mr. Cockwell holds a breadth of experience providing financial and cereal product in 20 years).
legal advisory services in a variety of complex business contexts across
a wide range of industries, in addition to a track record of fostering Brett Channer
value creation for both private and public companies.
CEO of Mass Minority, Past CEO of Saatchi + Saatchi
Mr. Channer has over 25 years of marketing industry
Nitin Kaushal, CPA, CA experience. He was responsible for leading Saatchi Canada to
President, Anik Capital Corp. “Most Improved Agency in Canada,” as well as one of the Top 10
Mr. Kaushal has over 30 years of finance and investment expertise creative agencies in Canada and becoming one of the top
including having held a number of senior roles within Canadian performing agencies for growth in the Saatchi Network.
investment banks, private equity and the venture capital industry.
T S X : V L N S | O T C Q X : V L N C F 24APPE ND IX:
COMP TABLE
SHARE EQUITY ENTERPRISE EBITDA EPS EV/EBITDA
PRICE VALUE VALUE 2020 2021 2022 2020 2021 2022 2020 2021 2022
(C$mm) (C$mm) (C$mm) (C$mm) (C$mm) (C$mm) (C$mm) (C$mm) (C$mm) (x) (x) (x)
Large Cap LPs
Canopy Growth Corporation C$25.03 $9,294 $8,171 -$358 -$230 $152 -$2.65 -$0.86 -$0.28 nmf nmf 53.8x
Aurora Cannabis Inc. C$5.38 $864 $1,202 -$97 $29 $94 -$20.71 -$1.11 -$0.55 nmf 41.4x 12.8x
Tilray, Inc. US$5.71 $1,140 $1,620 -$64 $11 $48 -$2.74 -$1.01 $0.24 nmf 152.8x 33.4x
Aphria Inc. C$5.99 $1,734 $1,800 $36 $92 $157 -$0.42 -$0.03 $0.22 49.7x 19.6x 11.5x
Cronos Group Inc. C$7.07 $2,506 $717 -$134 -$88 -$19 -$0.23 -$0.22 -$0.06 nmf nmf nmf
OrganiGram Holdings Inc. C$1.59 $309 $354 -$26 $20 $31 -$0.62 -$0.05 $0.01 nmf 17.6x 11.5x
HEXO Corp. C$0.81 $392 $299 -$12 $8 $27 -$0.41 -$0.04 $0.00 nmf 36.2x 11.1x
AVERAGE 49.7x 53.5x 22.4x
Mid Cap LPs
Village Farms International, Inc. C$6.16 $412 $452 $10 $30 n.a. $0.11 n.a. n.a. 43.5x 15.0x nmf
Sundial Growers Inc. US$0.14 $48 $173 -$30 -$4 $17 -$0.74 -$0.20 $0.00 nmf nmf 10.0x
The Supreme Cannabis Company, Inc. C$0.12 $60 $186 -$16 $7 n.a. -$0.33 -$0.06 n.a. nmf 27.2x nmf
Zenabis Global Inc. C$0.06 $40 $159 n.a. n.a. n.a. n.a. n.a. n.a. nmf nmf nmf
The Flowr Corporation C$0.44 $64 $167 -$14 $8 $18 -$0.22 -$0.03 $0.02 nmf 20.8x 9.2x
WeedMD Inc. C$0.25 $53 $95 -$12 $30 n.a. -$0.10 $0.05 n.a. nmf 3.2x nmf
The Green Organic Dutchman Holdings C$0.22 $96 $120 -$29 $0 $16 -$0.29 -$0.05 n.a. nmf nmf 7.5x
AVERAGE 43.5x 16.5x 8.9x
Small Cap LPs
Emerald Health Therapeutics, Inc. C$0.20 $41 $67 n.a. $4 n.a. n.a. n.a. n.a. nmf 16.8x nmf
Delta 9 Cannabis Inc. C$0.62 $56 $81 $8 $12 n.a. $0.01 $0.03 n.a. 10.2x 7.0x nmf
VIVO Cannabis Inc. C$0.13 $41 $42 n.a. n.a. n.a. n.a. n.a. n.a. nmf nmf nmf
Decibel Cannabis Company Inc. C$0.07 $24 $63 n.a. n.a. n.a. n.a. n.a. n.a. nmf nmf nmf
Harvest One Cannabis Inc. C$0.05 $11 $18 n.a. n.a. n.a. n.a. n.a. n.a. nmf nmf nmf
AVERAGE 10.2x 11.9x nmf
Extraction Companies
The Valens Company C$1.62 $209 $203 $20 $31 $52 -$0.05 $0.05 $0.17 10.3x 6.5x 3.9x
MediPharm Labs Corp. C$0.81 $117 $104 -$17 $21 $50 -$0.19 $0.01 $0.16 nmf 4.9x 2.1x
Neptune Wellness Solutions Inc. C$2.56 $328 $308 -$31 $33 $63 -$0.64 -$0.38 $0.12 nmf 9.3x 4.9x
Radient Technologies Inc. C$0.09 $29 $43 n.a. n.a. n.a. n.a. n.a. n.a. nmf nmf nmf
AVERAGE 10.3x 6.9x 3.6x
AVERAGE ALL 28.4x 27.0x 14.3x
MEDIAN ALL 26.9x 17.2x 10.6x
Source: Company Filings, S&P Capital IQ a s a t O c t o b e r 3 0 , 2 0 2 0 ; shares outstanding based on most recent quarterly financials and adjusted for share
issuance transactions and other significant publicly disclosed transactions.
T S X : V L N S | O T C Q X : V L N C F 25CONTACT US
T ORONTO 96 Spadina Ave, Suite 400
Toronto, ON
KE LOWNA 230 Carion Rd
Kelowna, BC
E MAI L IR@TheValensCompany.com
PHONE 1 647.956.8254You can also read