INVESTOR PRESENTATION - NOVEMBER 2020 - AVEPOINT
←
→
Page content transcription
If your browser does not render page correctly, please read the page content below

Investor Presentation
November 2020
Disclaimer

Disclaimers

This presentation (“Presentation”) is for informational purposes only. This Presentation shall not constitute an offer to sell, or the solicitation of an offer to buy, any securities, nor shall there be any sale of securities in any states or jurisdictions in which such offer,
solicitation or sale would be unlawful. This Presentation has been prepared to assist interested parties in making their own evaluation with respect to a potential business combination between AvePoint, Inc. (“AvePoint”) and Apex Technology Acquisition
Corporation (“Apex”) and the related transactions (the “Proposed Business Combination”) and for no other purpose. Neither the Securities and Exchange Commission nor any securities commission of any other U.S. or non-U.S. jurisdiction has approved or
disapproved of the Proposed Business Combination presented herein, or determined that this Presentation is truthful or complete. No representations or warranties, express or implied are given in, or in respect of, this Presentation. To the fullest extent permitted
by law in no circumstances will Apex, AvePoint or any of their respective subsidiaries, stockholders, affiliates, representatives, directors, officers, employees, advisers, or agents by responsible or liable for a direct, indirect, or consequential loss or loss of profit
arising from the use of this Presentation its contents, its omissions, reliance on the information contained within it, or on opinions communicated in relation thereto or otherwise arising in connection therewith. Industry and market data used in this Presentation
have been obtained from third-party industry publications and sources as well as from research reports prepared for other purposes. Neither Apex nor AvePoint has independently verified the data obtained from these sources and cannot assure you of the data’s
accuracy or completeness. This data is subject to change. In addition, this Presentation does not purport to be all-inclusive or to contain all of the information that may be required to make a full analysis of AvePoint or the Proposed Business Combination. Viewers
of this Presentation should each make their own evaluation of AvePoint and of the relevance and adequacy of the information and should make such other investigations as they deem necessary. References in this Presentation to our “partners” or “partnerships”
with technology companies, governmental entities, universities or others do not denote that our relationship with any such party is in a legal partnership form, but rather is a generic reference to our contractual relationship with such party.

Forward Looking Statements
Certain statements included in this Presentation that are not historical facts are forward-looking statements for purposes of the safe harbor provisions under the United States Private Securities Litigation Reform Act of 1995. Forward-looking statements generally
are accompanied by words such as “believe,” “may,” “will,” “estimate,” “continue,” “anticipate,” “intend,” “expect,” “should,” “would,” “plan,” “predict,” “potential,” “seem,” “seek,” “future,” “outlook,” and similar expressions that predict or indicate future
events or trends or that are not statements of historical matters. These forward-looking statements include, but are not limited to, statements regarding estimates and forecasts of other financial and performance metrics and projections of market opportunity.
These statements are based on various assumptions, whether or not identified in this Presentation, and on the current expectations of the respective management of AvePoint and Apex and are not predictions of actual performance. These forward-looking
statements are provided for illustrative purposes only and are not intended to serve as, and must not be relied on by an investor as, a guarantee, an assurance, a prediction, or a definitive statement of fact or probability. Actual events and circumstances are
difficult or impossible to predict and will differ from assumptions. Many actual events and circumstances are beyond the control of AvePoint and Apex. These forward-looking statements are subject to a number of risks and uncertainties, including changes in
domestic and foreign business, market, financial, political, and legal conditions; the inability of the parties to successfully or timely consummate the Proposed Business Combination, including the risk that any regulatory approvals are not obtained, are delayed or
are subject to unanticipated conditions that could adversely affect the combined company or the expected benefits of the Proposed Business Combination or that the approval of the stockholders of Apex or AvePoint is not obtained; failure to realize the
anticipated benefits of the Proposed Business Combination; risks relating to the uncertainty of the projected financial information with respect to AvePoint; risks related to the performance of AvePoint’s business and the timing of expected business or revenue
milestones; the effects of competition on AvePoint’s business; the amount of redemption requests made by Apex’s stockholders; the ability of Apex or AvePoint to issue equity or equity-linked securities or obtain debt financing in connection with the Proposed
Business Combination or in the future, and those factors discussed in Apex’s annual report on Form 10-K filed with the SEC on March 27, 2020 under the heading “Risk Factors,” and other documents Apex has filed, or will file, with the SEC. If any of these risks
materialize or our assumptions prove incorrect, actual results could differ materially from the results implied by these forward-looking statements. There may be additional risks that neither Apex nor AvePoint presently know, or that Apex nor AvePoint currently
believe are immaterial, that could also cause actual results to differ from those contained in the forward-looking statements. In addition, forward-looking statements reflect Apex’s and AvePoint’s expectations, plans, or forecasts of future events and views as of
the date of this Presentation. Apex and AvePoint anticipate that subsequent events and developments will cause Apex’s and AvePoint’s assessments to change. However, while Apex and AvePoint may elect to update these forward-looking statements at some
point in the future, Apex and AvePoint specifically disclaim any obligation to do so. These forward-looking statements should not be relied upon as representing Apex’s and AvePoint’s assessments of any date subsequent to the date of his Presentation.
Accordingly, undue reliance should not be placed upon the forward-looking statements.

Use of Projections
This Presentation contains projected financial information. Such projected financial information constitutes forward-looking information, and is for illustrative purposes only and should not be relied upon as necessarily being indicative of future results. The
assumptions and estimates underling such financial forecast information are inherently uncertain and are subject to a wide variety of significant business, economic, competitive, and other risks and uncertainties. See “Forward-Looking Statements” above. Actual
results may differ materially from the results contemplated by the financial forecast information contained in this Presentation, and the inclusion of such information in this Presentation should not be regarded as a representation by any person that the results
reflected in such forecasts will be achieved.

Use of Data
The data contained herein is derived from various internal and external sources. No representation is made as to the reasonableness of the assumptions made within or the accuracy or completeness of any projections or modeling or any other information
contained herein. Any data on past performance or modeling contained herein is not an indication as to future performance. Apex and AvePoint assume no obligation to update the information in this presentation.

Use of Non-GAAP Financial Metrics and Other Key Financial Metrics
This presentation includes certain non-GAAP financial measures (including on a forward-looking basis) such as EBIT and EBIT Margin. AvePoint defines EBIT as net income (loss), adjusted for interest expense, stock-based compensation, legal expenses,
government grants, ASC 606 consulting fees, and other interest income, and income taxes. EBIT Margin is EBIT divided by total revenue. These non-GAAP measures are an addition, and not a substitute for or superior to measures of financial performance prepared
in accordance with GAAP and should not be considered as an alternative to net income, operating income or any other performance measures derived in accordance with GAAP. Reconciliations of non-GAAP measures to their most directly comparable GAAP
counterparts are included in the Appendix to this presentation.
AvePoint believes that these non-GAAP measures of financial results (including on a forward-looking basis) provide useful supplemental information to investors about AvePoint. AvePoint’s management uses forward looking non-GAAP measures to evaluate
AvePoint’s projected financial and operating performance. However, there are a number of limitations related to the use of these non-GAAP measures and their nearest GAAP equivalents. For example other companies may calculate non-GAAP measures
differently, or may use other measures to calculate their financial performance, and therefore AvePoint’s non-GAAP measures may not be directly comparable to similarly titled measures of other companies.
In addition to the non-GAAP metrics described above, AvePoint management uses the key financial metric annual recurring revenue ("ARR"). ARR is calculated for a particular period as the sum of (1) for customers with a contract duration in excess of three
months, the annual contract value as of the end of the period, which is equal to the fixed amount of annual fees for subscription, maintenance and distribution for which the customer has a minimum contractual commitment, and (2) for customers with a contract
duration of three months or less, the currently monthly fees for subscription, maintenance and distribution multiplied by twelve.

Participants in Solicitation
Apex and AvePoint and their respective directors and executive officers, under SEC rules, may be deemed to be participants in the solicitation of proxies of Apex’s shareholders in connection with the proposed business combination. Investors and security holders
may obtain more detailed information regarding the names and interests in the proposed business combination of Apex’s directors and officers in Apex’s filings with the Securities and Exchange Commission (the “SEC”), including Apex’s registration statement on
Form S-1, which was originally filed with the SEC on August 15, 2019. To the extent that holdings of Apex’s securities have changed from the amounts reported in Apex’s registration statement on Form S-1, such changes have been or will be reflected on
Statements of Change in Ownership on Form 4 filed with the SEC. Information regarding the persons who may, under SEC rules, be deemed participants in the solicitation of proxies to Apex’s shareholders in connection with the proposed business combination is
set forth in the proxy statement/prospectus on Form S-4 for the proposed business combination, which is expected to be filed by Apex with the SEC.
Investors and security holders of Apex and AvePoint are urged to read the proxy statement/prospectus and other relevant documents that will be filed with the SEC carefully and in their entirety when they become available because they will contain important
information about the proposed business combination. Investors and security holders will be able to obtain free copies of the proxy statement and other documents containing important information about Apex and AvePoint through the website maintained by
the SEC at www.sec.gov. Copies of the documents filed with the SEC by Apex can be obtained free of charge by directing a written request to Apex at 533 Airport Blvd. Suite 400 Burlingame, CA 94010 or by emailing admin@apexacquisitioncorp.com.

                                                                                                                                                                                                                                                                                        2
Apex Technology Acquisition Corp. (NASDAQ: APXT)
Executive Team and Board
Jeff Epstein Brad Koenig
Co-CEO and CFO Co-CEO
Operating Partner at Bessemer Venture Partners Professional career: Partner, 15+ years as the Global Head of Technology
Advises over 100 portfolio companies; daily interactions with CEOs and Investment Banking at Goldman Sachs
CFOs ― Moved to Silicon Valley in 1987 to lead and grow the Technology practice
Served on 20 boards and advisory boards over the past 8 years ― Presence grew to multiple global locations under his tenure, including London,
Professional career: Tokyo, China, Hong Kong, Frankfurt
― Group revenue grew from $25mm to $1bn+
― Headcount grew from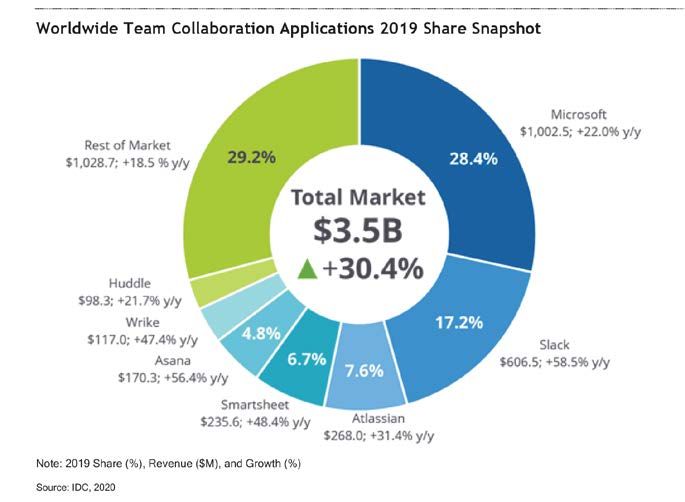
AvePoint: Apex Technology Investment Thesis

                         Market leading SaaS company

                   Highly capable, technical leadership team

                     Powerful tailwinds for Microsoft Cloud

                Key leader in Microsoft Cloud data management

                  High quality and diversified customer base

                Compelling financial results and business model

                              Attractive valuation

                                                                  4
Summary Transaction Overview
AvePoint, Inc. (“AvePoint”) and Apex Technology Acquisition Corp., “Apex” (NASDAQ: APXT) to combine to
create a publicly listed company with a ~$2bn market capitalization(1)
Transaction
Description Post-closing entity will be listed on NASDAQ under new ticker, AVPT, and maintain the AvePoint name
The transaction is expected to close in the first quarter of 2021
Implied enterprise value of 9.0x 2021E revenue
Existing AvePoint shareholders will be paid $257mm in cash consideration and issued 143.4mm shares in new
Transaction AvePoint shares
Structure Transaction to be funded by a combination of approximately $352mm(2) Apex cash in trust and committed PIPE
of $140 mm from institutional investors, led by Federated Kaufmann
AvePoint is expected to have $252mm in cash on its balance sheet pro forma for the transaction
Pro Forma
72% existing shareholders, 21% Apex public shareholders and founder shares and 7% PIPE investors
Ownership
AvePoint co-founder and current CEO Tianyi (“TJ”) Jiang will continue to serve as CEO
AvePoint co-founder and current Executive Chairman Xunkai (“Kai”) Gong will continue to serve as Executive
Governance Chairman
Jeff Epstein to join the Board of Directors and Brad Koenig to join as Board Observer
Expected Board of Directors: 7 members, of which majority are independents
1) Based on a $10.00 share price. 2) As of 30-Sep-2020. Note: Refer to transaction summary page for further detail.
5
Experienced and Proven AvePoint Management Team

       Tianyi (“TJ”) Jiang              Xunkai (“Kai”) Gong                 Brian Brown                     Sophia Wu
      Chief Executive Officer            Executive Chairman              General Counsel &            Chief Financial Officer
                                                                       Chief Operating Officer
23 Years Industry Experience       35 Years Industry Experience   22 Years Industry Experience   20 Years Industry Experience

      Notable Experience                 Notable Experience             Notable Experience             Notable Experience

        Dana Simberkoff                       Wei Chen                    Mario Carvajal                    Andy Yong
          Chief Privacy,               Chief Technology Officer         Chief Strategy officer       Chief Investment Officer
  Information Technology Officer
22 Years Industry Experience       22 Years Industry Experience   24 Years Industry Experience   30 Years Industry Experience

      Notable Experience                 Notable Experience             Notable Experience             Notable Experience

                                                                                                                                6
Company Overview
7AvePoint is the Leading Data Management Solutions Provider for
the Microsoft Cloud
A Data Management Leader in Massive and Rapidly Growing Microsoft Cloud Marketplace
• TAM growth to ~$33bn by 20221
Large, Established Global Presence
• Over 1,300 employees in 29 global offices
• Approximately 7mm cloud users / 16k accounts
A Top Microsoft Strategic Cloud Partner
• Microsoft success in cloud dependent partnership
• 5x Global Partner of the Year Winner
• Transformation, governance, and compliance
Compelling Growth Vectors
• R&D driving increased product line
• Expanding channel and distribution partnerships (SMB initiative)
• International expansion
• Selling more to existing customers though investment in sales and customer success
~30% ~14%
$148mm Fresh Capital to Invest
ARR EBIT
Revenue2 in Growth
Growth Margin2
Note: Figures as of 30-Sep-2020 unless otherwise noted. Annual recurring revenue includes subscription, maintenance, and distribution revenue. EBIT reflects Non-GAAP metric, see reconciliation in Appendix. 1Refer to TAM slide in deck for detailed sources. 2Reflects annual metric.
8All Organizations Need Help Managing Their Data
Amount of data Data Governance Failure Penalties
growing fast hard and getting large and getting
harder larger
How to protect and back up Privacy
Who can access Cybersecurity
When to alert
When to delete
How to audit
9Digital Transformation Has Accelerated During the Pandemic, With
Microsoft Cloud Gaining Significant Momentum
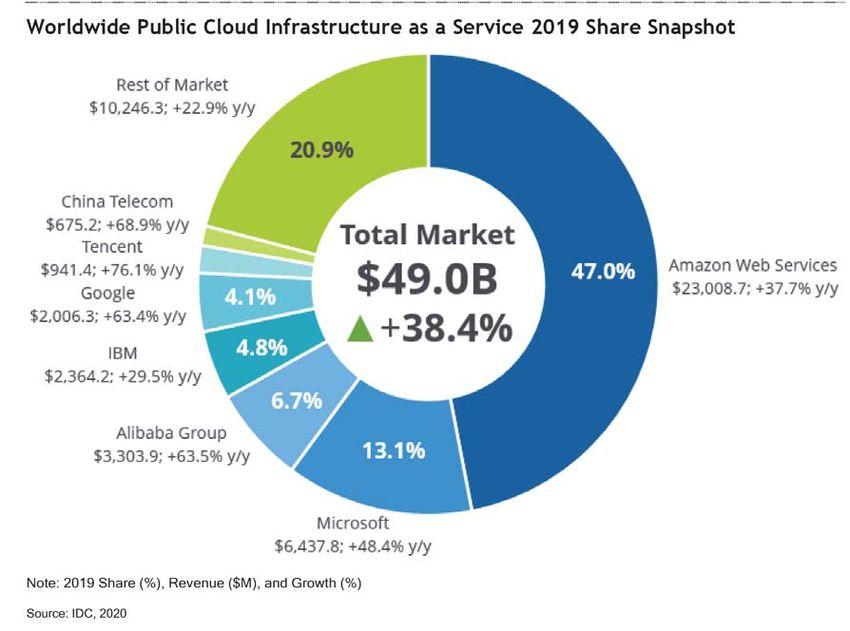
$48.4bn
Cloud LTM Revenue4
Microsoft Market Share
Productivity and
IaaS5 SaaS6 Collaboration7
AWS - 47% Microsoft - 11% Microsoft - 28%
Microsoft - 13% Salesforce - 8% Slack - 17%
Alibaba - 7% Oracle - 4% Atlassian - 8%
Total
Market $49bn5 $184bn6 $3bn7
1) Gallup Poll, https://news.gallup.com/poll/306695/workers-discovering-affinity-remote-work.aspx, April 2020. 2) Gartner Press Release, https://www.gartner.com/en/newsroom/press-releases/2020-07-23-gartner-forecasts-worldwide-public-cloud-revenue-to-grow-6point3-percent-in-2020
(July-2020). 3) PriceWaterhouseCoopers Research, https://www.pwc.com/us/en/industries/tmt/library/covid19-cloud-infrastructure.html, (2020). 4) Microsoft Public Filings, Intelligent Cloud LTM revenue as of Jun-2020. 5) Worldwide Public Cloud Infrastructure as a Service Market Shares 2019,
IDC (July 2020). 6) Worldwide Software as a Service and Cloud Software Market Shares, 2019, IDC (July 2020). 7) Worldwide Team Collaboration Applications Market Shares 2019, IDC (August 2020).
10We Bridge the Gap Between What Microsoft Cloud Offers
and What the Enterprise Requires
What What the
Microsoft Cloud Offers Enterprise Requires
Compliance
Seamless Better
Collaboration Decision Governance
Office Making Transformation
Integration
Office Tools
Cloud On-Premise
Leader in Digital Infrastructure
Transformation Agnostic
Solves meaningful pain points to help organizations achieve their business goals on Microsoft 365
11AvePoint Solves Data Management Challenges at Any Stage
in the Customer Cloud Journey
• Information Lifecycle Management • Content & Collaboration Security • File Analysis and Discovery
• Delegated Administration • Operational Governance/SaaS Mgmt • Data Retention
• Managed, Automated End-User Services • Asset Management • Records Management
• Cloud Migration and Consolidation • Internal / External Sharing Governance • Data Classification, Audit, Protection
Government Financial Services Pharma & Health High Technology Retail Education Communications
12AvePoint Advantage
Limitations of Existing Solutions
Microsoft Utilizes full benefits of Microsoft
Lack Microsoft expertise
Cloud Focus Cloud
Data
Protects and prioritizes data Challenged data protection
Protection
Significant expertise in compliance Do not adequately address
Compliance management compliance risk
Do not enable enhanced
Collaboration Enhances collaboration
collaboration
Scalability Enterprise scalability Unable to serve all organizations
Total Cost of
High ROI for organization Cost ineffective
Ownership
Automates tasks for response and Minimal focus on simplifying
Automation delivery operations
13Large and Growing Addressable Market
Digital
Transformation $1.8tn
TAM
Security Cloud Integration
by 20224
Compliance1 & Migration2
$7.2bn $3.1bn Additional
Cloud
~$33bn
by 20225
MSFT Cloud
Growth
DPaaS3
$4.8bn Current ~$5bn6
MSFT Cloud
Size
AvePoint
Growth Outlook 2020 Future
Microsoft 365 Users 250mm 500mm ~13% MSFT ~$1bn7
Cloud
AvePoint Share of total 3% 10% Penetration
AvePoint Users 7mm 50mm
148mm8
Revenue
1) Worldwide Data Services for Hybrid Cloud Forecast 2018-2022, 2017 Market Forecast, IDC , (July2018). 2) Cloud Migration Market Size, Share, Trends Forecast (2018-2023), 2017 Market Forecast, Mordor Intelligence, (April 2018). 3) Worldwide Data Protection as a Service Forecast, 2018–
2022 Initial Market Sizing, 2017 Market Forecast, IDC, (July 2018). 4) Worldwide Digital Transformation (DX) Investment Trends in a COVID World, Post-COVID 19 Direct DX Investment, IDC (August 2020). 5) Sum of Security Compliance, Cloud Integration & Migration and Data Protection As a
Service Markets projected in 2022. 6) Assuming 100% penetration of ~250 million Microsoft Cloud users. 7) Assuming 13% penetration of ~250 million Microsoft Cloud users. 8) AvePoint management estimates. 9) Microsoft FY20 Q3 earnings call. Microsoft has 258 million paid seats of
Microsoft Office 365. https://www.microsoft.com/en-us/Investor/events/FY-2020/earnings-fy-2020-q3.aspx.
14Representative Customers: Diversified Blue Chip Base
Communications Retail / Consumer Pharma & Health Financial Services Gov’t / Education High Technology
US Treasury US
Department Department
of State
15AvePoint Has Multiple Avenues for Growth
Further
International
Expansion
Expand Target
Capture Entire Industry Focus
Microsoft Cloud
Increase SMB Customer Base
Sell More to Footprint
AvePoint
Existing positioned to
Customers execute on all key
AvePoint already growth areas
has a strong globally
Microsoft Cloud is command in several
expanding rapidly verticals
Invest to grow to
ARR organically AvePoint currently Room for additional
Continue improving has ~3% of the pie
net retention purpose-built
Sales force with significant solutions
efficiency room to grow
Newly expanded
Customer Success Additional JVs No meaningful
Group competition in the
M&A opportunities
Substantial upside space
to current net Dedicated SMB
retention rate of Team
106% 50PB+
~250 million1 127 Customer data managed
~100 Marketplaces Microsoft Cloud users not Person sales team with across 12 Global Cloud
and growing globally deploying AvePoint >70 being added Instances
1 Microsoft FY20 Q3 earnings call. Microsoft has 258 million paid seats of Microsoft Office 365. https://www.microsoft.com/en-us/Investor/events/FY-2020/earnings-fy-2020-q3.aspx. Note metrics as of October 2020 unless otherwise noted.
16Financials
17Highly Attractive Financial Profile
Quarterly Core ARR1 ($mm)
$101
$95
$90
$85
$75 $78
2019 Q1 2019 Q2 2019 Q3 2019 Q4 2020 Q1 2020 Q2
% YoY ARR
18% 19% 23% 25% 27% 29%
Growth
Annual Revenue and Recurring Revenue2 ($mm)
$257 CAGR
$220 ’19A-’22E
$193
$148 $157
$117 $115 38%
$83
30%
2019A 2020E 2021E 2022E
Recurring Revenue Revenue
Source: AvePoint Management.. 1) Includes subscription and maintenance revenues. 2) Includes subscription, maintenance, and distribution channel revenues.
18Summary Financial Profile
(US$ in millions) YTD 2019 YTD 2020 2019A 2020E 2021E 2022E '19A - '22E
Total Revenue $51 $66 $117 $148 $193 $257 30%
% Growth 29% 26% 30% 33%
Recurring Revenue 1 $36 $49 $83 $115 $157 $220 38%
% Growth 34% 39% 36% 40%
% of Revenue 71% 74% 71% 78% 81% 85%
Gross Profit $36 $46 $81 $107 $139 $191 33%
% Margin 70% 71% 69% 72% 72% 74%
EBIT (Non-GAAP) 2 ($7) $4 ($4) $21 $8 $17
% of Revenue (13%) 6% (3%) 14% 4% 7%
Source: AvePoint Management. Note: YTD metrics as of June 30, 2019 and 2020. 1) Includes subscription, maintenance, and distribution channel revenues. 2) See appendix for GAAP to non-GAAP reconciliation.
19Transaction Summary
1
Overview Post-Transaction Ownership
• Fully distributed pro forma enterprise value of $1.7bn,1 or
9.0x CY21E revenue of $193mm and 6.8x CY22E revenue of Apex Founder & Private PIPE Investors
$257mm Placement Shares 7.0%
• Existing AvePoint Shareholders are expected to own 72.0% 3.3%
of the company1
• PIPE Investors are expected to own 7.0% of the company1 Apex Public Existing AvePoint
Shareholders Shareholders
• Expected to close in Q1’21
17.6% 72.0%
Enterprise Value ($mm) Sources and Uses ($mm)
Enterprise Value Calculation Sources
1
Shares Outstanding (mm) 199.0 Apex Cash in Trust $352
(x) Share Price $10.00 PIPE Proceeds 140
2
Equity Value $1,990 Cash on Balance Sheet 64
(-) Net Cash (252) Equity Rollover 1,434
Enterprise Value $1,738 Total Sources $1,989
Uses
Transaction Multiples
Cash to AvePoint Shareholders 3 $257
Enterprise Value / 2021E Revenue 9.0x
Cash to Balance Sheet 252
Enterprise Value / 2022E Revenue 6.8x
Transaction Costs 4 47
Equity Rollover 1,434
Total Uses $1,989
1) Represents ownership at close. Share count of 199.0mm composed of 1) 143.4mm shares held by existing AvePoint shareholders; 2) 35.0mm shares held by Apex public shareholders; 3) 14.0mm shares held by PIPE Investors; 4) 5.83mm of Apex Sponsor promote shares; and 5) 0.81mm of
Apex private placement shares. 143.4mm shares held by existing AvePoint shareholders reflect 117.0mm Apex common stock and 33.3mm rolled vested and unvested options (with weighted average exercise price of approximately $2.10) to be issued at closing of the merger, calculated based
on treasury stock method. Share count of 199.0mm excludes 1) 17.9mm Apex public and private warrants (with strike price of $11.50 and redeemable at $18.00 / share); 2) 3mm seller earnout shares (composed of three equal tranches with target price of $12.50, $15.00 and $17.50); and 3)
2.92mm Apex Sponsor earnout shares (composed of a single tranche with target price $15.00). This assumes zero redemptions by Apex public and maximum cash consideration awarded to AvePoint common shareholders (up to cash amount available to common shareholders), outside of
Named Executives, as specified in the Business Combination Agreement. 2) Existing cash on balance sheet as of November 20, 2020. 3) Reflects net cash amount of $257mm: $261mm of secondary proceeds to existing AvePoint shareholders less PIPE fees of $4mm. 4) Reflects preliminary
estimates.
20Attractive Valuation Multiple vs. Peers
2021 & 2022 Firm Value / Revenue
22.9x
21.2x
19.9x
19.0x
18.1x
16.2x 16.8x
14.3x 13.8x 13.6x
11.3x 11.8x
11.1x
9.9x
9.0x
6.8x
AVEP AYX DT JAMF AVLR FIVN RNG HUBS
2020E-2022E 32% 22% 23% 20% 23% 18% 23% 23%
Revenue CAGR
2020E EBIT
14% 11% 27% 11% (2%) 14% 10% 7%
Margin
Implied 2021E
Growth Adj.1 0.28x 0.65x 0.60x 0.60x 0.98x 1.19x 0.86x 0.74x
Revenue Multiple
Growth Infrastructure Growth SaaS
Source: AvePoint Management, Company filings, and FactSet median broker consensus estimates as of November 20, 2020. 1) Multiples are growth adjusted by CY2020E-CY2022E revenue CAGR.
21AvePoint is in an Elite Class
Total NYSE / NASDAQ Listed Software Companies
212
137 ~$150mm+
32 >25%
5 >10%
Relevant Companies
+
Source: AvePoint Management and FactSet median broker consensus estimates as of October 19, 2020.
22Appendix
23Q3 2020 Flash Performance Update
($ in millions)
Three Months Ended September 30
Q3 2019 Q3 20201
ARR2 $ 85.1 $ 106.8 - $ 108.3
Total Revenue $ 30.1 $ 38.0 - $ 39.8
EBIT (Non-GAAP)3 $ (0.7) $ 7.5 - $ 8.6
% EBIT (Non – GAAP) of Revenue (2.3) % 19.7 % - 21.6 %
¹Preliminary estimates of unaudited selected financial information for the three months ended September 30, 2020, which may differ from actual results. You should not place undue reliance upon these preliminary financial results. 2Includes subscription and maintenance revenues. 3The
Company is not readily able to provide a reconciliation of GAAP Operating Income to Non-GAAP EBIT; actual results may vary and those results may be material. GAAP to Non-GAAP reconciliation will be provided once results are finalized. Non-GAAP EBIT excludes stock-based
compensation, severance costs, ISO certification costs, and professional IPO fees.
24GAAP to Non-GAAP Reconciliation
(US$ in millions) YTD 2019 YTD 2020 2019A 2020E 2021E 2022E
GAAP Operating Income (Loss) ($8.7) $2.9 ($18.0) $18.7 $6.5 $15.5
% Margin (17%) 4% (15%) 13% 3% 6%
(+) Stock-Based Compensation $1.3 $1.3 $13.9 $2.1 $1.5 $1.5
% of Revenue 3% 2% 12% 1% 1% 1%
(+) Other Adjustments 1 $0.6 ($0.2) $0.3 ($0.2) -- --
% of Revenue 1% (0%) 0% (0%) -- --
EBIT (Non-GAAP) ($6.8) $4.0 ($3.8) $20.5 $8.0 $17.0
% of Revenue (13%) 6% (3%) 14% 4% 7%
Source: AvePoint Management.
1) Includes legal expenses, government grants, ASC 606 consulting fees, and other.
25You can also read