We are enhancing and accelerating our strategy for growth to drive results and value more quickly and doing so in a way that is reinforcing all ...
←
→
Page content transcription
If your browser does not render page correctly, please read the page content below

INVESTOR COMMUNICATION
JULY 30, 2018
                         “We are enhancing and accelerating our
                         strategy for growth to drive results and value
                         more quickly and doing so in a way that is
                         reinforcing all that we stand for as a brand and
                         company.”
                         - HARLEY-DAVIDSON, INC. APRIL 24, 2018

                                                                            1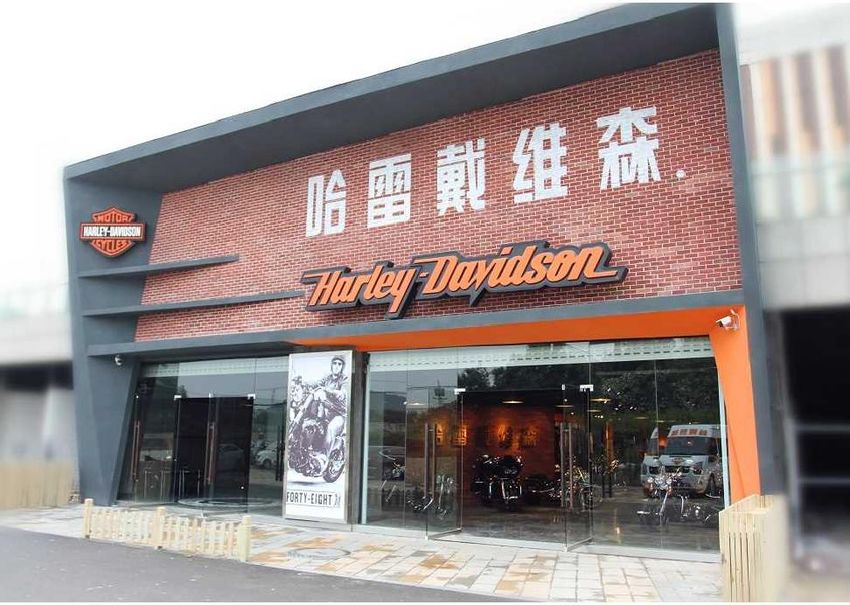
Forward-Looking Statements
This presentation relates to the company’s “More Roads to Harley-Davidson” plan. The company intends that all statements in this presentation concerning the
company’s plan, including without limitation, its plans, objectives and expectations, future financial and other results it seeks to attain, the new product introductions it
contemplates, and its views of market opportunities and benefits and other matters resulting from the company’s strategy in this presentation are "forward-looking
statements" intended to qualify for the safe harbor from liability established by the Private Securities Litigation Reform Act of 1995. These forward-looking
statements are subject to certain risks and uncertainties that are likely to cause actual results to differ materially, unfavorably or favorably, from those anticipated as
of the date of this presentation. Certain of such risks and uncertainties are described below, and others are listed in the company’s July 24, 2018 earnings press
release. Shareholders, potential investors, and other readers should consider these factors in evaluating, and not place undue reliance on, the forward-looking
statements. The forward-looking statements in this presentation are made as of the date of this presentation, and the company disclaims any obligation to update
such forward-looking statements to reflect subsequent events or circumstances.

The company's ability to meet the objectives, outlooks, targets, and goals noted in this presentation depends upon, among other factors, the company’s ability to: (i)
execute its business plans and strategies, including the elements of its More Roads to Harley-Davidson plan, and strengthen its existing business while enabling
growth, (ii) realize expectations concerning market demand for electric models, which may depend in part on the building of necessary infrastructure, (iii) develop
and introduce products on a timely basis that the market accepts, that enable the company to generate desired sales levels and that provide the desired financial
returns, (iv) successfully carry out its global manufacturing and assembly operations, (v) negotiate and successfully implement a strategic alliance relationship with a
local partner in Asia, (vi) manage risks that arise through expanding international manufacturing, operations and sales, (vii) effectively implement changes relating to
its dealers and distribution methods, (viii) accurately analyze, predict and react to changing market conditions, (ix) perform in a manner that enables the company to
benefit from market opportunities while competing against existing and new competitors, and (x) reduce other costs to offset costs of the More Roads to Harley-
Davidson plan and redirect capital without adversely affecting its existing business.

In particular:
• The statements in this presentation relating to the company’s More Roads to Harley-Davidson plan generally represent only the company’s goals,
   aims and objectives regarding the plan and potential results from the plan.

•   While many statements use language that might imply a level of certainty about the likelihood that the company will attain these goals, aims and
    objectives, it is possible that the company will not attain them in the timeframe noted or at all.

•   By their nature, the risk and uncertainty associated with these goals, aims, and objectives are greater than that associated with near-term guidance,
    and should not be construed as guidance.

Therefore, investors should construe these statements regarding the More Roads to Harley-Davidson plan only as goals, aims and objectives rather than
promises of future performance or absolute statements.

Sources of information:
This presentation includes a significant amount of estimates, information and data about markets, industry information and similar subjects. Please see slide 45 for
important information regarding these estimates, information and data. Among other things, the estimates, information or data that we present may not
be reliable, and investors should not place undue reliance on them.

                                                                                                                                                                          2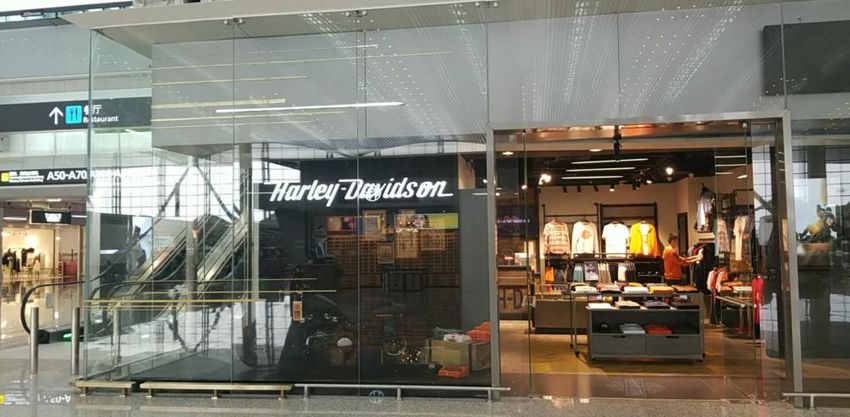
By 2022…
Our More Roads to Harley-Davidson plan will strengthen our existing business and
enable sustainable growth. Growth opportunities will be funded internally while
maintaining our current investment/return profile and capital allocation through 2022

Harley-Davidson will build the next generation of riders by delivering:

NEW PRODUCTS – keep current riders engaged and inspire new riders by extending heavyweight leadership and unlocking
new markets and segments

BROADER ACCESS – meet customers where they are and how they want to engage with a multi-channel retail experience

STRONGER DEALERS – drive a performance framework to improve dealer financial strength and the Harley-Davidson
customer experience

INCREMENTAL REVENUE AND EARNINGS – generate accelerated growth and expanded operating margins for the
Motorcycles and Related Product segment in 2022 compared to 2017:

         $1.0B to                           $200M to                               0.75pts.
         $1.5B                              $250M                                  to 1.25pts.
       revenue                              operating profit                         operating margin %

                                                                                                                      3
WHAT
  More Roads to Harley-Davidson – Harley-Davidson’s strategic growth plan
  through 2022
  ▪ Leverage core business, the brand and our strengths more fully; strengthen the company, brand and sport
  ▪ Invest in new growth opportunities
  ▪ Advance our long-term objectives and build the next generation of Harley-Davidson riders globally

why
  To drive results and value more quickly
  ▪ Given:
      –   - Significant international potential
      –   - Strong opportunity in certain global high-growth product spaces
      –   - Prolonged softness in the U.S. industry
      –   - Demographic trends in the U.S. that will pressure participation rates

how
  In a way that reinforces all we stand for as a brand & company
  ▪ Grounded in our 5 long-term objectives to build the next generation of H-D riders globally
  ▪ Better leverage our substantial capabilities and competitive advantages
  ▪ Invest in opportunities that deliver cash flow, profitability, top quartile ROIC and value to our shareholders
                                                                                                                     4
5

Our 2027
Objectives

             2017                               2018-2022                                  2023-2027
             SHIFT                              accelerate                                 MOMENTUM
     - Rider vs. motorcycle       - Amplify our efforts to build new riders and retain   - Ridership growth momentum
     - Embrace used motorcycles     existing riders                                      - Accelerated revenue growth and
     - Gain insights              - Leverage our competitive advantages in new             operating margin expansion
                                    areas                                                - Robust international growth
                                  - Transform the company by expanding our               - U.S. growth behind reinvigorated
                                    product leadership and changing how we operate         industry
                                    in pursuit of our objectives                         - Objectives met by 2027
                                  - Invest to grow
                                  - Realize revenue growth and operating margin
                                    expansion                                                                                 5
▪   Stabilize and grow the business
▪   Invest significantly in product development and marketing focused on building riders
▪   Serve today’s riders and build new riders
▪   Increase profitability, maximize cash generation

▪   Invest to reinvigorate the U.S. business and accelerate the pace of international growth
▪   Accelerate ridership growth and keep existing riders engaged
▪   Ignite sustainable growth through investments in:

                                                                                               6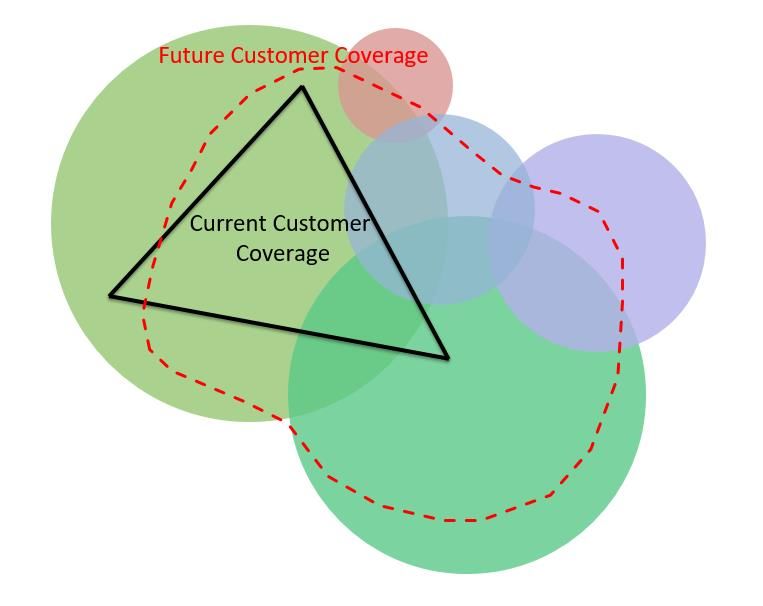
7 7
H-D’s competitive fire power:

▪   World’s most iconic motorcycle brand able to command a price premium globally
▪   Dedicated retail network capable of delivering a great customer experience to
    existing and new customers
▪   Exceptional design capabilities and customer enthusiasm to expand beyond
    traditional product spaces
▪   Best-in-class motorcycle financial services
▪   Strong manufacturing capabilities including a global manufacturing footprint
▪   Strong cash flow generation and returns to shareholders

                                                                                    8 8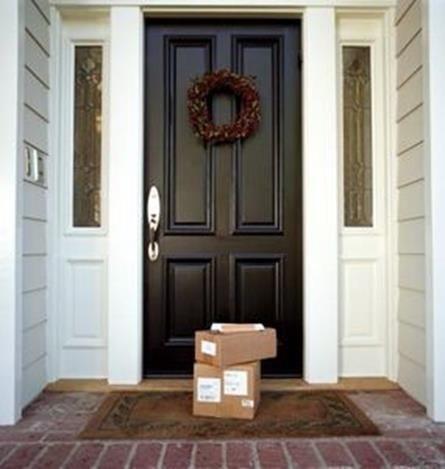
U.S. Industry participation is flat. H-D ridership is growing, but growth is slowing

                                   PARTICIPATION                                                                                                  OWNERSHIP
               % of 18+ Year Old U.S. Population Who Own at Least                                                         U.S. Motorcycle Owners – Number of Unique People
                            One On-Highway Motorcycle                                                                                 with Registered Motorcycles
                   (All cc+, On-Road/Dual Only, Unique People)                                                                       (All cc+, On-Road/Dual Only)

Since the recession:                                                                                        •      H-D ownership has grown every year
•   H-D participation up and at all-time highs; relatively flat                                             •      H-D ownership is currently more than 2X the nearest
    last 4 years                                                                                                   competitor
•   Competitive participation down                                                                          •      Ownership among 4 largest competitors has declined
•   Industry participation down since 2008                                                                         every year since 2008
Data and analysis based on annual volumes for US motorcycles in operation (all CC’s, on highway and dual   Data and analysis based on annual volumes for US motorcycles in operation (all CC’s, on highway and
motorcycles), and for owners that are 18+ years old. Snapshot based on data as Dec. 31 of the year         dual motorcycles), and for owners that are 18+ years old. Snapshot based on data as Dec. 31 of the year
shown, according to IHS Markit. Population Data Source: US Census Bureau and IHS Markit                    shown, according to IHS Markit.                                                                    9 9
Macroeconomic Advisors.
Rider expectations are changing                               The global pace of change is
▪ Consumers are fully embracing online and                    accelerating, and competition is
  expecting an all-access retail experience;                  increasingly fierce
  ~70% of consumers shop online regularly                     ▪   Strong competitive pressure for consumer time
                                                                  and spend from outside of Powersports
▪ Frontline customer interaction evolving -
  mobile, digital and direct                                  ▪ New mobility models emerging
▪ Shift to constant connectivity - a connected                ▪   The pace of investments and innovation in the
  lifestyle                                                       motorcycle industry is increasing

 Robust international growth                                  Urbanization and sustainability
 opportunities exist                                          trends are creating opportunity for
                                                              new technology and products
 ▪   Consumer spending on discretionary, premium
     products is reaching critical mass in China, India and   ▪   Urban population of the world has grown rapidly
     Southeast Asia                                               from 751 million in 1950 to 4.2 billion in 2018;
                                                                  +2.5 billion more expected by 2050
 ▪   China motorcycle volumes expected to grow rapidly;
     India’s 250-500cc motorcycle segment expected to         ▪   EVs now considered by 30-40% of U.S. and
     grow ~25%/yr. through 2021                                   German car buyers; increasingly favored in
                                                                  government policy
 ▪   European motorcycle sales are growing; Adventure
     Touring segment is large and growing
                                                                                                                     10
                                                                                                                      10
Tailwinds in Emerging & Urban Tailwinds in Non-Core Segments
Motorcycle volume growth by segment
U.S. Grand American Touring -2%-2
Avg. global
Avg.
1
population 1%
Global GDP 33% U.S. Adventure Touring/Traditional 7%
Urban Emerging 5%
2
Europe Adventure Touring/Traditional
population 2% markets GDP 55%
Asia small 150-400cc 6%
Tailwinds in Electric Tailwinds in E-Commerce
Total retail revenue $ growth
Combustion Cars* 2% U.S. Brick & Mortar
2%
EV Car* units 16 % U.S. Online Retail 16
12%
*Used cars as an indicator for motorcycles
Forecasted 2017-2022 CAGR: H-D’s current emphasis “More Roads” plan focus
11
11Keep current riders engaged and Meet customers where they Drive a performance framework
inspire new riders by extending are and how they want to to improve dealer financial
heavyweight leadership and unlocking engage with a multi- strength and the Harley-
new markets and segments channel retail experience Davidson customer experience
• Innovate Touring and Cruiser • Integrated retail experience • Good-to-great dealers
products
• New retail formats • Expand international dealer
• Launch middleweight platform network
• Grow China
• Lead the electrification of
motorcycles
• Launch small displacement
motorcycle for emerging
markets
12• Innovate Touring and Cruiser products
• Launch middleweight platform
• Lead the electrification of motorcycles
• Launch small displacement motorcycles for emerging markets
13Motorcycle Product Opportunity Map
through the eyes of the customer
14▪ Extend leadership in Touring and Cruisers in the U.S.
and established markets
▪ Leverage technology to create an unmatched
aspirational riding experience
• Rider confidence & safety
• Performance
• Connectivity
• Infotainment advancement
15Segment / Sales Volume CAGR
Displacement 2017 2017-20 Market trends
Europe* Adventure Touring 163K ▪ Europe has strong appreciation of
Streetfighter 75K Adventure Touring and Streetfighter
8%
segments from young riders, women
Standard 35K and new riders
(601cc+)
▪ A growing middle class and product
India* 250-500cc 700K 25% introductions by domestic
manufacturers providing stimulus in
>500cc 8.5K 18-28% India
▪ Competitors have entered into
various alliances and partnerships to
* Industry information accelerate the pace of market entry
16Adventure Touring Custom Streetfighter / Standard
Capability, functionality, durability Powerful, muscular, aggressive Speed, performance, thrill
Commanding view from taller seat height Strength Naked or partial bodywork
Versatility Momentum
Pan America™ Name: TBD Name: TBD
2020* 2021* 2020*
2 models 5 models 9 models
975-1250cc 500-1250cc 500-1250cc
2020-2021* 2021-2022* 2020-2022*
*Planned launch dates
NOTE: Prototype models shown. Production model features may vary. Not yet available for sale. All future models shown may not be available in all markets.
17North America & Europe* Asia*
Sales Gross Sales Gross
Volume Margin CAGR Volume Margin CAGR
Segment
2017 Est. Avg. 2017-20 2017 Est. Avg. 2017-20
Market trends
▪ Small, rapidly growing market;
HighGlobal energy giants
are moving to acquire
Chinese regulators setting ▪ New residential homes and
annual target of 2M electric commercial construction building EV
EV charging network
vehicles per year by 2020 charging infrastructure
companies
Global auto OEMs Electric motorcycles are
announce they are expected to achieve cost ▪ 30-40% of U.S. and German
slashing R&D for parity with internal customers now consider an
combustion engines to combustion engine MCs EV in new car purchases
shift to EVs 2020-2025 as early as 2030
▪ Announced bans on combustion engine new car sales: Germany and India by 2030;
UK, France, Taiwan by 2040
43%
Always trying new technology
and gadgets before others 45%
Have interest in owning
32%
a Harley-Davidson
Stay ahead of trends motorcycle
19
19Accessible power &
LiveWire™ price point Lightweight urban
2 models
2019* 2021-2022* 2021-2022*
Bring electric products to market in new ways
▪ Launch with impact to inspire new riders ahead of product availability and seed demand
▪ Meet customers where they are and how they want to engage
▪ Digital information sharing
▪ Enhance traditional channels with new urban points
*Planned launch dates
NOTE: LiveWire prototype and art depicting future product concepts shown. Production model features may vary. Not yet available for sale. All
future models shown may not be available in all markets.
20We intend to enter into a strategic alliance in
Asia to:
▪ Launch a 250-500cc motorcycle within 2
years in India, and into other emerging
markets in Asia over time
▪ Expedite market entry and increase brand
access and volume
▪ Product/displacement bridge to our
larger motorcycles
▪ Leverage world-class partner’s
manufacturing scale and retail
footprint
▪ Enable accessible price point for
premium small displacement market
entry
21• Integrated retail experience
• New retail formats
• Grow China
22▪ 99% of consumer retail growth in Retail revenue; $T
the next 5 yrs. will come from
$4.2
online or digitally influenced sales Retail growth 2016-2022
$3.4
2016 2022
▪ Forecasted 57% of offline sales will
be digitally impacted by 2022
>2x 1/4
of these consumers use their
growth in number of people who mobile devices while shopping
Mobile purchase and research through In-store online in-store, mainly to check the
gateway their smartphone or tablets research
store’s website or competitor’s
website
23Elevate H-D.com Create strategic alliance with global
to flagship shopping and purchasing e-commerce providers. Expand access to H-D
experience, reinforcing the H-D apparel directly to a broader set of mainstream
experience consumers; accelerate apparel sales
Improved
Site
customer
redesign
support
Integrate with
dealership
24Expand international apparel distribution
▪ Expand G-III alliance model for on-line/offline
shopping experience throughout Asia and into
other regions
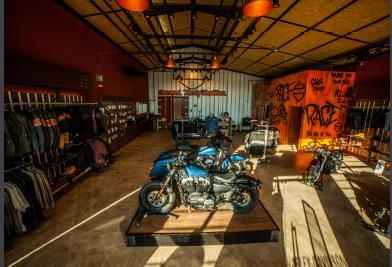
Launch new urban and flexible
format storefronts
▪ Introduce new storefront concepts
globally
▪ Focus on new products and customer
needs
▪ Examples include urban locations and
pop-up retail
25▪ Leverage expanded product
portfolio
▪ Leverage Thailand mfg. plant
▪ Establish China Distribution
Center
▪ Dealer expansion and
improvement
▪ Increase marketing investment
26• Good-to-great dealers
• Expand international dealer network
27H-D dealer network performance (U.S. data)
Key Areas of Variation
• Market share & operating margin
• Customer conversion to sales
− Marketing leads
− Test rides
− Riding Academy graduates
• New-to-sport buyers as % of total
We have opportunity to:
▪ Redefine what “performance” means for the company and dealer network
▪ Incent dealers to grow and improve the customer experience
▪ Improve dealer financial strength and profitability (already best-in-class)
▪ Train dealer staff and provide performance consulting
28▪ Drive a performance framework to improve dealer financial strength and
the Harley-Davidson customer experience
▪ Network management
▪ Dealer prospecting and succession planning
▪ Dealer incentives
▪ Performance oriented incentives
▪ Facility and methods modernization incentives
▪ Bar & Shield program optimization
▪ Dealer success
▪ General manager & sales training
▪ Provide performance consulting
▪ Advanced analytics – lead management support
▪ Deliver an integrated in-store and online experience
29• Plan to open 25-35 new full-line dealer points per year based on market
potential through 2022
• Primarily in emerging markets
3031
OUR 2027
 OBJECTIVES

                                                                                       INVESTMENT FOCUS
        Cash Flow                                          Investment                                                                 Returns                                        Shareholder Distribution

Leverage strong                     Invest in strong return projects to                                            Deliver:                                                    Return all excess cash to shareholders
business model and                  drive organic growth (revenue &                                                    • HDMC ROIC top                                                                                     $1,526*
brand to generate                   margin)                                                                              quartile S&P 500
industry leading
margins and cash flow                    • New products                                                                • HDFS ROE Best-in-                                                   $1.24
                                                                                                                                                                                                     $1.40 $1.46    $604
                                                                                                                                                                                    $1.10                                       $459 $456
                                         • Broader access                                                                class1
                                                                                                                                                                                     2014 2015 2016 2017             2014 2015 2016 2017
                                         • Stronger dealers
                                                                                                                                                                                             ▪ Dividends           ▪ Share repurchase
                                         • Operational excellence                                                                                                                              per share                ($ Millions)

                                                                                                                                                                                      *Funded by $750 million of HDI debt issuance

                (1)   Peer Group includes the following 7 companies with publicly available financial information: American Honda Finance Corporation, Caterpillar Financial Services Corporation,
                      John Deere Capital Corporation, Ford Motor Credit Company LLC, General Motors Financial Company, Inc., Paccar Financial Corp and Toyota Motor Credit Corporation.
                                                                                                                                                                                                                                            32
H-D’s Growth Objectives*
2017 vs. 2022
Revenue +$1 to $1.5 billion
5 Yr. CAGR 3.8 to 5.5%
Operating
income +$200 to $250 million
5 Yr. CAGR 5.9 to 7.1%
Operating
margin % +0.75 to 1.25 points
*Represents the Motorcycles and Related Products segment. Growth objectives represent incremental business performance to our 2017
actual results.
33Cumulative investments expected through 2022
Operating Investment Capital Investment*
$450-$550 million $225-$275 million
Retail
Electric
Retail Electric
Middleweight / Small Middleweight / Small
Displacement Displacement
*Expect total H-D capital spending to range between $200
million and $250 million per year in 2019 through 2022 34Funding Principles Funding Strategy
• Stabilize and strengthen existing • Improve cost competitiveness
business – Sourcing
– Optimize existing customer base – Design-to-value
– Invest in growing new riders
• Achieve overhead efficiencies
• Enhance our premium brand – Reduce costs through prioritization,
– Maintain or increase current investment automation, continuous improvement and
levels in customer-facing marketing and closing gaps to best-in-class benchmarks
product development – Reallocate investment and resources to
growth opportunities
• Drive organizational agility
– Faster decisions • Disciplined capital allocation
– Increased speed to market – Reallocation of investment capital
– “Test and roll” market initiatives – Improved working capital
35Income
Investment
2018 2019 2020 2021 2022
Expect $450-$550 million cumulative by 2022
Intense cost focus
2018 2019 2020 2021 2022
36+$200-$250M
in 2022
2018 2019 2020 2021 2022
37$1.46
$1.40 $1,526**
$1.24
$1.10
$0.84
$0.62
$604
$0.48
$456 $459 $456
$218 $300
2011 2012 2013 2014 2015 2016 2017
2011 2012 2013 2014 2015 2016 2017
* Funded by $750 million HDI debt issuance
38
3839
3-Yr. Avg. Free Cash Flow Conversion(1)(2) 3-Yr. Avg. Free Cash Flow Margin(1)(2)
3-Yr. Avg. ROIC and ROE(1)(3) 3-Yr. Avg. Cumulative Capital Return/Market Capitalization(1)(4)
Funded by
$750 million
HDI debt
27% issuance
(1)Three year average is based on 2015-2017 calendar year information using the average for key companies in respective industries or segments . Source: Company filings, Bloomberg (benchmark companies’ income adjusted as appropriate for
comparability). (2) Free Cash Flow (FCF) is defined as net cash provided by operating activities less capital expenditures. Free Cash Flow Margin defined FCF divided by revenue. Free Cash Flow Conversion defined as FCF divided by net income. Free
Cash Flow is a non-GAAP measure. See slides later in this presentation for information on Non-GAAP measures. (3)Return on invested capital (ROIC) is defined as earnings before interest and taxes (EBIT) after tax divided by (debt plus book value of
equity). EBIT after tax for HDMC is equivalent to HDMC operating income after tax which is a non-GAAP measure. Return on equity (ROE) is defined as FinCo operating income after tax divided by book value of equity. FinCo operating income after tax is
equivalent to HDFS operating income after tax which is a non-GAAP measure. Calculations for all companies assume a tax rate of 35% for comparability. See slides later in this presentation for information on Non-GAAP measures. (4) Calculated by
adding 2015, 2016 and 2017 dividends plus repurchase, dividing that sum individually by 2015, 2016 and 2017 year-end market capitalizations resulting in three separate quotients, and then averaging the three quotients.
393940
41

     4141
42
42
4243 43
BUILDING THE NEXT GENERATION OF HARLEY-DAVIDSON RIDERS GLOBALLY
OUR 2027
OBJECTIVES

      Build 2 Million New                    Grow International          Launch 100 New                      Deliver Superior                    Grow our Business
  1   Harley-Davidson                 2      Business to 50% of     3    High Impact Harley-          4      Return on Invested           5      without Growing our
      Riders in the U.S.                     Annual Volume               Davidson Motorcycles                Capital for HDMC                    Environmental Impact

                                                         MORE ROADS TO HARLEY-DAVIDSON

                                    New Products                                  Broader Access                                     Stronger Dealers

                            Keep current riders engaged and               Meet customers where they are and                  Drive a performance framework to
ACCELERATING                                                              how they want to engage with a multi-              improve dealer financial strength and
                            inspire new riders by extending
OUR STRATEGY                heavyweight leadership and                    channel retail experience                          the Harley-Davidson customer
                            unlocking new markets and                                                                        experience
                                                                          •   Integrated retail experience
                            segments
                                                                          •   New retail formats                             •    Good-to-Great dealers
                            •   Innovate Touring and Cruiser
                                products                                  •   Grow China                                     •    Expand international dealer
                                                                                                                                  network
                            •   Launch middleweight platform
                            •   Lead in electrification of
                                motorcycles
                            •   Launch small displacement
                                motorcycle for emerging markets

NAIL THE
FUNDAMENTALS                          Serve the                   Maintain Premium                 Improve Organizational                       Drive Cost
TO COMPETE                            Customer                         Brand                           Effectiveness                          Competitiveness
AND WIN

                                 WE FULFILL DREAMS OF PERSONAL FREEDOM                                                                                                  44
Sources of Information
This presentation includes a significant amount of estimates, information and data about markets, industry information and similar subjects. The estimates,
information or data reflects the company’s beliefs based on estimates, information and data available to it. But, we have not independently verified the reliability,
accuracy, or completeness of the estimates, information or data that form the basis for the company’s beliefs. The estimates, information or data that we present
involve a number of assumptions and limitations and may not be reliable, and investors should not place undue reliance on them. Neither the company nor any
other person makes any representation or warranty as to the accuracy or completeness of such estimates, information or data. In particular, projections,
assumptions and estimates concerning the markets in which the company operates, or intends to operate, are necessarily subject to a high degree of uncertainty
and risk.
The IHS Markit reports, data and information referenced herein (the “IHS Markit Materials”) are the copyrighted property of IHS Markit Ltd. and its subsidiaries
(“IHS Markit”) and represent data, research, opinions or viewpoints published by IHS Markit, and are not representations of fact. The IHS Markit Materials speak
as of the original publication date thereof and not as of the date of this document. The information and opinions expressed in the IHS Markit Materials are subject
to change without notice and IHS Markit has no duty or responsibility to update the IHS Markit Materials. Moreover, while the IHS Markit Materials reproduced
herein are from sources considered reliable, the accuracy and completeness thereof are not warranted, nor are the opinions and analyses which are based upon
it. IHS Markit and R.L. Polk & Co. are trademarks of IHS Markit. Other trademarks appearing in the IHS Markit Materials are the property of IHS Markit or their
respective owners.
45NON-GAAP MEASURES
This presentation includes financial measures that have not been calculated in accordance with U.S. generally accepted accounting principles
(GAAP), and are therefore referred to as non-GAAP financial measures. The non-GAAP measures listed below are intended to be considered
by users as supplemental information to their equivalent GAAP measures, to aid investors in better understanding the company’s financial
results. The company believes that these non-GAAP measures provide useful perspective on underlying business results and trends, and a
means to assess period-over-period results. These non-GAAP measures should not be considered as a substitute for, or superior to, measures
of financial performance prepared in accordance with GAAP. These non-GAAP measures may not be the same as similarly titled measures
used by other companies due to possible differences in method and in items or events being adjusted.
The following non-GAAP measures are used as inputs into performance measures that allow for a comparison to the performance of industry
competitors:
• HDI free cash flow
• HDMC operating income after tax
• HDFS operating income after tax
Refer to the following slide non-GAAP reconciliations.
.
46RECONCILIATION OF GAAP TO NON-GAAP AMOUNTS
This presentation contains performance measures calculated using non-GAAP amounts as inputs. These performance
measures include: "3-yr. Avg. Free Cash Flow Conversion", "3-yr. Avg. Free Cash Flow Margin“, “3-Yr. Avg. ROIC and
ROE”. Reconciliations of non-GAAP amounts to reported GAAP amounts are included below.
Twelve-months Twelve-months Twelve-months
Ended Ended Ended
12/31/2017 12/31/2016 12/31/2015
HDI Free cash flow (FCF)
Net cash provided by operating activities (GAAP) $ 1,005,061 $ 1,174,339 $ 1,100,118
Less: Capital expenditures (GAAP) 206,294 256,263 259,974
FCF (Non-GAAP) $ 798,767 $ 918,076 $ 840,144
HDMC operating income after tax
HDMC operating income (GAAP) $ 624,326 $ 781,625 $ 884,041
Less: Income taxes(1) 218,514 273,569 309,414
HDMC Operating income after tax (Non-GAAP) $ 405,812 $ 508,056 $ 574,627
HDFS operating income after tax
HDFS operating income (GAAP) $ 267,139 $ 267,206 $ 271,654
Less: Income taxes(1) 93,499 93,522 95,079
HDFS operating income after tax (Non-GAAP) $ 173,640 $ 173,684 $ 176,575
(1)
Income taxes calculated using a 35% rate, to be consistent with assumptions used to determine competitor measures.
47You can also read