Bank of America 2021 Global Agricultural and Materials Conference - Element Solutions Overview
←
→
Page content transcription
If your browser does not render page correctly, please read the page content below
Bank of America 2021 Global
  Agricultural and Materials
                 Conference
         Element Solutions Overview

                               March
                               1
                               2021
Legal Notices

SAFE HARBOR
Please note that in this presentation, we may discuss events or results that have not yet occurred or been realized, commonly referred to as forward-looking statements. The Private Securities Litigation Reform
Act of 1995 provides a safe harbor for forward-looking statements made by or on behalf of the Company. Such discussion and statements will often contain words such as “expect,” “anticipate,” “project,” “will,”
“should,” “believe,” “intend,” “plan,” “assume,” “estimate,” “predict,” “seek,” “continue,” “outlook,” “may,” “might,” “aim,” “can have,” “likely,” “potential,” “target,” “hope,” “goal,” “priority,” “guidance” or “confident” and
variations of such words and similar expressions, and relate in this presentation, without limitation, to “New Economy” growth drivers, including 5G mobile technologies, vehicle electrification, semiconductor
applications, circular economy and green chemistry; defensible margins and high returns on capital; cost management and long-term organic growth management; cash flow generation and allocation; full year
2021 financial guidance related to adjusted EBITDA, adjusted EPS and free cash flow; profitable growth from 5G adoption; electronic content growth in Automotive; meeting sustainability challenges and
environmental compliance standards; steady margins and growing free cash flow; outperformance relative to end-markets; capital allocation; return of capital to shareholders; and long-term financial objectives,
including doubling adjusted EPS to $1.36 from 2018 to 2023.

These projections and statements reflect management's estimates, assumptions and expectations with respect to future events and financial performance and are believed to be reasonable, though are inherently
uncertain and difficult to predict. Such projections and statements are based on the assessment of information available to management as of the current date, and management does not undertake any
obligations to provide any further updates. Actual results could differ materially from those expressed or implied in the forward-looking statements if one or more of the underlying estimates, assumptions or
expectations prove to be inaccurate or are unrealized. Important factors that could cause actual results to differ materially from those suggested by these forward-looking statements include, but are not limited to,
the duration of the pandemic; the efficacity, availability and/or public acceptance of vaccines targeting COVID-19; the impact of variants of COVID-19 that may affect its spread or virulence or the effectiveness of
vaccines on the virus; the impact of actions taken or that might be taken by governments, businesses or individuals to contain or reduce its repercussions and mitigate its economic implications; evolving
macroeconomic factors, including general economic uncertainty, unemployment rates, and recessionary pressures; decreased consumer spending levels; reduction or changes in customer demand for the
Company's products and services; the Company's ability to manufacture, sell and provide its products and services, including as a result of travel restrictions, closed borders, operating restrictions imposed on its
facilities or reduced ability of its employees to continue to work efficiently; increased operating costs (whether as a results of changes to the Company's supply chain or increases in employee costs or otherwise);
collectability of customer accounts; additional and prolonged devaluation of other countries' currencies relative to the U.S. dollar; the general impact of the pandemic on the Company's customers, employees,
suppliers, vendors and other stakeholders; the Company's ability to realize the expected benefits of its cost containment and cost savings measures; business and management strategies; outstanding debt and
debt leverage ratio; shares repurchases; expected returns to stockholders; and the impact of acquisitions, divestitures, restructurings, refinancings, impairments and other unusual items, including the Company's
ability to raise and/or retire new debt and/or equity and to integrate and obtain the anticipated benefits, results and synergies from these items or other related strategic initiatives. Additional information
concerning these and other factors that could cause actual results to vary is, or will be, included in the periodic and other reports of Element Solutions filed with the Securities and Exchange Commission. Element
Solutions undertakes no obligation to update any forward-looking statements, whether as a result of new information, future events or otherwise.

Certain product information, competitive position data, peers’ data and market trends contained in this presentation have been prepared internally and have not been verified by any third party. Use of different
methods for preparing, calculating or presenting such information may lead to different results and such differences may be material. In addition, certain industry and market data described in this presentation was
obtained from industry and general publications and research, surveys and studies conducted by third parties. While the Company believes this information is reliable and appropriate, such information has not
been verified by any independent source. You are cautioned not to place undue reliance on this information or data.

NON-GAAP FINANCIAL MEASURES
To supplement the financial measures prepared in accordance with generally accepted accounting principles in the United States (“GAAP”), the Company uses the following non-GAAP financial measures:
EBITDA, adjusted EBITDA, adjusted EBITDA margin, adjusted earnings per share (EPS), adjusted common shares outstanding, free cash flow, free cash flow on an adjusted basis, free cash flow conversion, full
year 2021 financial guidance related to adjusted EBITDA, adjusted EPS and free cash flow, net debt to adjusted EBITDA ratio and organic net sales growth. The Company also evaluates and presents its results
of operations on a constant currency basis. The definitions and reconciliations of these non-GAAP measures to the most directly comparable financial measures calculated and presented in accordance with
GAAP can be found in the footnotes and appendix of this presentation.

Management internally reviews each of these non-GAAP measures to evaluate performance on a comparative period-to-period basis in terms of absolute performance, trends and expected future performance
with respect to the Company’s businesses and believes that these non-GAAP measures provide investors with an additional perspective on trends and underlying operating results on a period-to-period
comparable basis. The Company also believes that investors find this information helpful in understanding the ongoing performance of its operations separate from items that may have a disproportionate positive
or negative impact on its financial results in any particular period. These non-GAAP financial measures, however, have limitations as analytical tools, and should not be considered in isolation from, a substitute for,
or superior to, the related financial information that the Company reports in accordance with GAAP. Investors are encouraged to review the reconciliations of these non-GAAP financial measures to their most
comparable GAAP financial measures included herein, and not to rely on any single financial measure to evaluate the Company’s businesses.

                                                                                                                                                                                                                                 2
Element Solutions Overview
    Chemical Technology Enabling Performance & Innovation

$ 1,854M                              2020
                                      Net Sales                      ~ 4,400                          Employees
                                                                                                                                                          2020 Segment Net Sales
                                                                                                                                                         ■ Electronics                63%
                                                                                                                                                                                                         2020 Regional Net Sales

                                                                                                                                                                                                         ■ Americas          30%
                                                                                                                                                           Industrial &
                                                                                                                                                         ■ Specialty                  37%                ■ EMEA              27%

$ 423M                                2020
                                      Adj. EBITDA*                         > 50                       Countries                                                                                          ■ Asia              43%

                                                                                                                                            Hydraulic Valve and                                        Flexographic
                                                                                                                                          Pressure Control Fluids                                     Printing Plates
                                                                                 Semiconductor
               Circuit Formation
                                                                                   Packaging
                  Chemistries
                                                                                   Materials

                                                                                                                                           Films, Water
                                                                                                                                            Treatment                                      Protective and Decorative
                                                                                                                                            and Other                                         Plating Chemistries
        Protective and                                                          Electronic
       Functional Plating                                                       Assembly
         Chemistries                                                            Materials

                                                 Electronics                                                                                                                  Industrial & Specialty

*   Indicates financial measures which are not prepared in accordance with GAAP. For definitions, discussions of adjustments and reconciliations, please refer to the appendix of this presentation

                                                                                                                                                                                                                         3
Full Year 2020 Highlights

                                                                                          ✔                                                                                                                            ✔
                             Operational Excellence
                                                                                                                 &                                  Prudent Capital Allocation

           In the context of a significant COVID-19 impact…

                           9%                                           2%                                                                       Strategic acquisition of DMP launching new
                                                                                                                                                    sustainability platform for wastewater
                                                                                                                                                       treatment and recycling systems
                          Growth in                            Constant currency
                          Adj. EPS*                           adj. EBITDA* growth

                                                                                                                                                          Five Cent
                 $249M                                                  5%                                                                    per share quarterly dividend initiated in Q4 2020

                     Free cash flow*                             Free cash flow*
                                                              growth year-on-year1                                                                                    $56M
                                                                                                                                                              Of share repurchases
                                                                                                                                                      at an average price of $9.74 per share
                    Expanded adjusted EBITDA* margin

                    Committed to preserve employment

          Maintained R&D and Capex investment levels
                                                                                                                                                                         2.9x
                                                                                                                                                      Net debt to Adj. EBITDA* at year-end

* See non-GAAP definitions and reconciliations in the appendix
1.     Assumes growth over 2019 free cash flow on an adjusted basis of $238 million, which excludes the impact of the Arysta divestiture and assumes the Company’s current capital structure had been in place as of January 1, 2019.

                                                                                                                                                                                                                                        4
‘New Economy’ Growth Drivers Propelling Stable, High-
    Returning Business Model

                    Growth From New Economy                                                                             Attractive Businesses Managed Efficiently

                                                                                                                        ▪ Defensible margins and high returns on capital
                          5G Mobile Technologies
                                                                                                                        ▪ Balancing cost management and long-term
                                                                                                                           organic growth investments

                                                                                                                        ▪ Deploying strong, stable cash-flows effectively
                             Vehicle Electrification

                                                                                                                                  2021 Financial Guidance1

                     Semiconductor Applications
                                                                                                                                   7% Adjusted EBITDA* growth

                                  Circular Economy                                                                                   Adj. EPS* of $1.10 - $1.15
                                                                                                                                       (15-20% growth YoY)

                                                                                                                                    ~$275M of Free Cash Flow*
                                   Green Chemistry

*     See non-GAAP definitions and reconciliations in the appendix                                                                                                          5
1 – FY 2021 financial guidance as of January, 2021 as announced in Fourth Quarter and Full Year 2020 Earnings Release
Profitable Growth from 5G Adoption
Higher performance and reliability requirements for 5G technologies drives opportunities in
circuitry and advanced semiconductor applications
5G Mobile Devices – Annual Shipments (M Units) Wafer Plating
Chemistries
Advanced Packaging
1,800
1,670
1,610
1,500 IC Substrate
400 55% of
200
phones 1,000
sold in 2024 Thermal Interface
expected to
be 5G
Materials
Die Attach Solutions
Legacy 4G 5G
Rapid Growth in Semi
2019 2020 2021 2024
Source: Prismark Sept 2020
Semiconductor Segment Net Sales Growth YoY %
26% 26%
ESI Content Per Phone
19% 20%
Mid-Level Phone ~ $0.70-$0.80
Premium Phone ~ $1.10-$1.20
5G Phone ~ 15%+ vs. Premium
Q1 '20 Q2 '20 Q3 '20 Q4 '20
6
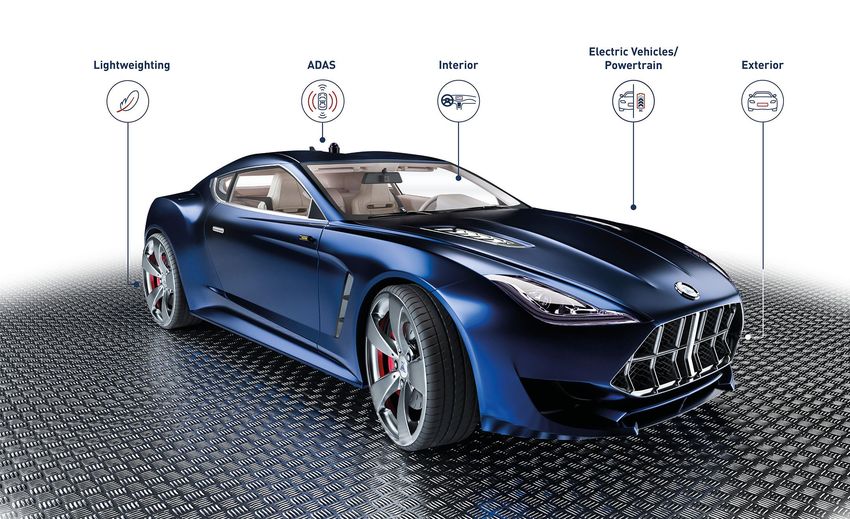
Source: Management estimatesElectronic Content Growth in Automotive
A leading provider of advanced circuitry, joining materials and surface finishing technology critical
to the development of next-generation vehicles
Enhancing safety systems to reach
next level autonomy (cameras,
radar and connectivity)
High-strength Inverter and Battery Management
lightweight materials System technologies to enhance
and surface coatings range, power and reliability
to drive efficiency in
the connected vehicle OEM-approved
sustainable exterior
decorative coatings
that offer durability and
long-lasting beauty
1.5 – 2.0x
more value in electric vehicles
Source: Management estimates of potential ESI $ content per vehicle 7Sustainable Chemistry
Enabling Green Chemistry and the Circular Economy
Innovative solutions to meet sustainability challenges and rising environmental compliance
standards globally
Sustainable Technology Offerings
▪ Reducing our customers’ environmental footprint with a
differentiated portfolio of metals reclaim, recycling
capability, wastewater treatment equipment and chemistry
✓
solutions Reducing
Environmental
Footprints
Direct ▪ Carbon-based metallization chemistries reduce power
Metallization consumption by 57% and rinse water usage by 76%
✓
Eliminating
REACH ▪ New processes enabling automotive and OEM supply Hazardous
Compliant chains to make REACH compliant parts free of hexavalent Chemicals
Solutions chromium and PFOS
Offshore ▪ Recently acquired offshore production fluid product
technology has industry-leading environmental
Environmental
✓
performance as certified by leading industry regulatory
Products bodies Sourcing
Responsibly
Low ▪ Reliable attachment materials that reduce reflow oven
temps in soldering process by 30%, enabling contract
Temperature manufacturers to lower energy costs and greenhouse gas
Solders emissions
Source: Management estimates 8Resilient, High Cash Flow Businesses
Outperforming their Markets
Steady Margins and Growing FCF* Efficiently Managed Asset Base
50% 42.9% $300
42.7% 42.4%
40% $238
$249 1.6% >80%
30% Capital Expenditures as a COGS as a variable cost
$198 % of 2020 Net Sales that flex with demand
$200
20%
21.5% 22.7% 22.8%
10%
0% $100
$35 million 93%
2018 2019 2020 Permanent net operating FCF Conversion 2
1
cost reduction since 2020
Free Cash Flow* Gross Margin Adj. EBITDA* margin launching ESI
Commercial execution driving outperformance relative to end-markets
Organic net sales growth* outpaced key automotive and high-end smartphone unit growth
Growth inflected positively exiting 2020
20.0% 10%
(2%)
10.0% (15%)
5% 4%
(3%) (6%) 1% (4%) (3%) (2%)
0.0%
(3%) (1%) (1%)(3%)
-10.0% (5%)(5%) (3%) (5%)
(8%)
-20.0% (12%)
(16%)
-30.0% (23%)
-40.0%
-50.0% (43%)
Q1 '19 Q2 '19 Q3 '19 Q4 '19 Q1 '20 Q2 '20 Q3 '20 Q4 '20
* See non-GAAP definitions and reconciliations in the appendix
Smartphone Units Global Auto Production ESI organic
1. growth
2020 Adj. EBITDA and FCF based on guidance, gross margin is
Source: Prismark, LMC Automotive – Jan 2021 YTD Sept
• See non-GAAP definitions and reconciliations in the appendix 9
1 – Excludes the impact of prior capital structure for 2018 and 2019; 2 - FCF Conversion defined as 2020 Adjusted EBITDA* ($423m) – Capex ($29m) / 2020 Adjusted EBITDA* ($423m)Benchmarking Element Solutions in Specialty Chemicals
Cash Flow and Returns
(Adj. EBITDA* – Capital Expenditures) / Net Sales (2020)1
21.3%
ESI
Peer 11
Peer 10
Peer 2
Peer 1
Peer 3
Peer 4
Peer 9
Peer 6
Peer 5
Peer 8
Peer 7
Adj. EBIT2 / Tangible Assets3 (%)
22.1%
ESI
Peer 10
Peer 11
Peer 2
Peer 9
Peer 1
Peer 8
Peer 6
Peer 5
Peer 7
Peer 4
Peer 3
• See non-GAAP definitions and reconciliations in the appendix
Source: S&P CapIQ, peers’ company filings
Note: Peers include the following companies (in alphabetical order): Ashland, Avery Dennison, Axalta, Cabot Microelectronics, DuPont, Entegris, HB Fuller, PPG, Quaker Houghton, RPM, Sherwin Williams
1. Calculated as 2020 adj. EBITDA* less capex / annual sales. ESI calculation: ($423M) – ($29M) / ($1,854M) 10
2. Calculated as 2020 adj. EBITDA* less depreciation and amortization expense. ESI calculation: ($423M) - ($161M)
3. Calculated as net working Capital plus Gross Property, Plant & Equipment plus Other Assets (excludes Prepaid Expenses) as of quarter ending Dec 31, 2020. ESI calculation $578M + $461M + $141MCapital Allocation
Progress & Priorities
ESI maintains a measured approach to capital allocation
▪ Repurchased 5.7 million shares in 2020 at Acquisition
average price of $9.74 per share Hurdle
Rate
▪ Consider
Available Risk-Adjusted
Deployed ~$75 million on complementary
Acquisition Returns
acquisitions in last 2 years at average ~6x acquisitions
EBITDA multiple pre-synergies
Share
repurchases
▪ Refinanced high-yield notes to generate
$16 million of annual interest savings in
2021
Increase
dividend or
▪ A $0.05 per share quarterly dividend build cash
initiated in December 2020
▪ Reduced net leverage ratio to 2.9x as of Premium Discount
Dec 2020 ESI Valuation
Remain committed to thoughtfully returning excess capital to shareholders
11What to Expect from Element Solutions
Compound intrinsic value through strong execution across a portfolio of high-quality assets
and prudent, long-term oriented capital allocation
Long Term Financial Objectives
▪ Outperformance relative to end-markets
▪ Solid, stable profit margins and strong cash flow generation
▪ Prudent capital allocation focused on core, existing business
▪ Net leverage ratio* below 3.5x adjusted EBITDA*
▪ Consistent return of capital to shareholders through share buybacks and/or dividends
Double adjusted EPS* to $1.36 from 2018 to 2023
* See non-GAAP definitions and reconciliations in the appendix
12Appendix
13Non-GAAP Definitions
Adjusted Earnings Per Share (EPS): Adjusted EPS is a key metric used by management to measure operating performance and trends. In particular, the exclusion of certain expenses in calculating adjusted
EPS facilitates operating performance comparisons on a period-to-period basis. Adjusted EPS is defined as net income from continuing operations attributable to common stockholders adjusted to reflect
adjustments consistent with the Company’s definition of adjusted EBITDA. Additionally, the Company eliminates the amortization associated with intangible assets, incremental depreciation associated with the
step up of fixed assets, and incremental cost of sales associated with the step up of inventories recognized in purchase accounting for acquisitions. Further, the Company adjusts its effective tax rate to 26%
and 27% for the three and twelve months ended December 31, 2020 and 2019, respectively. Lastly, the 2019 adjusted EPS total is based on the Company’s new capital structure by assuming that the sale of
Agricultural Solutions had closed and the new credit agreement had been in place on January 1, 2019. The resulting adjusted net income is then divided by the Company's adjusted common shares
outstanding. Adjusted common shares outstanding represent the shares outstanding as of the balance sheet date for the quarter-to-date period and an average of each quarter for the year-to-date period.
Adjusted common shares outstanding consists of common shares outstanding, plus the shares that would be issued if all convertible stock was converted to common stock, stock options were vested and
exercised, and equity grants with targets that are considered probable of achievement were vested at target level and issued.
Constant Currency: Management discloses net sales and adjusted EBITDA on a constant currency basis, by adjusting results to exclude the impact of changes due to the translation of foreign currencies of its
international locations into U.S. dollar. Management believes this non-GAAP financial information facilitates period-to-period comparison in the analysis of trends in business performance, thereby providing
valuable supplemental information regarding its results of operations, consistent with how the Company evaluates its financial results.
The impact of foreign currency is calculated by converting the Company's current-period local currency financial results into U.S. dollar using the prior period's exchange rates and comparing these adjusted
amounts to its prior period reported results. The difference between actual growth rates and constant currency growth rates represents the impact of foreign currency translation.
EBITDA and Adjusted EBITDA: EBITDA represents earnings before interest, provision for income taxes, depreciation and amortization. Adjusted EBITDA is defined as EBITDA, excluding the impact of
additional items included in GAAP earnings which the Company believes are not representative or indicative of its ongoing business or are considered to be associated with its capital structure, as described in
the Release. Adjusted EBITDA for each segment also includes an allocation of corporate costs, such as compensation expense and professional fees. Management believes adjusted EBITDA and adjusted
EBITDA margin provide investors with a more complete understanding of the long-term profitability trends of the Company’s business, and facilitate comparisons of its profitability to prior and future periods.
However, these measures, which do not consider certain cash requirements, should not be construed as an alternative to net income or cash flow from operations as a measure of profitability or liquidity.
Net Debt to Adjusted EBITDA ratio: Net debt to adjusted EBITDA ratio is defined as total debt (current installments of long-term debt, revolving credit facilities and long-term debt), excluding unamortized
discounts and debt issuance costs, which totaled $19.6 million at December 31, 2020, less cash divided by adjusted EBITDA.
Free Cash Flow: Free cash flow is defined as net cash flows from operating activities less net capital expenditures. Net capital expenditures include capital expenditures less proceeds from the disposal of
property, plant and equipment. Free cash flow on an adjusted basis adjusts one-time cash operating expenses. Management believes that free cash flow, which measures the Company’s ability to generate
cash from its business operations, is an important financial measure for use in evaluating the Company's financial performance. However, free cash flow should be considered in addition to, rather than as a
substitute for net cash provided by operating activities as a measure of the Company’s liquidity.
Organic Net Sales Growth: Organic net sales growth is defined as net sales excluding the impact of foreign currency translation, changes due to the pass-through pricing of certain metals, and acquisitions
and/or divestitures, as applicable. Management believes this non-GAAP financial measure provides investors with a more complete understanding of the underlying net sales trends by providing comparable net
sales over differing periods on a consistent basis.
For the three months ended December 31, 2020, Electronics' consolidated results were positively impacted by $11.1 million of acquisitions and $9.0 million of pass-through metals pricing and Industrial &
Specialty's consolidated results were positively impacted by $7.4 million of acquisitions.
For the twelve months ended December 31, 2020, Electronics' consolidated results were positively impacted by $53.6 million of acquisitions and $5.2 million of pass-through metals pricing and Industrial &
Specialty's consolidated results were positively impacted by $11.3 million of acquisitions.
*********************************************************************************************************************************************************************************************************************************
The Company only provides full year 2021 guidance related to adjusted EBITDA, adjusted EPS and free cash flow, on a non-GAAP basis and does not provide reconciliations of these forward-looking non-
GAAP measures to GAAP due to the inherent difficulty in forecasting and quantifying certain amounts that are necessary for such reconciliations, including adjustments that could be made for restructurings,
refinancings, impairments, divestitures, integration-related expenses, share-based compensation amounts, non-recurring, unusual or unanticipated charges, expenses or gains, adjustments to inventory and
other charges reflected in the reconciliation of historic numbers, the amount of which, based on historical experience, could be significant.
14Reconciliation to Adjusted Share Counts
(amounts in millions) FY 2020 FY 2019
Q4 2020 Q4 2019
(Average) (Average)
Basic outstanding common shares 247 250 248 254
Number of shares issuable upon conversion of Series A Preferred Stock - 2 - 2
Number of shares issuable upon vesting of granted Equity Awards 1 3 2 3 3
Adjusted common shares outstanding 250 255 251 258
Note: Totals may not sum due to rounding
1. Equity awards with targets that are considered probable of achievement vested at target level
15GAAP Net Income Reconciliation to Adjusted
Diluted EPS
($ millions, except per share amounts) Q4 2020 Q4 2019 FY 2020 FY 2019
Net income attributable to common stockholders $30 $74 $76 $92
Net income (loss) from discontinued operations attributable to common stockholders — 0 (1) 13
Net income from continuing operations attributable to common stockholders 30 74 77 79
Reversal of amortization expense 30 28 119 113
Adjustment to reverse incremental depreciation expense from acquisitions 2 2 8 9
Amortization of inventory step-up — 1 2 1
Adjustment to interest expense — — — 20
Restructuring expense 1 2 6 14
Acquisition and integration costs 4 (1) 12 2
Foreign exchange (gain) loss on foreign denominated external and internal long-term debt (8) (33) 35 (32)
Debt refinancing costs — 1 46 62
Foundation contributions 5 — 5 —
Change in fair value of contingent consideration — (21) — (17)
Other, net (1) 2 10 1
Tax effect of pre-tax non-GAAP adjustments (9) 5 (64) (47)
Adjustment to estimated effective tax rate 23 (5) (17) 23
Adjustment to reverse loss attributable to certain non-controlling interests — — — 1
Adjusted net income from continuing operations attributable to common stockholders $77 $56 $241 $228
Adjusted earnings per share from continuing operations $0.31 $0.22 $0.96 $0.88
Adjusted common shares outstanding1 250 255 251 258
Note: Totals may not sum due to rounding
1. See p.15 for a reconciliation to Adjusted Share Counts
16Net Income Attributable to Common Stockholders
Reconciliation to Adj. EBITDA
($ millions) Q1 2020 Q2 2020 Q3 2020 Q4 2020 FY 2020
Net income attributable to common stockholders $9 $1 $36 $30 $76
Add (subtract):
(Income) loss from discontinued operations, net of tax (0) 1 0 — 1
Income tax expense (benefit) 4 6 (47) 42 4
Interest expense, net 17 17 17 13 63
Depreciation expense 11 11 11 11 42
Amortization expense 29 29 31 30 119
EBITDA 69 64 47 125 306
Adjustments to reconcile to Adjusted EBITDA:
Amortization of inventory step-up 1 — 1 — 2
Restructuring expense 1 3 1 1 6
Acquisition and integration costs 7 1 0 4 12
Foreign exchange loss (gain) on foreign denominated external and internal long-term debt 29 12 2 (8) 35
Debt refinancing costs — — 46 — 46
Foundation contributions — — — 5 5
Other, net 3 4 4 (1) 10
Adjusted EBITDA $110 $85 $102 $126 $423
Note: Totals may not sum due to rounding
17Net Income (Loss) Attributable to Common Stockholders
Reconciliation to Adj. EBITDA
($ millions) Q1 2019 Q2 2019 Q3 2019 Q4 2019 FY 2019
Net income (loss) attributable to common stockholders $23 $2 $(7) $74 $92
Add (subtract):
Net income (loss) attributable to the non-controlling interests 1 (0) — 0 1
(Income) loss from discontinued operations, net of tax (27) 13 1 (0) (13)
Income tax (benefit) expense (10) (7) 57 21 61
Interest expense, net 38 18 17 17 91
Depreciation expense 10 10 10 11 42
Amortization expense 28 28 28 28 113
EBITDA 63 65 107 152 386
Adjustments to reconcile to Adjusted EBITDA:
Amortization of inventory step-up — — — 1 1
Restructuring expense 3 3 7 2 14
Acquisition and integration costs 1 0 1 (1) 2
Foreign exchange (gain) loss on foreign denominated external and internal long-term debt (28) 29 1 (33) (32)
Debt refinancing costs 61 0 — 1 62
Change in fair value of contingent consideration 2 1 1 (21) (17)
Other, net (3) 3 (1) 2 1
Adjusted EBITDA $99 $101 $115 $102 $417
Note: Totals may not sum due to rounding
18Free Cash Flow to Free Cash Flow on an Adjusted Basis
Reconciliation
(dollars in millions) FY 2018 FY 2019 FY 2020
Cash flows from operating activities $ (1) $ 171 $ 276
Capital expenditures (28) (30) (29)
Disposal of property, plant and equipment 4 5 2
Free cash flows $ (25) $ 146 $ 249
Adjustments to arrive at free cash flows on an adjusted basis:
Interest payments - prior capital structure (1) 293 57
(1)
Interest payments - current capital structure (70) (3)
(2)
Other - 38
Free cash flows on an adjusted basis $ 198 $ 238
Note: Totals may not sum due to rounding
1 Adjustments for 2018 and 2019 interest payments to reflect the Company's new capital structure by assuming that the Arysta Sale had closed and its new credit agreement had been in place on January 1, 2018
2 Adjustment for the payment of the contingent consideration related to the MacDermid Acquisition and payment for employee expenses associated with the Arysta Sale that did not qualify for discontinued operations
19Organic Net Sales Growth Reconciliation
Q1 Q2 Q3 Q4
2019 2020 2019 2020 2019 2020 2019 2020
Net Sales Growth (7%) (2%) (9%) (15%) (5%) 3% (5%) 18%
Impact of Currency 5% 2% 4% 2% 2% 0% 1% (2%)
Constant Currency (2%) 0% (5%) (13%) (3%) 2% (4%) 16%
Change in Pass-Through Metals Pricing 0% 0% 0% 1% 1% (1%) 0% (2%)
Acquisitions (1%) (3%) 0% (3%) 0% (4%) (1%) (4%)
Organic Net Sales Growth (3%) (3%) (6%) (15%) (2%) (2%) (4%) 10%
20You can also read