Developing the Valentine Gold Project in Newfoundland & Labrador - Pre-Feasibility Study Support Materials April 6, 2020
←
→
Page content transcription
If your browser does not render page correctly, please read the page content below
Pre-Feasibility Study Support Materials April 6, 2020

Developing the Valentine Gold Project
in Newfoundland & Labrador

@MarathonGoldMOZ
                                                              TSX: MOZ www.marathon-gold.com1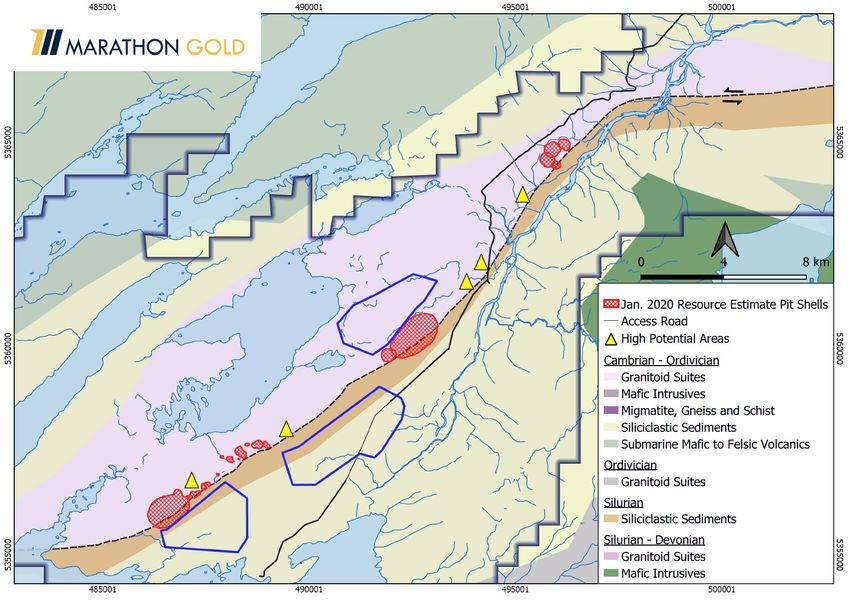
Cautionary Statement Regarding Forward Looking Information

Certain information contained in this presentation constitutes forward-looking information within the meaning of Canadian securities laws ("forward-looking statements"). All
statements in this presentation, other than statements of historical fact, which address events, results, outcomes or developments that Marathon expects to occur are
forward-looking statements. More particularly and without restriction, this presentation contains forward-looking statements and information about economic analyses for the
Valentine Gold Project, capital and operating costs, processing and recovery estimates and strategies, future exploration plans, objectives and expectations of Marathon,
future mineral resource and mineral reserve estimates and updates and the expected impact of exploration drilling on mineral resource estimates, future feasibility studies
and environmental impact statements and the timetable for completion and content thereof and statements as to management's expectations with respect to, among other
things, the matters and activities contemplated in this presentation. A mineral resource that is classified as "inferred" or "indicated" has a great amount of uncertainty as to
its existence and economic and legal feasibility. It cannot be assumed that any or part of an "indicated mineral resource" or "inferred mineral resource" will ever be upgraded
to a higher category of mineral resource. Investors are cautioned not to assume that all or any part of mineral deposits in these categories will ever be converted into proven
and probable mineral reserves.

For a more detailed list of specific forward-looking statements and information applicable to Marathon, the underlying assumptions and factors that could cause future
results or events to differ materially from current expectations expressed or implied by the forward-looking statements, refer to Marathon’s Annual Information Form for the
year ended December 31, 2019 and other filings made with Canadian securities regulatory authorities and available at www.sedar.com. Other than as specifically required
by law, Marathon undertakes no obligation to update any forward-looking statement to reflect events or circumstances after the date on which such statement is made, or to
reflect the occurrence of unanticipated events, whether as a result of new information, future events or results otherwise.

Disclosure of a scientific or technical nature in this presentation was prepared under the supervision of Robbert Borst, C.Eng, Chief Operating Officer of Marathon Gold
Corporation. Mr. Borst has verified the data disclosed including sampling, analytical and test data underlying the information contained in this presentation. This included a
site inspection, drill database verification, and independent analytical testwork. Marathon’s exploration programs are supervised by Sherry Dunsworth, MSc., P.Geo (NL),
the Senior VP of Exploration. Both Mr. Borst and Ms. Dunsworth are qualified persons under National Instrument 43-101 – Standards of Disclosure for Mineral Projects (“NI
43-101”). Marathon expects to file an updated Technical Report shortly prepared in accordance with the requirements of NI-43-101 for the Valentine Gold Project PFS
including a description of the updated Mineral Resource Estimate and the Mineral Reserve Estimate. For more information, readers are referred to the press releases dated
January 20, 2020 with respect to the Valentine Gold Project Mineral Resource Estimate and April 6, 2020 with respect to the Valentine Gold Project Pre-Feasibility Study.

                                                                                                                                                                           2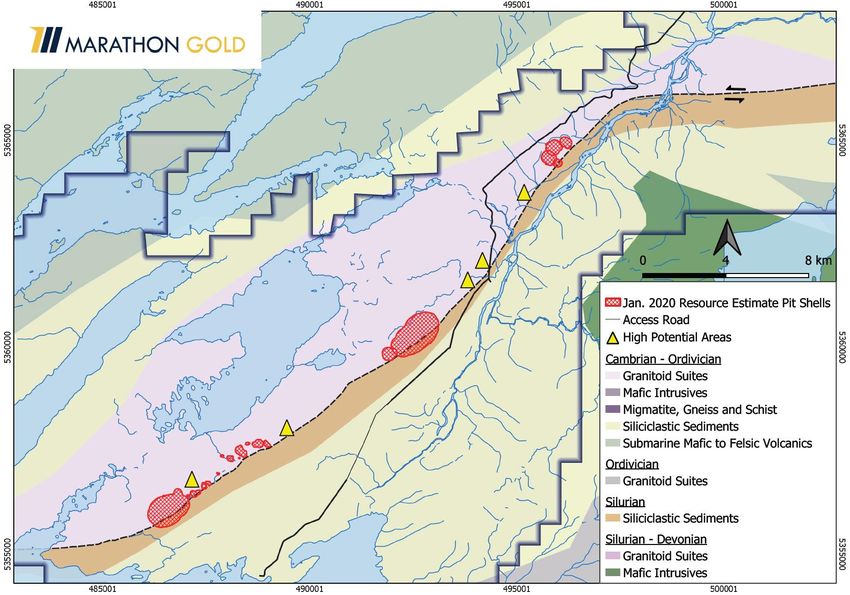
Note on Non-IFRS Measures

Non-IFRS Financial Measures

The Company has included certain non-IFRS financial measures in this presentation, such as Initial Capital Cost, Total Cash Cost, All-In Sustaining Cost, Expansion
Capital, Capital Intensity, and Effective Cash Tax Rate which are not measures recognized under IFRS and do not have a standardized meaning prescribed by IFRS. As a
result, these measures may not be comparable to similar measures reported by other corporations. Each of these measures used are intended to provide additional
information to the user and should not be considered in isolation or as a substitute for measures prepared in accordance with IFRS.

Non-IFRS financial measures used in this presentation and common to the gold mining industry are defined below.

Total Cash Costs and Total Cash Costs per Ounce

Total Cash Costs are reflective of the cost of production. Total Cash Costs reported in the PFS include mining costs, processing & water treatment costs, general and
administrative costs of the mine, off-site costs, refining costs, transportation costs and royalties. Total Cash Costs per Ounce is calculated as Total Cash Costs divided by
payable gold ounces.

All-in Sustaining Costs (“AISC”) and AISC per Ounce

AISC is reflective of all of the expenditures that are required to produce an ounce of gold from operations. AISC reported in the PFS includes total cash costs, sustaining
capital, expansion capital and closure costs, but excludes corporate general and administrative costs and salvage. AISC per Ounce is calculated as AISC divided by
payable gold ounces.

                                                                                                                                                                          3
Valentine Gold Project
                                                                                                                                                                 Pre-Feasibility Study
                                                                                                                    Atlantic Canada’s Largest Gold Project       April 6, 2020

                                   The PFS supports an open pit mining operation at the Valentine Gold Project
                                    with low initial capital cost and high rate of return over a 12-year mine life
                   Strong Valuation and High Rate of Returnnote 1                                                  Large Gold Production Profile and High Operating Marginsnote 2
• After-tax IRR of 36% and NPV5% of $472M (US$354M) at US$1,350/oz                                                 • 175,000 oz/year in Years 1-9 from high-grade mill feed; with 54,000
                                                                                                                     oz/year in Years 10-12 from low-grade stockpile
• Initial capital cost (“Capex”) of $272M (US$205M)
                                                                                                                   • LOM Total Cash Costs of US$633/oz and AISC of US$739/oz
• NPV5%/Capex ratio of 1.74
                                                                                                                   • Annual Average After-tax Free Cash Flow in Years 1-9 of C$102M
• After-tax payback of 1.8 years

Large and Growing Inventory of Reserves and Resourcesnotes 3,5,6                                                                          Mill Expansion Strategy
• P&P Mineral Reserves of 1.87 Moz (41.05 Mt at 1.41 g/t Au)                                                       • Years 1 to 3: 6,800 tpa (2.5Mtpa) Gravity-Leach
• M&I Mineral Resources of 3.09 Moz (54.9 Mt at 1.75 g/t Au)note 3                                                 • Year 4-12: 11,000 tpd (4.0 Mtpa) Gravity-Flotation-Leach
• Inf. Mineral Resources are 0.96 Moz (16.77 Mt at 1.78 g/t Au)note 4                                              • Financed Internally from Cash Flow at US$1,350/oz
• Ongoing Exploration on >20km Mineralised Trend

                                       A deliverable, high margin/high return project with robust production profile
                                                         and significant resource growth potential
   Notes:
   1. See “Notes on non-IFRS Measures”, slide 3
   2. AISC includes Total Cash Costs and Sustaining Capital, including expansion and closure costs. Excludes salvage and Corporate G&A.
   3. Mineral Resources are inclusive of the Mineral Reserves                                                                                                                       4
   4. Inferred Mineral Resources that are within the open pits are treated as waste and excluded from the PFS economic analysis.
   5. Mineral Resources that are not Mineral Reserves do not have economic viability
   6. See “Notes to the Mineral Reserves”, slide 13, and “Notes to the Mineral Resources”, slide 14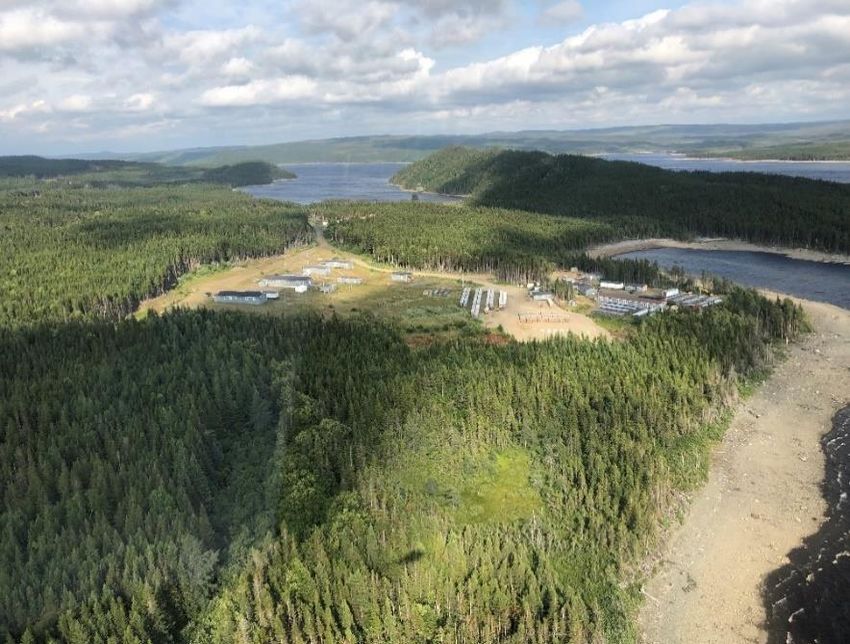
Valentine Gold Project
                                                                                                                                                                                   Pre-Feasibility Study
                                                                                                                                                              Study Authors        April 6, 2020

                Valentine Gold Project Pre-Feasibility                                                                                                                               NE
             Ausenco Engineering Canada Inc. as Lead Consultant                                                                                                        Valentine
                                                                                                                           To Star Lake
           Moose Mountain Technical Services as Mining Consultant                                                          Generating Station
                                                                                                                                                                  Lake
                  APEX Geoscience Ltd. as Geological Consultant
                                                                                                                                                             Property
                     Golder Associates Ltd. as Tailings Consultant
                                                                                                                                                                                   Marathon Deposit
               Stantec Consulting Ltd. as Environmental Consultant
                                                                                                                                        Valentine Lake               Sprite
                                                                                                                                                               Corridor
               Terrane Geoscience Inc. as Geotechnical Consultant

     The Valentine Gold Project Mineral Resource Estimate (Effective                                                                            Leprechaun Deposit
         Jan 10, 2020) was prepared by John T. Boyd Company
                                                                                                                                                             Victoria Reservoir
      The Mineral Reserve Estimate Effective (Effective April 6, 2020)
          was prepared by Moose Mountain Technical Services                                                                               SW                                                              2km
                                                                                                                                                                                            2km

Notes:
1. The reader is referred to Marathon Gold news release dated April 6, 2020 for a list of Qualified Persons associated with the Valentine Gold Project PFS
                                                                                                                                                                                                      5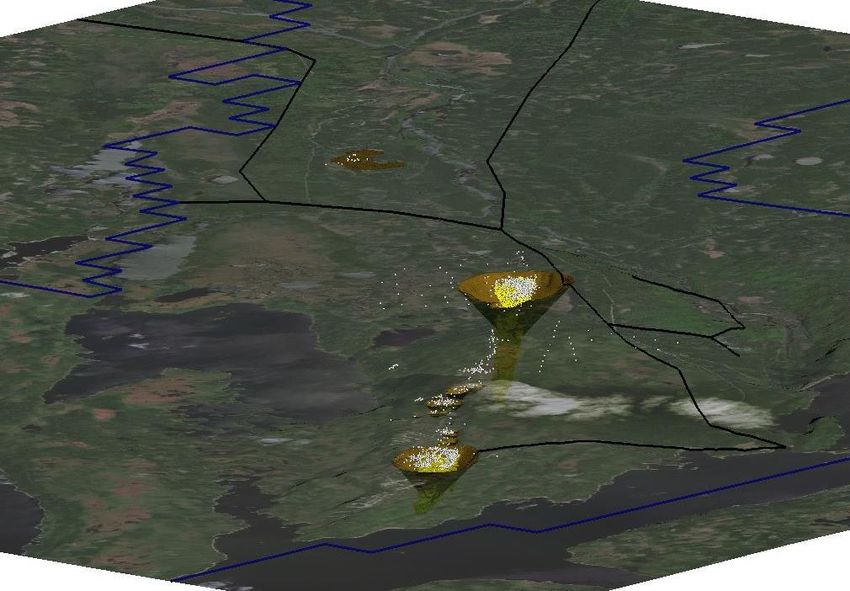
Valentine Gold Project
                                                                                             Pre-Feasibility Study
                                                                                Contents     April 6, 2020

1.   Location                                            12. Mining and Production Schedule
2.   Geology                                             13. Detailed Capital and Operating Costs
3.   Site Layout                                         14. Strip Ratios and Mining Costs
4.   Key Highlights of the PFS: Production Data          15. Tailings and Water Management
5.   Key Highlights of the PFS: Cost and Valuation       16. Environment and Water Management
6.   Mining: Pit Design                                  17. Environmental Assessment and Permitting
7.   Mining: Pit Phasing and Mineral Reserves            18. Financial Analysis (1)
8.   Mineral Resources                                   19. Financial Analysis (2)
9.   Marathon Deposit Resource-Reserve Reconciliation    20. Schedule and Execution Strategy
10. Leprechaun Deposit Resource-Reserve Reconciliation   21. 2020 Exploration
11. Processing and Recovery                              22. Appendices

                                                                                                               6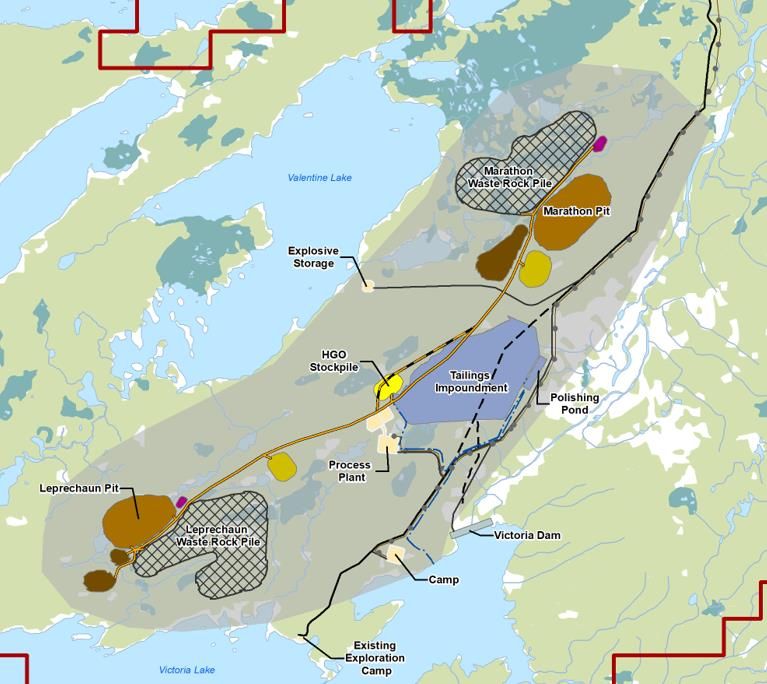
Valentine Gold Project
Pre-Feasibility Study
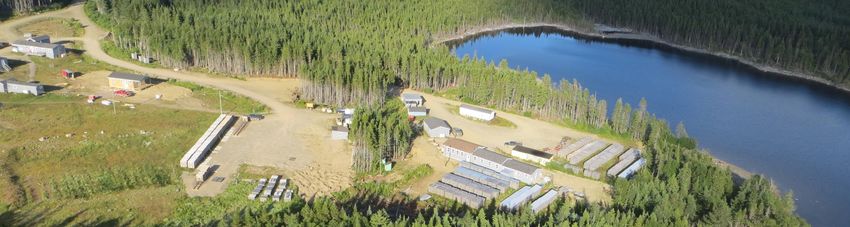
Location April 6, 2020
Key Takeaways
• The Valentine Gold Project is located in
central Newfoundland
• Approximately 80km SW of the mining
communities of Millertown and Buchans
• Project road accessible
• NL Hydro substation at Star lake 30km away
• Central Newfoundland region with mine
services and experienced workforce
• A mining region in a mining jurisdiction
Star Lake
Generating
Station
Community Meetings, Buchans, Buchans Junction, Millertown, Badger,
Grand-Falls Windsor, Bishop’s Falls February 5th-7th 2020
7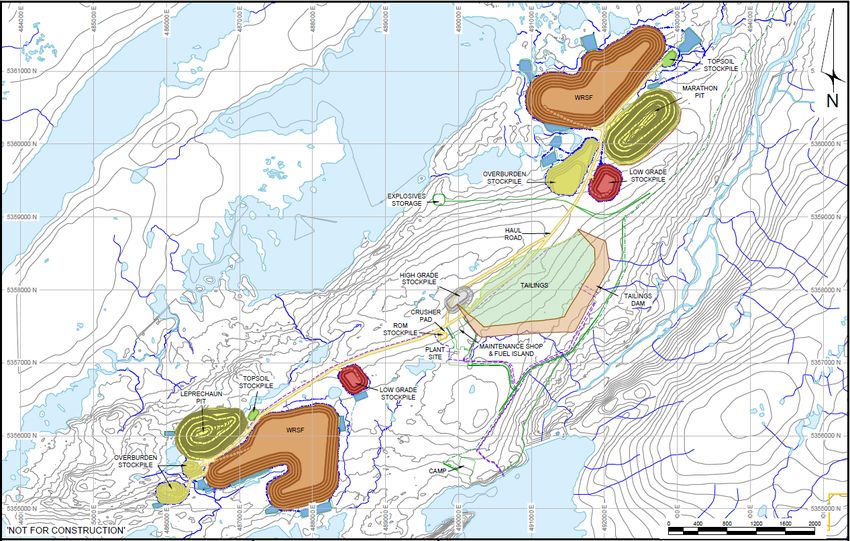
Valentine Gold Project
                                                                                                                                                                                       Pre-Feasibility Study
                                                                                                                                                     Project Geology                   April 6, 2020

                                          QTP-VG extension veining with tourmaline bleeding along
Key Takeaways                             shear fractures. Marathon Deposit discovery outcrop

• Shear Zone hosted gold                                                                                                                                                   Victory
                                                                                                                                                                                                     Valentine Lake
  deposit on 20km trend                                                                                                                                     M&I 0.05 Moz (1.1 Mt at 1.47 g/t)         Shear Zone
                                                                                                                                                             Inf. 0.1 Moz (2.1 Mt at 1.31 g/t)
• System of extensional                                                                                              Property Boundary
  Quartz-Tourmaline-
  Pyrite-Gold (“QTPV-Au”)
                                                                                                                                     Marathon
  veins adjacent to the                                                                                                                                               Victory SW
                                                                                                                          M&I 1.9 Moz (36.2 Mt at 1.92 g/t)
  Valentine Lake Shear                                                                                                    Inf. 0.7 Moz (10.6 Mt at 1.96 g/t)
  Zone                                                                                                                                                             Narrows

                                                                                                                                                                Triangle
• Veins are shallowly
                                          Marathon Deposit geological cartoon with 300ppb grade                    Leprechaun
  dipping and stacked en-                 shell in geological context
  echelon, forming steeply                                                                                M&I 1.1 Moz (16.9 Mt at 1.99 g/t)
                                                                                                          Inf. 0.2 Moz (2.9 Mt at 1.67 g/t)
  plunging “Main Zones”                                                                                                                                        Marathon SW

• Open at depth and                                                               Victoria Lake
  along strike                                                                    Shear Zone                                                   Berry Zone

• Four deposits with                                         QTPV-Au
                                                             Main Zone
  Mineral Resources                                                                                                              Rainbow                          Sprite
  identified, “Sprite                                                          Mafic                                                              M&I 0.04 Moz (0.7 Mt at 1.77 g/t)
  Corridor” current focus                                                      dykes                                                              Inf. 0.05 Moz (1.2 Mt at 1.29 g/t)
                                           Hanging-wall                                       Foot-wall
  of exploration.                          Trondhjemite                                      Sediments

 Notes
 1. Mineral Resources are inclusive of the Mineral Reserves
 2. Mineral Resources that are not Mineral Reserves do not have economic viability                                                                                                                          8
 3. See “Notes to the Mineral Reserves”, slide 14 and “Notes to the Mineral Resources”, slide 15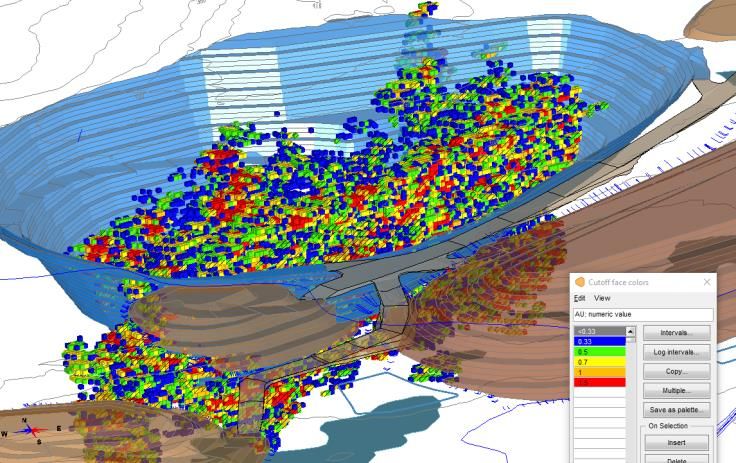
Valentine Gold Project
                                                                          Pre-Feasibility Study
             Schematic Cross-Sections, Marathon and Leprechaun Deposits   April 6, 2020

Leprechaun                                                Marathon

                                                                                            9
Valentine Gold Project
                                                                                                                                                       Pre-Feasibility Study
                                                                                                                               Site Layout             April 6, 2020

Key Takeaways                                                                                                              Marathon Waste Rock

• Two open pits (Marathon and Leprechaun)
                                                                                                   Valentine Lake
                                                                                                                                                                    Marathon Pit
• Waste piles adjacent to pits
• Tailings Management Facility (“TMF”) avoids area
  of known fish habitat and is located downstream of                                                                        Overburden
  the Victoria Reservoir and Victoria Dam                                                             Explosives
                                                                                                                                                          LG Stockpile

• Mill centrally located
• 300 person accommodation camp
                                                                                                      HG Stockpile                       TMF
• Upgraded 80km long access road from Millertown
  via Red Indian Lake
• 30km long NL Hydro 66 kV transmission line from                                  LG Stockpile                     MIll
  Star Lake Hydroelectric Station                             Leprechaun Pit

• Waste Rock Storage Facilities and TMF avoid
                                                                                                                                                   Victoria Dam
  areas of known fish habitat and potential impact
  on Victoria Reservoir and Victoria Dam               Overburden
                                                                                                              Camp

                                                                           Leprechaun Waste Rock                                  Victoria Reservoir

                                                                                                                                                                                   10
Valentine Gold Project
Pre-Feasibility Study
Key Highlights of the PFS: Production Data April 6, 2020
Production Datanote 1 Values Units
Life of Mine 12 Years
Processing Years 1-3 (Phase 1) 6,800 (2.5) tpd (Mtpa)
Processing Years 4-12 (Phase 2) 11,000 (4.0) tpd (Mtpa)
Recovered Gold 1.73 Moz
Average Gold Recovery 93%
Total Mined Tonnes (including prestrip) 353 Mt
Total Milled Tonnes 41 Mt
Overall Strip Ratio 7.6 waste:ore
Average Annual Gold Production 170 koz
Years 1-5: Payback &
Average Mill Feed Grade 2.01 g/t
Expansion Phase
Annual Average After-Tax Free Cash Flow $86 C$M
Average Annual Gold Production 175 koz
Years 1-9: Main Phase Average Mill Feed Grade 1.74 g/t
Annual Average After-Tax Free Cash Flow $102 C$M
Average Annual Gold Production 145 koz
Years 1-12: Including Low
Average Mill Feed Grade 1.41 g/t
Grade Stockpile
Annual Average After-Tax Free Cash Flow $84 C$M
Notes:
1. See “Notes on non-IFRS Measures”, slide 3
11Valentine Gold Project
Pre-Feasibility Study
Key Highlights of the PFS: Cost and Valuation April 6, 2020
Capital Costsnote 1 Values Units Financial Analysisnote 1 Values Units
Initial Capital $272 C$M Gold Price Assumption for Financial Analysis $1,350 US$
Expansion Capital $42 C$M US$:C$ Exchange 0.75
LOM Sustaining Capital (net of closure salvage) $231 C$M Pre-Tax NPV5% $752 C$M
LOM Total Capital $545 C$M Pre-Tax IRR 45.1%
Contingency (included in all capital items) 15% Pre-Tax Payback 1.6 years
After-Tax NPV5% $472 C$M
Operating Costsnote 1 Values Units After-Tax IRR 36.2%
Mining (/t mined)note 2 $2.51 C$/t After-Tax Payback 1.8 years
Mining (/t milled) $20.88 C$/t Royaltiesnote 4 1.5%
Processing (/t milled) $11.26 C$/t Pre-Tax Unlevered Free Cash Flow $1,115 C$M
G&A (/t milled) $2.27 C$/t After-Tax Unlevered Free Cash Flow $710 C$M
Total Operating Cost (/t milled) $34.40 C$/t Effective Cash Tax Rate 29%
Refining & Transport $2.57 C$/oz
LOM Average Cash Cost $633 US$/oz
LOM Average All-In Sustaining Costnote 3 $739 US$/oz
Capital Intensity (Initial Capital/oz) $118 US$/oz
Notes
1. See “Notes on non-IFRS Measures”, slide 3
2. Based on total material moved, excluding pre-strip 12
3. AISC includes total Cash Costs and Sustaining Capital, including expansion and closure costs. Excludes salvage and Corporate G&A
4. A 1.5% Net Smelter Royalty is applied to all gold production. In February 2019 the Company sold a 2% net smelter returns royalty on the Valentine Gold Project to Franco-Nevada Corp. The PFS assumes the
exercise of a right in favour of the Company to repurchase 0.5% of the NSR for US$7M prior to December 31, 2022, the cost of which is excluded from the Project-level economic analysis.Valentine Gold Project
Pre-Feasibility Study
Mining: Pit Design April 6, 2020
Key Takeaways Marathon Selected Pit
700,000 900.0
25.5 Mtonnes Mineral Reserves, strip ratio 6.7
• Open pit mining from Leprechaun 600,000 Mill Feed 800.0
and Marathon Deposits Waste 700.0
M+I RESOURCE (KT)
UNDISCOUNTED CASHFLOW (M$)
500,000 UCF
600.0
• Optimized design on undiscounted 400,000 500.0
cumulative cash flow basis to 300,000 400.0
optimize rate of return 200,000
300.0
200.0
• Each pit developed in three 100,000 100.0
phases. Ultimate Marathon pit 0 0.0
1,250m x 700m x 294m deep,
Leprechaun pit 1,050 m x 650 m by
LG PRICE FACTOR
306 m deep Leprechaun Selected Pit
15.6 Mtonnes Mineral Reserves, strip ratio 9.1
• LOM strip ratios 6.7 at Marathon 400,000 600.0
Mill Feed
and 9.1 at Leprechaun, and 7.6 500.0
M+I RESOURCE (KT)
300,000 Waste
overall
UNDISCOUNTED CASHFLOW (M$)
UCF 400.0
• 6m benches and 8m wide berms 200,000 300.0
every third bench, in addition to 100,000
200.0
geotechnical berms and ramps 100.0
0 0.0
• Mobile mining fleet includes thirty-
two 90-tonne trucks
LG PRICE FACTOR
13Valentine Gold Project
Pre-Feasibility Study
Mining: Pit Phasing and Mineral Reserves April 6, 2020
Mineral Reserves Ore Tonnes Diluted Grade Waste Tonnes Strip Ratio Insitu Gold Strip Efficiency
Category
by Mining Phase (Mt) (g/t Au) (Mt) (w/o) (Moz Au) (t/oz) Marathon
Marathon Pit Pit Phases
Phase 1 7.30 1.48 24.61 3.4 0.35 71.0
Phase 2 8.42 1.28 44.27 5.3 0.35 128.1
Phase 3 9.73 1.32 101.42 10.4 0.41 245.7
Total 25.45 1.35 170.30 6.7 1.10 154.1
Leprechaun Pit
Phase 1 5.04 1.55 26.53 5.3 0.25 105.9
Phase 2 3.01 1.30 34.01 11.3 0.13 270.4
Phase 3 7.55 1.59 81.09 10.7 0.39 210.5
Total 15.60 1.52 141.64 9.1 0.76 186.0
Total Mineral Reserves
41.05 1.41 311.93 7.6 1.87 167.1
Mineral Reserves by Deposit Mineral Reserves by Grade Category Leprechaun
Pit Phases
Ore Tonnes Diluted Grade Insitu Gold Ore Tonnes Diluted Grade Insitu Gold
Category Category
(Mt) (g/t Au) (Moz Au) (Mt) (g/t Au) (Moz Au)
Marathon Proven 17.86 1.41 0.81 High Grade Proven 16.62 2.11 1.13
Deposit Probable 7.59 1.21 0.30 (+0.70 g/t) Probable 8.68 1.74 0.49
Total 25.45 1.35 1.10 Total 25.29 1.98 1.61
Leprechaun Proven 8.40 1.75 0.47 Low Grade Proven 9.65 0.50 0.16
Deposit Probable 7.20 1.25 0.29 (+0.33/-0.70 g/t) Probable 6.11 0.50 0.10
Total 15.60 1.52 0.76 Total 15.76 0.50 0.26
Total Mineral Reserves Total Mineral Reserves
Total 41.05 1.41 1.87 Total 41.05 1.41 1.87
Notes to the Mineral Reserves: 4. Mineral Reserves are mined tonnes and grade, referenced to the mill feed at the crusher. This mill feed includes estimates of mining dilution and recovery
1. The Mineral Reserve estimate has been prepared by an independent Qualified factor.
Person, Marc Schulte, P.Eng., of Moose Mountain Technical Services, with an 5. Mineral Reserves are reported at a cut-off grade of 0.33 g/t Au, based on a US$1,300/oz gold price, 0.75 US$:C$ exchange rate, 99.9% payable gold,
effective date of April 6, 2020.
6.
C$2.57/oz refining and transport costs, 85% process recovery at cutoff, $12.40/t process costs, $1.90/t G&A costs, and $1.50/t stockpile re-handle costs.
The estimate of mineral reserves may be materially affected by environmental, permitting, legal, title, socio-political, marketing, or other relevant issues
14
2. The Mineral Reserves are based on the Mineral Resource Estimate effective
January 10, 2020 (see new release dated January 20, 2020) including risks set forth in in Marathon’s Annual Information Form for the year ended December 31, 2019 and other filings made with Canadian securities
3. The Mineral Reserves are based on engineering and technical information regulatory authorities and available at www.sedar.com
developed at a Pre-Feasibility level for the Marathon and Leprechaun deposits. 7. Columns may not sum exactly due to rounding.Valentine Gold Project
Pre-Feasibility Study
Mineral Resources April 6, 2020
Measured and Indicated Mineral Resources by Deposit Update, January Moz
2010-2020 Growth M&I Mineral Resources 3.5
(Mineral Resources Inclusive of the Mineral Reserves) 20, 2020
3.0
Over this same ten-year period, the quantity of
Category Tonnes (Mt) Grade (g/t Au) Gold (Moz Au) Inferred Mineral Resources in addition to the M&I 2.5
has grown from 0.28 Moz to 0.96 Moz of gold. 2.0
Measured 23.15 1.73 1.29 3.09 1.5
Marathon Deposit 2.69
Indicated 13.04 1.52 0.64 2.14 1.0
1.85
Total M&I 36.20 1.65 1.92
1.06 1.39 0.5
0.68 0.72 0.82
0.28 0.0
Measured 8.53 2.23 0.61
Leprechaun Deposit Dec-2010 Oct-2012 Jun-2013 Aug-2013 Apr-2015 Feb-2017 Nov-2017 May-2018 Oct-2018 Jan-2020
Indicated 8.37 1.73 0.47
Total M&I 16.90 1.99 1.08 Measured and Indicated Ounces (Moz)
Measured - - - Inferred Mineral Resources by Deposit
Victory Deposit
Indicated 1.08 1.47 0.05
Total M&I 1.08 1.47 0.05
Category Tonnes (Mt) Grade (g/t Au) Gold (Moz Au)
Measured - - -
Sprite Deposit
Indicated 0.68 1.77 0.04 Marathon Deposit Inferred 10.57 1.96 0.67
Total M&I 0.68 1.77 0.04 Leprechaun Deposit Inferred 2.86 1.67 0.15
Victory Deposit Inferred 2.14 1.31 0.09
Measured 31.69 1.86 1.90 Sprite Deposit Inferred 1.19 1.29 0.05
All Deposits
Indicated 23.17 1.60 1.19
Total M&I 54.85 1.75 3.09 All Deposits Total Inferred 16.77 1.78 0.96
Notes to the Mineral Resources: 5. The reader is reminded that mineral resources which are not mineral reserves do not have
1. The Mineral Resource has an effective date of January 10, 2020. demonstrated economic viability. The estimate of mineral resources may be materially affected by
2. Mineral Resources are based on $1,300/oz gold with a US$:C$ exchange rate of 0.75 environmental, permitting, legal, title, socio-political, marketing, or other relevant issues including risks
3. In-pit Mineral Resources have been determined by the Whittle method based on an estimate of their reasonable prospects for set forth in in Marathon’s Annual Information Form for the year ended December 31, 2019 and other
filings made with Canadian securities regulatory authorities and available at www.sedar.com.
15
economic extraction, using certain assumptions for gold recovery, costs for mining, processing and sale.
4. The Mineral Resources were estimated using a block model with a block size of 6 m by 6 m by 6 m sub-blocked to a minimum 6. Mineral Resources are inclusive of the Mineral Reserves
block size of 2 m by 2 m by 2 m using ID3 methods for grade estimation. All Mineral Resources are reported using an open pit 7. Columns may not sum exactly due to rounding.
gold cut-off of 0.300 g/t Au and an underground gold cut-off of 1.663 g/t Au. 8. See “Note on Historical Disclosure of Mineral Resources at the Valentine Gold Project” on Slide 31Valentine Gold Project
Pre-Feasibility Study
Marathon Deposit Resource-Reserve Reconciliation April 6, 2020
Metal Marathon
Tonnage Au Grade
Content Waste (Mt) Reconciliation Steps Resource Pit Shell
(Mt) (g/t)
(Moz.)
Mineral Resource Estimate using 2mx2mx2m sub-
M&I Mineral Resources in Resource
35.2 1.58 1.79 415.3 block resource model, Whittle pit method, and
Pit Shell Pit (0.30 g/t cutoff)
Reasonable Prospects for Economic Extraction test
M&I Mineral Resources in Mining Mining pit design optimized on undiscounted
22.2 1.63 1.16 173.0
Pit (0.30 g/t cutoff) cumulative cash flow to optimize rate of return.
M&I Mineral Resources in Mining Applying 0.33g/t bottom cut-off using economic
21.2 1.70 1.15 174.1
Pit (0.33 g/t cutoff) inputs for Mineral Reserve Estimation
Applying estimated mining dilution of 21% and ore
Diluted M&I Mineral Resources in
26.7 1.31 1.13 169.0 loss of 2% to 6mx6mx6m mining block model,
Mining Pit (0.33 g/t cutoff)
including addition of overburden
Marathon
Transfer isolated ore blocks from ore to waste Mining Pit Shell
P&P Mineral Reserves 25.5 1.35 1.10 170.3
categories. Loss of 5% of ore and 2% of metal.
Recovered Ounces 1.03 Applying 93% average process recovery
Diluted Inferred Mineral Resources within Mining Pit
(Classified as Waste)
Tonnes Diluted Grade Insitu Gold
Category
(Mt) (g/t Au) (Moz Au)
Marathon
Inferred 5.5 1.03 0.18
Deposit
Notes
1. Mineral Resources are inclusive of the Mineral Reserves
2. Mineral Resources that are not Mineral Reserves do not have economic viability 16
3. See “Notes to the Mineral Reserves”, slide 14, and “Notes to the Mineral Resources”, slide 15Valentine Gold Project
Pre-Feasibility Study
Leprechaun Deposit Resource-Reserve Reconciliation April 6, 2020
Metal Leprechaun
Tonnage Au Grade
Content Waste (Mt) Reconciliation Steps Resource Pit Shell
(Mt) (g/t)
(Moz.)
Mineral Resource Estimate using 2mx2mx2m sub-
M&I Mineral Resources in Resource
16.6 1.96 1.07 182.2 block resource model, Whittle pit method, and
Pit Shell Pit (0.30 g/t cutoff)
Reasonable Prospects for Economic Extraction test
M&I Mineral Resources in Mining Mining pit design optimized on undiscounted
13.3 1.94 0.83 143.6
Pit (0.30 g/t cutoff) cumulative cash flow to optimize rate of return.
M&I Mineral Resources in Mining Applying 0.33g/t bottom cut-off using economic
12.7 2.02 0.82 144.3
Pit (0.33 g/t cutoff) inputs for Mineral Reserve Estimation
Applying estimated mining dilution of 25% and ore
Diluted M&I Mineral Resources in
16.7 1.45 0.78 140.6 loss of 6% to 6mx6mx6m mining block model,
Mining Pit (0.33 g/t cutoff)
including addition of overburden
Leprechaun
Transfer isolated ore blocks from ore to waste Mining Pit Shell
P&P Mineral Reserves 15.6 1.52 0.76 141.6
categories. Loss of 6% of ore and 2% of metal.
Recovered Ounces 0.71 Applying 93% average process recovery
Diluted Inferred Mineral Resources within Mining Pit
(Classified as Waste)
Tonnes Diluted Grade Insitu Gold
Category
(Mt) (g/t Au) (Moz Au)
Leprechaun
Inferred 2.6 1.09 0.09
Deposit
Notes
1. Mineral Resources are inclusive of the Mineral Reserves
2. Mineral Resources that are not Mineral Reserves do not have economic viability 17
3. See “Notes to the Mineral Reserves”, slide 14, and “Notes to the Mineral Resources”, slide 15Valentine Gold Project
Pre-Feasibility Study
Processing and Recovery April 6, 2020
Key Takeaways Phase 1
Gravity-
• Years 1-3: Phase 1 6,800 tpd (2.5 Mtpa) based on Leach
gravity-leaching
• Year 4 onwards: Phase 2 expansion to 11,000 tpd
(4.0 Mtpa) based on gravity-flotation-leaching.
• Grinding will be by way of a SAG and a ball mill.
No additional grinding equipment will be required
for the expansion phase.
• Overall gold recovery is estimated at 93% at an
average grade of 1.41 g/t Au (85% at cut-off grade Phase 2
and capped at 97%) Gravity-
Flotation-
• Overall, Phase 1 Gravity-Leaching has the Leach
advantage of a lower initial capital cost but at an
average $3/t higher operating cost and
approximately 0.6% lower recoveries
• Phase 2 Gravity-Flotation-Leaching allows for
higher throughput, with an estimated $42M of
expansion capital, at a lower average operating
cost and higher recovery
Notes
1. See “Notes on non-IFRS Measures”, slide 3
18Valentine Gold Project
Pre-Feasibility Study
Mining and Production Schedules April 6, 2020
70.0 20.0
Mining and
Mining Takeaways 60.0
Strip Ratio
50.0 15.0
waste/ore
Mtonnes
• Years 1-5: Payback and Expansion 40.0 Total Waste Mined (Mt)
10.0
• Annual Gold Production 170koz 30.0
Total Resource Mined (Mt)
• Head Grade 2.01 g/t 20.0 5.0
• Annual After-Tax Cash Flow C$86M 10.0 Strip Ratio (waste/ore)
0.0 0.0
• Years 1-9: Main Phase Y-1 Y1 Y2 Y3 Y4 Y5 Y6 Y7 Y8 Y9 Y10 Y11 Y12
7.0
• Annual Gold Production 175koz
6.0 Mining and
• Head Grade 1.74 g/t
• Annual After-Tax Cash Flow C$102M
5.0 Milling
Mtonnes
4.0
Total Resource Milled
• Years 1-12: Including Low Grade Stockpile 3.0
• Annual Gold Production 145koz 2.0 Total Resource Mined (Mt)
1.0
• Head Grade 1.41 g/t
0.0
• Annual After-Tax Cash Flow C$84M
Y-1 Y1 Y2 Y3 Y4 Y5 Y6 Y7 Y8 Y9 Y10 Y11 Y12
250 3.50
Milling Takeaways Gold Recovery and
3.00
200 Head Grade
• Years 1-3: Phase 1 (Gravity-Leach) 2.50
Gold koz
Gold g/t
150
• 6,800 tpa (2.5 Mtpa) 2.00 Recovered Gold (koz)
100 1.50
• Years 4-12: Phase 2 (Gravity-Flotation-Leach) Gold Grade (g/t)
1.00
• 11,000 tpa (4.0 Mtpa) 50
0.50
0 -
Y1 Y2 Y3 Y4 Y5 Y6 Y7 Y8 Y9 Y10 Y11 Y12
Notes
1. See “Notes on non-IFRS Measures”, slide 3
19Valentine Gold Project
Pre-Feasibility Study
Detailed Capital and Operating Costs April 6, 2020
Itemnote 1 Cost (C$M) Itemnote 1 Value Units
Pre-strip Mining Capex $ 25 Tonnes Mined, Years 1-12 342 Mt
Mining Capex $ 23 Tonnes Milled, Years 1-12 41 Mt
Construction Indirects $ 7 Payable Ounces 1.73 Moz
Mill Process Facility $ 61 $ 857 C$M
Reagents & Plant Services $ 12 Mining Costs $ 2.51 C$/tonne mined
Infrastructure $ 73 $ 20.88 C$/tonne milled
Management and Owners Costs $ 36
Contingency $ 35 $ 462 C$M
Total Initial Capital $ 272 Processing & Water Treatment
$ 11.26 C$/tonne milled
Mill Expansion $ 36 $ 93 C$M
Contingency $ 5 G&A
$ 2.27 C$/tonne milled
Mill Expansion Capital $ 42
$ 1,412 C$M
Sustaining Capital, Mining $ 142 Total
$ 34.40 C$/tonne milled
Sustaining Capital, Infrastructure $ 37
Closure $ 35 Off-Site Costs, Refining and Transport $ 4 C$M
Salvage $ (13) Royaltiesnote 2 $ 47 C$M
Contingency $ 30
Total Sustaining Capital $ 231 Total Cash Costs $ 633 US$/oz
Sustaining Capital (excluding salvage) $ 244 C$M
LOM Total $ 545 Total AISCnote 3 $ 739 US$/oz
Notes
1. See “Notes on non-IFRS Measures”, slide 3
2. A 1.5% Net Smelter Royalty (“NSR”) is applied to all gold production. In February 2019 the Company sold a 2% net smelter returns royalty on the Valentine Gold Project to Franco-Nevada Corp. The PFS 20
assumes the exercise of a right in favour of the Company to repurchase 0.5% of the NSR for US$7M prior to December 31, 2022, the cost of which is excluded from the Project-level economic analysis.
3. AISC includes Cash Costs and Sustaining Capital, including expansion and closure costs. Excludes salvage and Corporate G&A
4. Columns may not sum exactly due to roundingValentine Gold Project
Pre-Feasibility Study
Strip Ratios and Mining Costs April 6, 2020
Key Takeaways Strip Ratio Sensitivity on Mining Costs
$3.40
Unit Mining Cost ($/t mined)
• Relatively high strip ratio offset by grade $3.20
▪ Phase 1 (both pits) – c.32% of in situ ounces at strip ratio of 4.1 to 1 $3.00
▪ Phase 2 (both pits) – c.25% of in situ ounces at strip ratio of 6.9 to 1
$2.80
▪ Phase 3 (both pits) – c.43% of in situ ounces at strip ratio of 10.6 to 1
$2.60 C$2.51/t at 7.6 waste:ore
▪ “Waste” includes:
▪ Inferred Mineral Resources of 0.27Moz (8.07 Mt at 1.05 g/t Au; diluted) $2.40
▪ Isolated ore blocks in 6mx6mx6m whole block model $2.20
▪ Focus on Mining Costs at C$2.51/t. Mining Costs are highly sensitive to strip $2.00
ratio: 2.0 3.0 4.0 5.0 6.0 7.0 8.0 9.0 10.0
Strip Ratio (t/t)
• Waste mining unit costs are generally less expensive than ore mining
costs, with fewer controls on loss and dilution • The Valentine Gold Project is planned to have a high total
• At the Valentine Project, waste rock stockpiles will be located annual mining rate
immediately adjacent to the open pits, whereas ore is hauled to a • The mine production schedule calls for an annual
crusher located c.3 km from each deposit. Waste rock stockpiles are average mining rate of 38 Mtpa, peaking at 60 Mtpa (104
also kept low to reduce significant elevation gains on the hauls ktpd and 164 ktpd respectively) of total pit production
• C$2.51/t at a strip ratio of 7.6 is equivalent to c.C$3.00/t at a strip ratio • This planned mining rate would put the operation in the
of c.4.0 top three open pit gold operations in all Eastern Canada
• Sensitivity of c.3% after-tax IRR every per C$0.25/t increase in mining for total pit production (with Detour Lake mine in Ontario,
costs Marlartic mine in Quebec)
21Valentine Gold Project
Pre-Feasibility Study
Tailings and Water Management April 6, 2020
Key Takeaways
• The PFS contemplates thickened tailings
deposition in a Tailings Management Facility
(“TMF”)
• The TMF will receive thickened tailings from
the mill between Years 1 and 9, with the mined-
out Leprechaun open pit scheduled to receive
tailings starting in Year 10
• The TMF has been located to avoid known
areas of fish habitat, and is located
downstream of the Victoria Reservoir and the
associated Victoria Dam
• Effluent and contact water from the TMF, waste
rock piles and open pits will be collected and, if
necessary, treated prior to release
• Waste rock and tailings geochemical
characterization studies indicate very low
likelihood for acid rock drainage or metal
leaching from either the waste rock storage
facilities or tailings
22
22Valentine Gold Project
Pre-Feasibility Study
Environmental Assessment and Permitting April 6, 2020
• The Valentine Gold Project is subject to regulation under the environmental protection regimes of the Canadian
Environmental Assessment Act and the Newfoundland and Labrador (“NL”) Environmental Protection Act
• Marathon filed a project description with both the Impact Assessment Agency (“IAA”, formerly the Canadian
Environmental Assessment Agency) and the NL Department of Municipal Affairs and Environment (“NLDMAE”)
on April 5, 2019, which was accepted into the formal Environmental Assessment (“EA”) process on April 16,
2019. Both the IAA and the NLDMAE issued a determination requiring a project Environmental Impact
Statement (“EIS”) and EIS guidelines have now been published by both parties
• The establishment of NL EA committee for the Valentine Gold Project was announced on July 3 2019, which
will be the principal forum for project review, consultation and, ultimately, ministerial approval
• In support of the EA process, Marathon will engage in a comprehensive program of impact assessment on
wildlife and fish habitat, water and air quality, third party co-located infrastructure, and communities. Baseline
studies have been ongoing since 2010. Formal stakeholder engagement with the communities of Buchans,
Millertown and Grand Falls-Windsor, as well as the Qalipu and Miawpukek (Conne River) First Nations
commenced in March 2019
• In support of the EA process and the future development and operation of the Project, Marathon has also
initiated formal stakeholder engagement with the communities of Buchans, Buchans Junction, Millertown,
Badger, Bishop’s Falls and Grand Falls-Windsor, the Qualipu and Miawepukek (Conne River) First Nations and
other interested parties
• The PFS estimates maximum employment of 404 persons during construction and 426 persons during
operations, and over $100 million of annual average purchasing of goods and services
23Valentine Gold Project
Pre-Feasibility Study
Financial Analysis (1) April 6, 2020
Key Takeaways (all metrics quoted after 29% effective cash tax rate) Gold Price (US$/oz) $1,050 $1,150 $1,250 $1,350 $1,450 $1,550 $1,650
• Valuation Assumptionsnote 1
• US$1300/oz for Mineral Resources 0% $242 $415 $569 $710 $844 $975 $1,105
• US$1300/oz for Mineral Reserves 3% $159 $306 $437 $555 $668 $778 $887
• US$1350/oz for Financial Model and Valuation
After-Tax NPV 5% $115 $248 $366 $472 $573 $671 $769
• US$:C$ exchange of 0.75
(C$M) 8%
• 5% discount rate, discounted to Dec 31, 2021 $61 $177 $278 $370 $457 $541 $625
• January 1, 2022 construction start; Mid-2023 first gold pour 10% $32 $138 $231 $315 $393 $470 $546
• Focused on capital intensity and risk-adjusted returnsnote 1. 15% -$23 $63 $139 $207 $270 $331 $392
• Base Case (US$1,350/oz):
• NPV5% of C$472M, IRR of 36%, Paybacknote2 of 1.8 years After-Tax IRR 12.7% 21.5% 29.3% 36.2% 42.7% 48.8% 55.0%
• Downside (US$1,200/oz):
• NPV5% of C$308M, IRR of 25%, Payback of 4.0 yearsnote3 NPV5%/Capex 0.4 0.9 1.3 1.7 2.1 2.5 2.8
• Spot (US$1,600/oz):
• NPV5% of C$720M, IRR of 52%, Payback of 1.4 years After-Tax Payback Years 7.0 5.0 3.6 1.8 1.6 1.4 1.3
• The project achieves an IRR of 15% at US$1075/oz
• The project achieves a NPV5%/Capex ratio of 1:1 at US$1175/oz
• The project achieves a NPV15%/Capex ratio of 1:1 at US$1450/oz
Notes
1. See “Notes on non-IFRS Measures”, slide 3
2. Payback is defined as achieving cumulative positive free cashflow after all cash costs and capital costs, including sustaining and expansion. 24
3. Downside valuation scenario achieves payback on the above definition after mill expansionValentine Gold Project
Pre-Feasibility Study
Financial Analysis (2) April 6, 2020
Key Takeaways (all metrics quoted after 29% effective cash tax rate) Factor -20% -10% 0% 10% 20%
IRR 15.4% 26.6% 36.2% 44.8% 53.1%
• High NPV5%/Capex Ratiosnote 1 Head Grade
• Base Case (US$1,350/oz): 1.74x NPV $156 $326 $472 $607 $739
• Downside (US$1,200/oz): 1.13x IRR 44.2% 40.3% 36.2% 31.7% 27.3%
Operating Cost
• Spot (US$1,600/oz): 2.65x NPV $596 $536 $472 $405 $338
• High-Grade, High-Margin Project Out of the Gatenote 1 Capital Cost
IRR 48.2% 41.5% 36.2% 32.0% 28.4%
• Years 1 to 5: Head Grades 2.0 g/t, Average Annual Free Cash Flow NPV $525 $499 $472 $446 $419
C$86m (incl funding expansion capex)
IRR 41.8% 39.0% 36.2% 33.1% 30.1%
Mining Cost (C$/t Mined)
• High Value Rocknote 1 NPV $549 $511 $472 $430 $388
• Years 1 to 5: Head Grades 2.0 g/t at US$1,350/oz yields NSR value of
US$86/tonne
• Years 1 to 9: Head Grades 1.7g/t at US$1,350/oz yields NSR value of
US$73/tonne
• High Marginsnote 2
• Years 1 to 5: Weighted Avg Total Cash Costs of US$704/oz and AISC
of US$857/oz
• Years 1 to 9: Weighted Avg Total Cash Costs of US$622/oz and AISC
of US$717/oz
Notes
1. See “Notes on non-IFRS Measures”, slide 3
2. AISC includes Cash Costs and Sustaining Capital, including expansion and closure costs. Excludes salvage and Corporate G&A. 25Valentine Gold Project
Pre-Feasibility Study
Schedule and Execution Strategy April 6, 2020
2019 2020 2021 2022 2023 2024
1H 2H 1H 2H 1H 2H 1H 2H 1H 2H
Engineering
Pre-Feasibility
Feasibility
Detailed
Engineering/Early Works
Permiting Critical Path: Permitting and the Environment Assessment (EA)
Environmental • The PFS assumes filing of the EIS Q3 2020 and completion of the EA
Assessment process (“Ministerial Approval”) mid-summer 2021
Environmental
Impact Statement
• Site-specific permitting (“Sectoral Permitting”) is scheduled to begin
thereafter
Sectoral Permitting
• The PFS contemplates construction commencing Jan 1, 2022 and 18
months of mine construction. First gold pour mid-2023
Construction
Execution Strategy: Combined Owner’s Team and EPC Contractor
Operations
Notes:
1. The reader is cautioned that the timeframes contained within the PFS have been estimated without consideration of potential impacts from the ongoing COVID-19 challenges, such as disruption to supply
chains, labour markets, work practices and permitting, amongst other factors. 26Valentine Gold Project
Pre-Feasibility Study
2020 Exploration: Focus on Sprite Corridor April 6, 2020
SW 300ppb Grade Shell on January NE
2020 Mineral Resource Pit Shells
Drilling Completed as of
March 14, 2020 Marathon Deposit
Open at Depth
Marathon Open
to SW
Leprechaun Deposit
“Berry Zone”
Sprite Deposit
Marathon
Deposit
Berry
Zone Footwall
• 44,000m and C$8.9M approved for 2020 Exploration Zone 1
• Focus on new discovery and future Mineral Resources Leprechaun
• Prioritizing 6km long “Sprite Corridor” between Leprechaun and Marathon Deposits Deposit Footwall
Zone 2
• Will include systematic drill program in footwall sediments for the first time
27Selected Intersections,
Sprite Corridor, Press
Releases Dated Dec.18,
Sprite Corridor 2019, Feb. 3, 2020 &
Mar 2, 2020
Quality Assurance-Quality Control (“QA/QC”) protocols followed at the Valentine Gold Project include the insertion of blanks and standards at regular intervals in each sample batch. Drill core is cut in half with
one half retained at site, the other half tagged and sent to Eastern Analytical Limited in Springdale, Newfoundland. All reported core samples are analyzed for Au by fire assay (30g) with AA finish. All samples
above 0.10 g/t Au in economically interesting intervals are further assayed using metallic screen to mitigate the presence of coarse gold. Significant mineralized intervals are reported in Table 1 as core lengths 28
and estimated true thickness (85% - 95% of core length).Selected Intersections,
Sprite Corridor, Press
Releases Dated Dec.18,
Sprite Corridor 2019, Feb. 3, 2020 &
Mar 2, 2020
VL-19-780 7.25 g/t Au over 10.0m
VL-19-776 10.43 g/t Au over 5.0m & 4.80 g/t Au over 6.0m
VL-19-777 1.54 g/t
Au over 16.0m
VL-19-789 1.67 g/t Au over 19.0m
VL-19-786 7.60 g/t
VL-19-765 6.17 g/t Au over 49m Au over 22.0m
VL-19-778 9.74 g/t Au
over 6.0m & 4.73 g/t
Au over 5.0m VL-20-801 3.92 g/t Au over 8.0m &
1.54 g/t Au over 9.0m
VL-19-779 3.82 g/t Au over VL-20-799 2.24 g/t Au
13.0m & 5.54 g/t Au over over 55.0m & 1.57
11.0m & 4.30 g/t Au over g/t Au over 15.0m
5.0 m
VL-19-769 1.63 g/t Au over
16.0m & 2.04 g/t Au over
9.0m & 4.33 g/t Au over
9.0m & 7.53 g/t Au over
5.0m & 2.30 g/t Au over
15.0m
Quality Assurance-Quality Control (“QA/QC”) protocols followed at the Valentine Gold Project include the insertion of blanks and standards at regular intervals in each sample batch. Drill core is cut in half with
one half retained at site, the other half tagged and sent to Eastern Analytical Limited in Springdale, Newfoundland. All reported core samples are analyzed for Au by fire assay (30g) with AA finish. All samples
above 0.10 g/t Au in economically interesting intervals are further assayed using metallic screen to mitigate the presence of coarse gold. Significant mineralized intervals are reported in Table 1 as core lengths 29
and estimated true thickness (85% - 95% of core length).Valentine Gold Project
Pre-Feasibility Study
Appendices April 6, 2020
Matt Manson / President & CEO
mmanson@marathon-gold.com / 416.987.0711
@MarathonGoldMOZ
Hannes Portmann / CFO & Business Development
hportmann@marathon-gold.com / 416.855.8200
TSX: MOZ www.marathon-gold.com
30January 2020 Mineral Resources by Type Notes on Estimation
1. The January 2020 Mineral Resource Estimate is based on a total database of over 270,000 m drilled
and 190,000 assays, approximately 25% of which have been processed by metallic screen Open Pit Underground Total
Tonnes Grade Oz Tonnes Grade Oz Tonnes Grade Oz
Category
2. Geological models were developed for each deposit and used to define several distinct mineralized (Mt) (g/t Au) (Moz Au) (Mt) (g/t Au) (Moz Au) (Mt) (g/t Au) (Moz Au)
domains. Search ellipsoids were determined for each domain by variography, and oriented such as to High Grade
be consistent with the shallowly dipping, stacked en-echelon Quartz-Tourmaline-Pyrite-Gold vein sets Measured 18.05 99% 2.79 -18% 1.62 63% 0.59 165% 4.40 -33% 0.08 79% 18.64 101% 2.84 -19% 1.70 63%
Indicated 12.58 -20% 2.38 -2% 0.96 -22% 0.71 20% 3.70 -20% 0.08 -3% 13.29 -19% 2.45 -3% 1.05 -21%
that are the dominant source of gold mineralization at the Project
Total M&I 30.63 23% 2.62 -6% 2.58 15% 1.30 60% 4.02 -22% 0.17 25% 31.93 24% 2.68 -7% 2.75 16%
Low Grade
3. Measured Resources were classified on the first pass of the estimation based on a maximum of 6
Measured 13.05 78% 0.47 -12% 0.20 56% - - - 13.05 78% 0.47 -12% 0.20 56%
composites and a minimum of 4 within 15m of the nearest neighbor (1.5 times average section Indicated 9.88 -18% 0.46 -8% 0.15 -25% - - - 9.88 -18% 0.46 -8% 0.15 -25%
spacing). Indicated Mineral Resources were classified on pass 1 or 2 of the estimation based on a Total M&I 22.92 18% 0.47 -10% 0.34 7% - - - 22.92 18% 0.47 -10% 0.34 7%
maximum of 6 composites and a minimum of 3 within 25m of the nearest neighbor (2.5 times average Total M&I
section spacing). Inferred Mineral Resources were classified on pass 1, 2 or 3 of the estimation based Measured 31.10 90% 1.81 -15% 1.81 62% 0.59 165% 4.40 -33% 0.08 79% 31.69 91% 1.86 -15% 1.90 63%
on a maximum of 6 composites and a minimum of 2 within the full ellipsoid search area Indicated 22.46 -20% 1.54 -4% 1.11 -23% 0.71 20% 3.70 -20% 0.08 -3% 23.17 -19% 1.60 -4% 1.19 -22%
Total M&I 53.56 21% 1.70 -5% 2.92 14% 1.30 60% 4.02 -22% 0.17 25% 54.85 22% 1.75 -5% 3.09 15%
4. Grade caps were determined for each mineralized domain using cumulative frequency (“lognormal”) Changes from the the October 2018 shown in italics. Totals may not add due to rounding
probability analysis. All Domains employ spatial restriction of high grade assays above the cap hard
capping of potential high-grade outliers Open Pit Underground Total
Tonnes Grade Oz Tonnes Grade Oz Tonnes Grade Oz
Category
(Mt) (g/t Au) (Moz Au) (Mt) (g/t Au) (Moz Au) (Mt) (g/t Au) (Moz Au)
Minimum Maximum Average Average Average Block Block High Grade
Outlier
Sample Sample Sample 1m Block Model Model Cap Threshold
Domain Samples Hard Cap Inferred 7.67 -35% 2.31 -14% 0.57 -44% 2.28 -6% 3.90 1% 0.29 -5% 9.95 -30% 2.68
###### -7% 0.86 -35%
Grade Grade Grade Composite Model Standard Coeff. of (g/t Au) Restriction
(g/t Au)
(g/t Au) (g/t Au) (g/t Au) Grade Grade Deviation Variance Low Grade
Marathon Deposit Inferred 6.81 -46% 0.46 -11% 0.10 -52% - - - 6.81 -46% 0.46
###### -11% 0.10 -52%
QTPV 40,512 0.01 1313.71 1.28 1.18 0.83 2.1 2.5 45.0 13x15x2.7m 150.0 Total Inferred
MD 2,213 0.01 63.57 0.38 0.28 0.13 0.4 3.3 5.5 10x5x5m 17.0
QEPOR 19,367 0.01 3.52 0.06 0.05 0.04 0.04 1.0 1.5 24.6x21.3x2m 2.1 Inferred 14.48 -41% 1.44 -8% 0.67 -45% 2.28 -6% 3.90 1% 0.29 -5% 16.77 -38% 1.78 0% 0.96 -37%
Domain Legend. QTPV "Quartz-Tourmaline-Pyrite Vein" (Main Zone), MD: "Mafic Dyke", QEPOR: "Quartz Eye Porphyry" (Hangingwall) Changes from the October 2018 Estimate shown in italics. Totals may not add due to rounding
Leprechaun Deposit
QTPV 21,217 0.01 375.78 1.75 1.39 0.83 2.1 2.6 52.0 10x5x5m 115.0
MD 1,809 0.01 82.43 0.74 0.54 0.25 0.8 3.1 11.0 20x10x5m 20.0
SED 560 0.01 27.64 1.02 0.67 0.36 0.9 2.4 10.0 10x20x2m 13.0
TRJ 5,635 0.01 43.70 0.09 0.07 0.04 0.0 1.2 1.5 15x10x2m 1.5
Domain Legend. QTPV "Quartz-Tourmaline-Pyrite Vein" (Main Zone), MD: "Mafic Dyke", SED: "Sediments" (Footwall), TRJ: "Trondhjemite" (Hangingwall)
Mineral Resources which are not Mineral Reserves do not have demonstrated economic viability. The estimate of mineral resources may be materially affected by environmental, permitting, legal, title, socio-
political, marketing, or other relevant issues including risks set forth in in Marathon’s Annual Information Form for the year ended December 31, 2019 and other filings made with Canadian securities regulatory
authorities and available at www.sedar.com. Please refer to Marathon Press Release Dated January 20, 2020 for details relating to the Valentine Gold Project Mineral Resource Update 31
See Notes on Slides 15 and www.marathon-gold.comNote on Historical Disclosure of Mineral Resources at the
Valentine Gold Project
Technical Report Dated December 2010: Technical Report Dated February 2017:
Measured Mineral Resources of 2.1 Mt at 2.77 g/t Au for 0.19 Moz Au; Indicated Measured Mineral Resources of 5.3 Mt at 1.97 g/t Au for 0.34 Moz; Indicated Mineral
Mineral Resources of 1.2 Mt at 2.36 g/t Au for 0.09 Moz Au; Inferred Mineral Resources of 17.3 Mt at 1.90 g/t Au for 1.05 Moz Au; Inferred Mineral Resources of 10.7 Mt at
Resources of 4.4 Mt at 2.01 g/t Au for 0.28 Moz Au. 2.24 g/t Au for 0.77 Moz Au.
Technical Report Dated October 2012: Technical Report Dated November 2017:
Measured Mineral Resources of 3.0 Mt at 2.30 g/t Au for 0.22 Moz Au; Indicated Measured Mineral Resources of 13.5 Mt at 2.14 g/t Au for 0.93 Moz Au; Indicated Mineral
Mineral Resources of 6.5 Mt at 2.19 g/t Au for 0.46 Moz Au; Inferred Mineral Resources of 17.0 Mt at 1.68 g/t Au for 0.92 Moz Au; Inferred Mineral Resources of 19.0 Mt at
Resources of 2.0 Mt at 2.30 g/t Au for 0.14 Moz Au. 1.65 g/t Au for 1.01 Moz Au.
Technical Report Dated June 2013 Valentine Hill East: Technical Report Dated May 2018:
Indicated Mineral Resources of 0.8 Mt at 1.67 g/t Au for 0.04 Moz Au; Inferred Mineral Measured Mineral Resources of 13.9 Mt at 2.25 g/t Au for 1.00 Moz Au; Indicated Mineral
Resources of 0.20 Mt at 1.47 g/t Au for 0.09 Moz Au. Resources of 19.5 Mt at 1.81 g/t Au for 1.13 Moz Au; Inferred Mineral Resources of 17.3 Mt at
1.99 g/t Au for 1.10 Moz Au.
Technical Report Dated August 2013:
Leprechaun Deposit: Measured Mineral Resources of 3.6 Mt at 2.26 g/t Au for 0.26 Technical Report Dated October 2018:
Moz Au; Indicated Mineral Resources of 7.0 Mt at 2.29 g/t Au for 0.51 Moz Au; Measured Mineral Resources of 16.6 Mt at 2.18 g/t Au for 1.17 Moz Au; Indicated Mineral
Inferred Mineral Resources of 1.56 Mt at 2.79 g/t Au for 0.14 Moz Au. Valentine Hill Resources of 28.5 Mt at 1.66 g/t Au for 1.53 Moz Au; Inferred Mineral Resources 26.9 Mt at
East: Indicated Mineral Resources of 0.8 Mt at 1.67 g/t Au for 0.04 Moz Au; Inferred 1.77 g/t Au for 1.53 Moz Au.
Mineral Resources of 0.2 Mt at 1.47 g/t Au for 0.09 Moz Au.
Technical Report Dated April 2015:
Measured Mineral Resources of 3.6 Mt at 2.26 g/t Au for 0.26 Moz Au; Indicated
Mineral Resources of 11.4 Mt at 2.18 g/t Au for 0.80 Moz Au; Inferred Mineral
Resources of 2.2 Mt at 2.85 g/t Au for 0.20 Moz Au.
Mineral Resources which are not Mineral Reserves do not have demonstrated economic viability. The estimate of mineral resources may be materially affected by environmental, permitting, legal, title, socio-
political, marketing, or other relevant issues including risks set forth in in Marathon’s Annual Information Form for the year ended December 31, 2019 and other filings made with Canadian securities regulatory
authorities and available at www.sedar.com. Please refer to Marathon Press Release Dated January 20, 2020 for details relating to the Valentine Gold Project Mineral Resource Update 32
See Notes on Slides 15 and www.marathon-gold.comYou can also read