INVESTOR PRESENTATION I JANUARY 2021 - Par Pacific
←
→
Page content transcription
If your browser does not render page correctly, please read the page content below
INVESTOR PRESENTATION I JANUARY 2021

Forward-Looking Statements / Disclaimers
The information contained in this presentation has been prepared to assist you in making your own evaluation of the company and does not purport to contain all of the information you may consider important. Any estimates or
projections with respect to future performance have been provided to assist you in your evaluation but should not be relied upon as an accurate representation of future results. Certain statements, estimates and financial information
contained in this presentation constitute forward-looking statements.

Such forward-looking statements involve known and unknown risks and uncertainties that could cause actual events or results to differ materially from the results implied or expressed in such forward-looking statements. While
presented with numerical specificity, certain forward-looking statements are based (1) upon assumptions that are inherently subject to significant business, economic, regulatory, environmental, seasonal and competitive
uncertainties, contingencies and risks including, without limitation, our ability to maintain adequate liquidity, our ability to realize the potential benefit of our net operating loss tax carryforwards, our ability to obtain sufficient debt
and equity financings, our capital costs, well production performance, and operating costs, anticipated commodity pricing, differentials or crack spreads, anticipated or projected pricing information related to oil, NGLs, and natural gas, our
ability to realize the potential benefits of our supply and offtake agreements, assumptions related to our investment in Laramie Energy, LLC, including completion activity and projected capital contributions, Laramie Energy, LLC’s financial
and operational performance and plans, including estimated production growth and Adjusted EBITDAX, our ability to meet environmental and regulatory requirements, our ability to increase refinery throughput and profitability, estimated
production, our ability to evaluate and pursue strategic and growth opportunities, our estimates of anticipated Adjusted EBITDA, Adjusted Net income per share, and Adjusted earnings per share, the amount and scope of anticipated capital
expenditures and turnaround activities, Washington renewable fuels project, other maintenance and growth capital projects, anticipated 10 year and next 12 months turnaround schedule and expenditures, including costs, timing, and
benefits, anticipated throughput, production costs, on-island and export sales expectations in Hawaii, anticipated throughput and distillate yield expectations in Wyoming, our estimates related to the annual gross margin impact of changes
in RINs prices, the ability of our refinery in Wyoming to provide supply in the Northwest region, estimates related to the impact of COVID-19 on our business, results of operations, financial position, and liquidity, as well as our expectations
related to our reduction in capital and operating expenditures and the idling of certain refining units at our Par West facility in Kapolei, Hawaii, expectations regarding Par Pacific’s posted market indices and the other metrics we utilize,
(including free cash flow, Adjusted EBITDA, Adjusted Net income per share, and Adjusted earnings per share), and other known and unknown risks (all of which are difficult to predict and many of which are beyond the company's control),
some of which are further discussed in the company’s periodic and other filings with the SEC and (2) upon assumptions with respect to future business decisions that are subject to change.

There can be no assurance that the results implied or expressed in such forward-looking statements or the underlying assumptions will be realized and that actual results of operations or future events will not be materially different from the
results implied or expressed in such forward-looking statements. Under no circumstances should the inclusion of the forward-looking statements be regarded as a representation, undertaking, warranty or prediction by the company or any
other person with respect to the accuracy thereof or the accuracy of the underlying assumptions, or that the company will achieve or is likely to achieve any particular results. The forward-looking statements are made as of the date
hereof and the company disclaims any intent or obligation to update publicly or to revise any of the forward-looking statements, whether as a result of new information, future events or otherwise, except as may be required by
applicable law. Recipients are cautioned that forward-looking statements are not guarantees of future performance and, accordingly, recipients are expressly cautioned not to put undue reliance on forward-looking statements due to the
inherent uncertainty therein.

This presentation contains non-GAAP financial measures, such as Adjusted EBITDA, Adjusted Net Income (loss), and Laramie Energy Adjusted EBITDAX. Please see the Appendix for the definitions and reconciliations to GAAP of the non-
GAAP financial measures that are based on reconcilable historical information.

                                                                                                                         1
Company Highlights

•   Owner & operator of essential energy infrastructure in PADD IV and V
    markets
•   208,000 bpd petroleum refining capacity
•   Multimodal integrated logistics network with 9 MMbbls of storage, and
    marine, rail and pipeline assets
•   Recently completed logistics system in Tacoma includes unit train and
    terminalling capabilities for renewable fuels and feedstocks
•   124 fuel retail locations in Hawaii and the Pacific Northwest
•   46% ownership interest in Laramie Energy, a natural gas E&P company
•   $1.4 billion in federal tax attributes as of December 31, 2019

    Disciplined Focus on Increasing Adjusted EPS and Free Cash Flow

                                                             2
Integrated Downstream Network

                                                                   Seattle
                                                  WA REFINERY
                                                                     WA Spokane           33

                                                                                                            MT
                                                                Portland                                                                     ND
                                                                                                                 Billings
HI REFINERIES
                                                                  OR
                                                                                  Boise
                                                                                               ID                             WY REFINERY
                91              HI                                                                                                            SD
                                                                                                                                      Rapid City
                                                                                                                 WY

                                                                                                             Cheyenne
                                                                                                                                                   NE
                                                                             NV            Salt Lake City

           Refinery            Retail Locations                                                                             Denver
                                                                                                    UT
                                                                                                                       CO
           Refined Products Inflows / Outflows

          Renewable Fuels Inflows / Outflows                                 Las Vegas

                       Diversified portfolio of downstream systems in high-growth markets

                                                                                  3
Refining Overview
    Refining Segment Highlights                                                                                Refinery Crude Capacity    Mbpd

                                                                                                               Par Hawaii East              94
    •    Focus on process safety, environmental
         compliance and operational reliability                                                                Par Hawaii West 1            54

    •    208,000 bpd petroleum refining capacity                                                               Washington                   42
                                                                                                               Wyoming                      18
    •    Distillate-oriented yield profile
                                                                                                               Par Pacific System          208
    •    Throughput and yield optimized to serve local
         market needs
                                                                                                                                         42% Distillates

                                                                                                                9% Other
                                                                                                                Products

                                                         LTM Q3-20 Combined Product Yield
                                                                                                                7% Asphalt
                                                                                                                                                 27% Gasoline

1As of March 24, 2020, certain refining units at Par West have been idled in response to reduced refined
product demand in Hawaii resulting from COVID-19.
                                                                                                           4                 15% LSFO
Multimodal Logistics System
Western
Canada
11 Kauai
Seattle
WA REFINERY
Oahu
WA Spokane 33
HI REFINERIES Molokai Bakken
Maui
Portland MT ND
Global Crude 61
7
Sourcing
Billings
OR
Boise
Hawaii ID
PRB SD
Rapid City
12
WY REFINERY
Asset Detail WY
Hawaii (1) Wyoming Washington Par Pacific
Storage Capacity (MMBbls) 5.4 0.7 2.9 9.0 Cheyenne
NE
NV Salt Lake City
Marine Assets (2) 2 - 1 3
Denver
Miles of Pipeline 27 138 14 179 UT
CO
Rail Facility ✓ ✓ 2
Marine Terminal ✓ ✓ 2
Las Vegas
Renewables System ✓ 1
Truck Rack ✓ ✓ ✓ 3
Refinery Retail Locations Renewables
Diverse logistics assets enable flexibility and development
of integrated downstream system Trucks Rail Barge Movements
1 Owned storage capacity. Crude Inflows Refined Products Inflows/Outflows
2 Leased marine barges and ships. 5
Renewable Fuels Inflows/Outflows
Crude Sourcing
    Q3-20 YTD Inland vs. Waterborne Crude Exposure                                    WCS and Bakken (Clearbrook) Diffs
                                                                        $/bbl
                                                8% Powder
                                                River Basin
     39% Other
    Waterborne

                                                      27% Bakken

         15% ANS

                                     11% Cold Lake

                   Inland exposure      Waterborne exposure

•     Access to discounted Western Canadian, Powder River                              $/bbl                            WCS - WTI                      Bakken ( Clearbrook) - WTI
                                                                                      Q4 2020                            $(11.43)                                $(2.03)
      Basin, and Bakken crudes                                                    12-Mo Future Avg                       $(14.35)                                $(2.05)

                                                                                Source: CME & Platts historical data, CalRock forward data (avg. forward prices from 12/2/20 to 12/29/20).
                                                                                12-month future averages reflect Jan-21 to Dec-21 forward data.

                                                                    6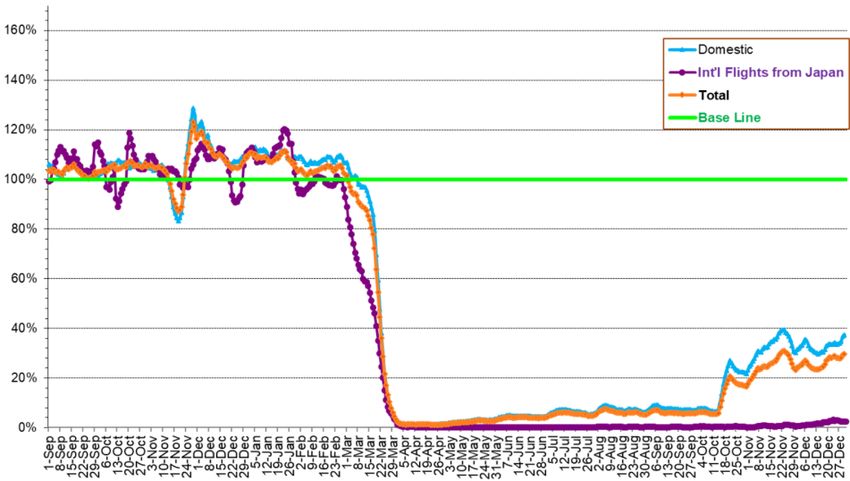
Retail Highlights
• 124 fuel retail locations branded 76 and Hele in Hawaii and                                                                                                                 Retail Adjusted EBITDA
  ‘nomnom’ in Northwest U.S.
• Hele acclaimed as leading Hawaii brand 1 after 2017 launch                                                                                                                                 25%+ CAGR
• Northwest US store conversion to ‘nomnom’ to be completed                                                                                                                                                                                      $64
                                                                                                                                                                                                                    $59
  by Feb 2021
• 67 company-operated convenience stores branded ‘nomnom’                                                                                                                              $46

• High market share in each region
• 25%+ annual EBITDA growth rate from 2017 to 2020                                                                                                       $31

                                                                                                                                                        2017                          2018                          2019                       LTM Q3-20

                                                                                                                                                                                               Adj. EBITDA ($MM)

1. Named Hawaii’s best gas station in 2019-2020 by Star Advertiser, Best Gas Station / Convenience store in 2020 by Honolulu Magazine, Best Gas Station by KITV-4 Island News, National 2019 Top 15 Fuel and Convenience Brand by Gas Buddy.

                                                                                                                         7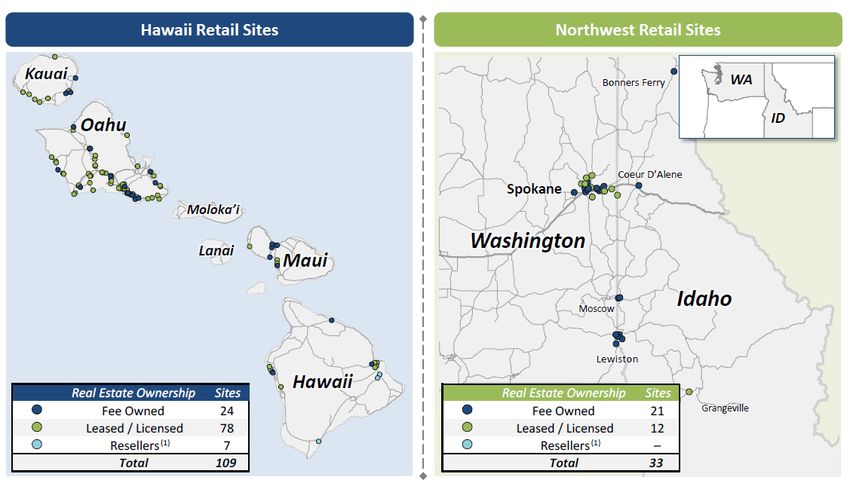
Leading Retail Position in Attractive Markets

Hawaii Retail
• 91 locations across four islands
• 34 company-operated convenience
  stores
• High real estate costs, scarcity of
  land, and logistics complexity
  strengthen competitive position

Northwest Retail
• 33 company-operated locations in
  Washington and Idaho
• Attractive fuel supply opportunities
  to enhance margins
• Enhancing merchandising
  assortment and food offering in
  conjunction with rebranding

1. Reseller and dealer fuel locations are not included in Retail segment profits.

                                                                                    8
Retail Growth Story

       2013 – 2015                  2016 – Early 2018                         Early 2018 – 2020                         2021
                                        Transition to                            Expansion into                 Additional Growth
Establish Hawaii Platform
                                      New Retail Brands                         Pacific Northwest                 Opportunities
• Acquisition of downstream       • Successfully launched two              • Acquisition of 33 Cenex/Zip    • Conversion of Northwest US
  assets from Tesoro, including     brands in Hawaii – highly                Trip branded retail sites in     locations to ‘nomnom’ brand
  31 retail sites                   recognized in marketplace                Washington and Idaho
                                    today                                                                   • Leverage brand to expand
• Expanded footprint with 59                                               • Beginning roll-out of            merchandise offering
  fuel retail sites upon          • Hele (43 sites) – a proprietary,         expanded food service
  acquisition of Mid-Pac            local value-oriented fuel brand          concept in Northwest stores    • Conversion opens fuel supply
  Petroleum                                                                  to drive traffic                 optionality and enhances fuel
                                  • ‘nomnom’ (34 sites) – a                                                   margins
                                    c-store brand known for                • Exploring fuel and store
                                    convenience and cleanliness              rebranding opportunity         • Developing store expansion
                                                                                                              strategy for existing Hawaii
                                                                                                              locations

                                                                       9
Financial Metrics
Full Year Full Year Full Year LTM Q3
As of Sep 30, 2020
2017 2018 2019 1 2020 1
Adjusted EBITDA ($ millions)
Share Price 2 $13.38
Refining $114 $92 $167 $(50)
Logistics 40 40 76 69
Enterprise Value 2 $1,330
Retail 31 46 59 64
Corporate & Other (44) (46) (44) (42) Net Debt $608
Adjusted EBITDA $141 $132 $259 $40
Diluted Adjusted Net Income Liquidity $191
$1.37 $1.06 $1.77 $(2.27)
(Loss) per Share
1 2019 and 2020 results include contribution from the Washington Refinery Acquisition, which closed on January 11, 2019. Totals may not foot due to rounding.
2 Equity value of approximately $722 MM reflects share price of $13.38 and outstanding share count of approximately 54.0 MM as of December 28, 2020.
10Strong Contribution from Retail and Logistics Segments
Trending Retail & Logistics Adj. EBITDA ($MM)
Logistics Retail
Totals may not foot due to rounding.
11Par Pacific Cost Initiatives
2020
• On-track to achieve cost savings in response to COVID-19
• 2020 savings include $50 million in refining and logistics
operating expense1 based on Q2/Q3 annualized run-rate
2021
• Estimated $45 million in additional cost savings opportunities
to be realized in 2021
• Washington turnaround scope reduced to $5-10 million in Q1
2021
1 Certain direct operating expenses related to our logistics segment are included within Cost of revenues on our consolidated statement of operations.
12Capital Expenditure and Turnaround Summary
Majority of
turnaround cycle
completed in 2020
$95-115
$94
$10 $46-52
$48 $55
$12-19
$35-45
$32 $19 $5-10
$6
$37-44
$29 $29 $30-35
$25
2017 2018 2019 2020 Revised Outlook 2021 Outlook
Maintenance, Regulatory, and IT Growth Turnaround
13Turnaround Schedule
Q3-19 Q4-20
Par West Wyoming
Turnaround Turnaround
$10 MM $15 MM
6-7 year cycle 4-5 year cycle
No anticipated major turnarounds
2019 2020 2021 2022 2023 2024 2025
Q3-20 Q1-21 Q1-22
Par East Washington Washington
Turnaround Turnaround Phase I Turnaround Phase II
$35 MM $5-10 MM
3-4 year cycle
3-4 year cycle
Our 10 year estimated turnaround outlay is $180-200 million
14Corporate Structure
$49 MM 5% Convertible
Notes due 6/15/2021 Par Pacific Holdings Inc.
$43 MM L + 1.5% Term NYSE: PARR
Loan due 4/1/2024 1
ABL Revolver
due 12/21/2022 2
$300 MM 7.75% Senior Secured Notes
due 12/15/2025
$228 MM L + 6.75% Term
Par Petroleum, LLC
Loan B due 1/11/2026
$105 MM 12.875% Senior Secured Notes
due 1/15/2026
Hermes
Laramie Energy,
Supply and Offtake Par Hawaii Consolidated, LLC
Agreement Par Hawaii, LLC Par Tacoma, LLC LLC 3
Refining, LLC d/b/a Wyoming
46% Interest
Refining Company
Note: Chart omits certain intermediate subsidiaries between parent and operating subsidiaries for brevity, as well as certain immaterial debt obligations. Debt balances outstanding as of November 2, 2020, unless Intermediation
otherwise stated.
1 On March 29, 2019, Par Pacific Hawaii Property Company, LLC entered into a term loan agreement as borrower, with Bank of Hawaii as lender.
Agreement
2 $85 mm ABL Revolver with availability of $49 mm as of September 30, 2020. Co-borrowers are Par Petroleum, LLC, a Delaware limited liability company, Par Hawaii, LLC, a Delaware limited liability company, Hermes
Consolidated, LLC (d/b/a Wyoming Refining Company), a Delaware limited liability company, and Wyoming Pipeline Company LLC, a Wyoming limited liability company.
3 Laramie Energy has a $400 mm reserve based revolving credit facility with a borrowing base set at $201 mm as of September 30, 2020. Recourse limited to pledge of equity interest of Par Piceance Energy Equity, LLC.
15Appendix 16
Singapore 3.1.2 Crack Spread

                                                                                                                                                                                 5-Yr Average 1 = $8.62

                                          $12                                                                                                                                                                       Singapore 3.1.2 Crack
                                                                                                                                                                                                                    5-Yr Average
                                          $10
                                            $8
                                            $6
                                            $4
                                            $2
                                            $0
                                          ($2)
                                                          1Q 18             2Q 18             3Q 18             4Q 18             1Q 19              2Q 19             3Q 19     4Q 19      1Q 20     2Q 20        3Q 20       4Q 20
($/bbl)
Singapore 3.1.2 Crack                                      $10.93               $10.49        $11.39             $10.79             $9.15             $9.39            $12.41     $12.12     $8.11        -$0.14    $1.92       $2.63
Average Brent Price                                        $67.19               $74.92        $75.93             $68.60            $63.83            $68.47            $62.03     $62.42    $50.82        $33.39   $43.34      $45.26

Memo: Singapore 4.1.2.1 Crack                                $6.38               $6.42          $7.81              $8.23             $6.88             $6.22             $9.36     $4.34     $4.19        -$1.19    $0.70          $1.67

       1   Company calculation based on a rolling five-year quarterly average

       Singapore 3-1-2 Daily: computed by taking 1 part gasoline (RON 92) and 2 parts middle distillates (Sing Jet & Sing Gasoil) as created from a barrel of Brent Crude.
       Month (CMA): computed using all available pricing days for each marker.
       Quarter/Year: computed using calendar day weighted CMAs for each marker.

                                                                                                                                                    17
Wyoming 3.2.1 Crack Spread
5-Yr Average 1 = $20.68
$30 Wyoming 3.2.1 Crack
5-Yr Average
$25
$20
$15
$10
$5
$0
1Q 18 2Q 18 3Q 18 4Q 18 1Q 19 2Q 19 3Q 19 4Q 19 1Q 20 2Q 20 3Q 20 4Q 20
($/bbl)
Wyoming 3.2.1 Crack $15.65 $24.99 $26.25 $23.97 $15.09 $28.89 $27.32 $28.26 $15.86 $17.39 $19.63 $18.45
Average WTI Price $62.89 $67.91 $69.43 $59.34 $54.90 $59.91 $56.44 $56.87 $45.98 $28.00 $40.92 $42.70
1 Company calculation based on a rolling five-year quarterly average
Rapid City Daily: Computed by taking 2 parts gasoline and 1 part distillate (ULSD) as created from three barrels of West Texas Intermediate Crude (WTI).
Denver Daily: Computed by taking 2 parts gasoline and 1 part distillate (ULSD) as created from three barrels of WTI.
Wyoming 3-2-1 Daily: computed using a weighted average of 50% Rapid City and 50% Denver.
Month (CMA): computed using all available pricing days for each marker.
Quarter/Year: computed using calendar day weighted CMAs for each marker.
18Pacific Northwest 5.2.2.1 Crack Spread
5-Yr Average 1 = $14.15
$20 Pacific Northwest 5.2.2.1
5-Yr Average
$15
$10
$5
$0
1Q 18 2Q 18 3Q 18 4Q 18 1Q 19 2Q 19 3Q 19 4Q 19 1Q 20 2Q 20 3Q 20 4Q 20
($/bbl)
Pacific Northwest 5.2.2.1 $12.93 $16.34 $13.98 $15.88 $10.93 $17.14 $14.76 $16.58 $13.24 $11.92 $9.39 $11.26
Average ANS Price $67.66 $75.12 $75.83 $69.09 $64.15 $69.40 $63.63 $65.51 $52.27 $28.17 $43.11 $43.68
1 Company calculation based on a rolling five-year quarterly average.
Pacific Northwest 5-2-2-1 Daily: computed by taking 2 parts gasoline (PNW Suboctane), 2 parts middle distillates (PNW ULSD & PNW Jet), and 1 part fuel oil (SF 180 Waterborne) as created from a barrel of Alaskan North Slope Crude.
ANS price: calculated using the Argus ANS-Brent differential beginning in July 2017. Prior to July 2017, a blended Platts and Argus ANS-WTI differential was used.
Month (CMA): computed using all available pricing days for each marker.
Quarter/Year: computed using calendar day weighted CMAs for each marker.
19Hawaii Market Fundamentals Pre-COVID 19
Post-COVID 19 Demand Recovery 1 Petroleum Use 2
Mbpd 32% Air
Transportation
70
60 - 65 3% Commercial
60
50 - 55
9% Industrial
50 43
39
40
Total Production 25% Electric
30 Total Demand Power
20
27% Ground
10 Transportation
-
Distillate Other Products 4% Marine
Transportation
Passenger Count 7-Day Moving Average 2
(100% = passenger count is the same this year as it was last year on the same date)
Pre-COVID 19 Electricity
Production by Source 2, 3
13% Solar
62% Petroleum
12% Coal
5% Wind
3% Biomass
1% Geothermal
4% Other
1 Source:
2
Par Pacific internal estimates, assuming Par East throughput of 85 Mbpd. 20
Source: EIA and Department of Business, Economic Development and Tourism (“DBEDT”) as of Q3-20. Totals may not sum to 100% due to
rounding. Passenger count data can be found at http://dbedt.hawaii.gov/visitor/daily-passenger-counts/.
3 Includes EIA estimate for rooftop solar of 11%.Trended Capital Structure
Twelve Months Ended
12/31/2017 12/31/2018 12/31/2019 9/30/2020
Debt ($ millions)
7.75% Senior Secured Notes $300 $300 $300 $300
12.875% Senior Secured Notes - - - 105
Term Loan B - - 241 231
Other Loans - 1 45 50
Total Secured Debt 300 301 586 686
5% Convertible Note 115 115 49 49
Total Debt 415 416 635 735
Cash 118 75 126 127
Net Debt 297 341 509 608
LTM Adj. EBITDA 141 132 259 40
Net Debt to Adj. EBITDA 2.1 x 2.6 x 2.0 x 15.1 x
Total stockholders' equity $448 $512 $648 $380
Net debt to total capitalization 40% 40% 44% 62%
21Non-GAAP PV10 and PV20 Disclosures
Non-GAAP PV10 and PV20 Disclosure
PV10 and PV20 are considered non-GAAP financial measures under SEC regulations because they do not include the
effects of future income taxes, as is required in computing the standardized measure of discounted future net cash
flows. However, our PV10/PV20 and our standardized measure of discounted future net cash flows are equivalent as
we do not project to be taxable or pay cash income taxes based on our available tax assets and additional tax assets
generated in the development of reserves because the tax basis of our oil and gas properties and NOL carryforwards
exceeds the amount of discounted future net earnings. PV10/PV20 should not be considered a substitute for, or
superior to, measures prepared in accordance with U.S. generally accepted accounting principles. We believe that
PV10 and PV20 are important measures that can be used to evaluate the relative significance of our natural gas and
oil properties to other companies and that PV10 and PV20 are widely used by securities analysts and investors when
evaluating oil and gas companies. PV10 and PV20 are computed on the same basis as the standardized measure of
discounted future net cash flows but without deducting income taxes.
22Laramie Energy Reserves
Year End 2019 Reserves and PV10 Summary – 100% of Laramie Energy
NSAI RESERVE REPORT
SEC Price Deck and Parameters Assumed Strip Pricing
(3) (3)
Gas Oil NGL Total PV10 PV20 Gas Price ($/MMBTU) Condensate ($/BBL)
(1)
(BCF) (MMBBL) (MMBBL) (BCFE) ($MM) ($MM) Average Annual Price YE19 SEC YE19 NYMEX YE19 SEC YE19 NYMEX
PDP 518 2 12 601 $304 $217 2020 $2.04 $2.28 $55.85 $59.03
PDNP 0 0 0 0 $0 $0 2021 $2.04 $2.42 $55.85 $54.38
PUD (4) 48 0 2 60 $6 -$3 2022 $2.04 $2.42 $55.85 $52.09
Total Proved (1P) 566 2 14 661 310 213 2023 $2.04 $2.46 $55.85 $51.31
Thereafter $2.04 $2.49 $55.85 $51.44
NYMEX Price Deck and Parameters
Gas Oil NGL Total PV10 (2) PV20 (2)
(BCF) (MMBBL) (MMBBL) (BCFE) (1) ($MM) ($MM)
PDP 510 2 12 592 $266 $188
PDNP 0 0 0 0 $0 $0
PUD (4) 46 0 2 57 $3 -$5
Total Proved (1P) 556 2 13 648 $268 $182
Probable (5) 309 1 9 371 $30 -16
Total Proved + Probable (2P) 865 4 22 1,019 $298 $166
Note: Par Pacific Holdings owns 46.0% of Laramie Energy, LLC as of 12/31/2019
Reserve information based on year end 2019 reserve report of Netherland, Sewell & Associates, Inc.
1
NGLs and Oil converted to gas based on 6:1 ratio.
2
Based on NYMEX strip pricing as of December 31, 2019 held flat after five years and adjusted for location basis of ($0.449). See "Non-GAAP PV10 and PV20 Disclosure" for additional discussion.
3
Based on CIG SEC pricing as of December 31, 2019 adjusted for basis of $0.060. See "Non-GAAP PV10 and PV20 Disclosure" for additional discussion.
4
All PUD locations listed are based on SEC standards.
5
Laramie Energy, LLC internal reserves based on PV10 discounting.
23Laramie Energy Adjusted EBITDAX
Laramie Energy Net Income (Loss) Reconciliation to Adjusted EBITDAX (1) ($ in thousands)
Twelve Months Ended December 31, Nine Months Ended September 30,
2017 2018 2019 2019 2020
Net income (loss) 30,837 6,347 (380,474) (18,139) (26,418)
Commodity derivative loss (gains) (35,531) 13,571 1,193 (640) 2,866
Gain (loss) on settled derivative instruments (10,710) (9,509) (5,476) (6,163) 4,777
Interest expense 5,954 9,726 11,879 9,543 6,884
Non-cash preferred dividend 4,166 4,689 4,115 2,541 5,009
Depreciation, depletion, amortization, and accretion 52,091 68,961 85,189 64,953 30,379
Impairment loss - - 355,220 - -
Exploration and geological and geographical expense 421 351 330 246 218
Bonus accrual, net 105 554 (2,154) (1,041) 998
Equity based compensation expense 6,195 3,248 122 150 16
(Gain) / loss on disposal of assets (50) (809) 1,478 1,454 233
Pipeline deficiency accrual (254) (11) (1,162) (1,162) -
Abandoned property and expired acreage 1,937 4,019 3,536 1,236 400
Total Adjusted EBITDAX 55,159 101,137 73,796 52,978 25,362
(1) Laramie Adjusted EBITDAX is defined as net income (loss) excluding commodity derivative (gains)/losses, losses on settled derivative instruments, interest expense, non-cash
preferred dividends, depreciation, depletion, amortization, and accretion, impairment loss, exploration and geological and geographical expense, bonus (payment) accrual, net,
equity-based compensation expense, loss (gain) on disposal of assets, pipeline (payment) deficiency accrual, and expired acreage (non-cash). We believe Adjusted EBITDAX is a
useful supplemental financial measure to evaluate the economic and operational performance of exploration and production companies such as Laramie Energy. Adjusted
EBITDAX presented by other companies may not be comparable to our presentation as other companies may define these terms differently.
24Non-GAAP Financial Measures
Twelve Months Ended Consolidated Adjusted EBITDA and Adjusted Net Income Reconciliation (1)
($ in thousands) 2015 2016 2017 2018 2019 Q3 2020
Net income (loss) $ (39,911) $ (45,835) $ 72,621 $ 39,427 $ 40,809 $ (241,729)
Adjustments to Net Income (loss):
Inventory valuation adjustment 6,689 25,101 (1,461) (16,875) 11,938 4,016
LIFO liquidation inventory adjustment loss — — — — — 6,211
RINs loss (gain) in excess of net obligation — — — 4,544 (3,398) 17,626
Unrealized loss (gain) on derivatives 10,896 (12,034) (623) (1,497) 8,988 (1,042)
Acquisition and integration costs 2,006 5,294 395 10,319 4,704 979
Debt extinguishment and commitment costs 19,669 — 8,633 4,224 11,587 2,401
Changes in valuation allowance and other deferred tax
items (2) (16,759) (8,573) — (660) (68,792) (19,459)
Change in value of common stock warrants 3,664 (2,962) 1,674 (1,801) 3,199 (4,136)
Change in value of contingent consideration 18,450 (10,770) — 10,500 — —
Severance costs 637 105 1,595 — — 245
Impairments of Laramie Energy, LLC (3) 41,081 — — — 83,152 46,931
Par's share of Laramie Energy's unrealized loss (gain) on
derivatives 5,508 17,278 (19,568) 1,158 (1,969) 50
Impairment expense 9,639 — — — — 67,922
Adjusted Net Income (loss) (4) 61,569 (32,396) 63,266 49,339 90,218 (119,985)
Depreciation, depletion and amortization 19,918 31,617 45,989 52,642 86,121 87,250
Interest expense and financing costs, net 20,156 28,506 31,632 39,768 74,839 70,114
Equity losses (earnings) from Laramie Energy, LLC,
excluding Par's share of unrealized loss (gain) on
derivatives and impairment losses 9,394 5,103 1,199 (10,622) 8,568 4,834
Income tax expense (benefit) (29) 661 (1,319) 993 (897) (2,083)
Adjusted EBITDA $ 111,008 $ 33,491 $ 140,767 $ 132,120 $ 258,849 $ 40,130
_____________________________________________
(1) We believe Adjusted Net Income (Loss) and Adjusted EBITDA are useful supplemental financial measures that allow investors to assess: (1) The financial performance of our assets without regard to financing methods, capital structure or historical cost basis, (2) The ability of our
assets to generate cash to pay interest on our indebtedness, and (3) Our operating performance and return on invested capital as compared to other companies without regard to financing methods and capital structure. Adjusted Net Income (Loss) and Adjusted EBITDA should not
be considered in isolation or as a substitute for operating income (loss), net income (loss), cash flows provided by operating, investing and financing activities, or other income or cash flow statement data prepared in accordance with GAAP. Adjusted Net Income (Loss) and Adjusted
EBITDA presented by other companies may not be comparable to our presentation as other companies may define these terms differently. Beginning in the second quarter of 2020, Adjusted Net Income (Loss) and Adjusted EBITDA also includes the contango gains and
backwardation (losses) associated with our Washington inventory and intermediation obligation. Prior to the second quarter of 2020, contango gains and backwardation (losses) captured by our Washington intermediation agreement were excluded from Adjusted Net Income (as
part of the inventory valuation adjustment). This change in our presentation was made to reflect the favorable or unfavorable impact of the market structure on the profitability of our Washington refinery consistent with the presentation of such impacts on our other refineries.
Beginning in the third quarter of 2020, Adjusted Net Income (Loss) and Adjusted EBITDA exclude the LIFO layer liquidation impacts associated with our Washington inventory. We have recast the non-GAAP information for the year ended December 31, 2019 to conform to the
current presentation.
(2) Includes increases in (releases of) our valuation allowance associated with business combinations and changes in deferred tax assets and liabilities that are not offset by a change in the valuation allowance. These tax expenses (benefits) are included in Income tax benefit (expense)
on our condensed consolidated statements of operations.
(3) Included in Equity losses from Laramie Energy, LLC on our condensed consolidated statements of operations.
25
(4) For the periods presented herein, there was no (gain) loss on sale of assets.Non-GAAP Financial Measures
Consolidated Adjusted EBITDA by Segment Reconciliation (1)
For the twelve months ended September 30, 2020
($ in thousands)
Corporate and
Refining Logistics Retail Other
Operating income (loss) $ (167,453) $ 48,238 $ 22,849 $ (47,969)
Adjustments to operating income (loss):
Unrealized loss (gain) on derivatives (1,042) — — —
Acquisition and integration costs — — — 979
Inventory valuation adjustment 4,016 — — —
LIFO liquidation inventory adjustment loss 6,211 — — —
RINs loss in excess of net obligation 17,626 — — —
Depreciation, depletion and amortization 52,462 20,416 10,898 3,474
Severance costs 88 — — 157
Impairment expense 38,105 — 29,817 —
Other income/expense — — — 1,258
Adjusted EBITDA $ (49,987) $ 68,654 $ 63,564 $ (42,101)
_____________________________________________
(1) Adjusted EBITDA by segment is defined as operating income (loss) by segment excluding unrealized (gains) losses on derivatives, inventory
valuation adjustment, acquisition and integration costs, severance costs, RINs loss (gain) in excess of net obligation, impairment expense,
depreciation, depletion and amortization expense, and other income/expense. We believe Adjusted EBITDA by segment is a useful supplemental
financial measure to evaluate the economic performance of our segments without regard to financing methods, capital structure or historical cost
basis. Adjusted EBITDA by segment presented by other companies may not be comparable to our presentation as other companies may define
these terms differently. Adjusted EBITDA for the Corporate and Other segment also includes Other income, net, which is presented below
operating income (loss) on our consolidated statements of operations. Beginning in the second quarter of 2020, Adjusted EBITDA also includes the
contango gains and backwardation (losses) associated with our Washington inventory and intermediation obligation. Prior to the second quarter
of 2020, contango gains and backwardation (losses) captured by our Washington intermediation agreement were excluded from Adjusted EBITDA
(as part of the inventory valuation adjustment). This change in our presentation was made to reflect the favorable or unfavorable impact of the
market structure on the profitability of our Washington Refinery consistent with the presentation of such impacts on our other refiners. Beginning
in the third quarter of 2020, Adjusted EBITDA by segment excludes the LIFO layer liquidation impacts associated with our Washington inventory.
We have recast the non-GAAP information for the twelve months ended December 31, 2019 to conform to the current period presentation.
26Non-GAAP Financial Measures
Consolidated Adjusted EBITDA by Segment Reconciliation (1)
For the twelve months ended December 31, 2019
($ in thousands)
Corporate and
Refining Logistics Retail Other
Operating income (loss) $ 93,781 $ 59,075 $ 49,245 $ (54,121)
Adjustments to operating income (loss):
Depreciation, depletion and amortization 55,832 17,017 10,035 3,237
Inventory valuation adjustment 11,938 — — —
RINs loss in excess of net obligation (3,398) — — —
Unrealized loss (gain) on derivatives 8,988 — — —
Acquisition and integration costs — — — 4,704
Other income/expense — — — 2,516
Adjusted EBITDA $ 167,141 $ 76,092 $ 59,280 $ (43,664)
_____________________________________________
(1) Please read slide 26 for the definition of Adjusted EBITDA by segment used herein.
27Non-GAAP Financial Measures
Consolidated Adjusted EBITDA by Segment Reconciliation (1)
For the twelve months ended December 31, 2018
($ in thousands)
Corporate and
Refining Logistics Retail Other
Operating income (loss) $ 73,269 $ 33,389 $ 37,232 $ (61,949)
Adjustments to operating income (loss):
Depreciation, depletion and amortization 32,483 6,860 8,962 4,337
Inventory valuation adjustment (16,875) — — —
RINs loss in excess of net obligation 4,544 — — —
Unrealized loss (gain) on derivatives (1,497) — — —
Acquisition and integration costs — — — 10,319
Other income/expense — — — 1,046
Adjusted EBITDA $ 91,924 $ 40,249 $ 46,194 $ (46,247)
_____________________________________________
(1) Please read slide 26 for the definition of Adjusted EBITDA by segment used herein.
28Non-GAAP Financial Measures
Consolidated Adjusted EBITDA by Segment Reconciliation (1)
For the twelve months ended December 31, 2017
($ in thousands)
Corporate and
Refining Logistics Retail Other
Operating income (loss) $ 86,016 $ 33,993 $ 24,700 $ (50,748)
Adjustments to operating income (loss):
Depreciation, depletion and amortization 29,753 6,166 6,338 3,732
Inventory valuation adjustment (1,461) — — —
Unrealized loss (gain) on derivatives (623) — — —
Acquisition and integration costs — — — 395
Severance costs 395 — — 1,200
Other income/expense — — — 911
Adjusted EBITDA $ 114,080 $ 40,159 $ 31,038 $ (44,510)
_____________________________________________
(1) Please read slide 26 for the definition of Adjusted EBITDA by segment used herein.
29Non-GAAP Financial Measures
Consolidated Adjusted EBITDA by Segment Reconciliation (1)
For the twelve months ended December 31, 2016
($ in thousands)
Corporate and
Refining Logistics Retail Other
Operating income (loss) $ (10,934) $ 21,422 $ 22,194 $ (52,331)
Adjustments to operating income (loss):
Depreciation, depletion and amortization 17,565 4,679 6,372 3,001
Inventory valuation adjustment 29,056 — — (3,955)
RINs loss in excess of net obligation — — — —
Unrealized loss (gain) on derivatives (12,438) — — 404
Acquisition and integration costs — — — 5,294
Severance costs — — — 105
Gain on curtailment of pension obligation (2) — — — 3,067
Other income/expense — — — (10)
Adjusted EBITDA $ 23,249 $ 26,101 $ 28,566 $ (44,425)
_____________________________________________
(1) Please read slide 26 for the definition of Adjusted EBITDA by segment used herein.
(2) Line item has been added to the Adjusted EBITDA presentation as part of the adoption of ASU 2017-07, Compensation—Retirement Benefits (Topic
715): Improving the Presentation of Net Periodic Pension Cost and Net Periodic Postretirement Benefit Cost
30Non-GAAP Financial Measures
Consolidated Adjusted EBITDA by Segment Reconciliation (1)
For the twelve months ended December 31, 2015
($ in thousands)
Corporate and
Refining Logistics Retail Other
Operating income (loss) $ 66,756 $ 25,170 $ 27,149 $ (63,345)
Adjustments to operating income (loss):
Depreciation, depletion and amortization 9,522 3,117 5,421 1,858
Impairment expense — — — 9,639
Inventory valuation adjustment 5,178 — — 1,511
RINs loss in excess of net obligation — — — —
Unrealized loss (gain) on derivatives 10,284 — — 612
Acquisition and integration costs — — — 2,006
Severance costs — — — 637
Gain on curtailment of post-retirement medical
plan obligation (2) 4,884 280 431 —
Other income/expense — — — (102)
Adjusted EBITDA $ 96,624 $ 28,567 $ 33,001 $ (47,184)
_____________________________________________
(1) Please read slide 26 for the definition of Adjusted EBITDA by segment used herein.
(2) Line item has been added to the Adjusted EBITDA presentation as part of the adoption of ASU 2017-07, Compensation—Retirement Benefits (Topic
715): Improving the Presentation of Net Periodic Pension Cost and Net Periodic Postretirement Benefit Cost
31Non-GAAP Financial Measures
Retail Segment - Twelve Months Ended Adjusted Gross Margin Reconciliation (1)
($ in thousands)
2017 2018 2019 Q3 2020
Operating income $ 24,700 $ 37,232 $ 49,245 $ 22,849
Operating expense (excluding depreciation) 45,941 61,182 67,307 65,593
Depreciation, depletion and amortization 6,338 8,962 10,035 10,898
Impairment expense — — — 29,817
Adjusted Gross Margin $ 76,979 $ 107,376 $ 126,587 $ 129,157
_____________________________________________
(1) Adjusted Gross Margin by segment is defined as operating income (loss) by segment plus operating expense (excluding depreciation), impairment
expense and depreciation, depletion, and amortization (“DD&A”). We believe Adjusted Gross Margin by segment provides useful information to
investors because it eliminates the gross impact of volatile commodity prices and adjusts for certain non-cash items and timing differences created
by our inventory financing agreements and lower of cost or net realizable value adjustments to demonstrate the earnings potential of the business
before other fixed and variable costs, which are reported separately in Operating expense (excluding depreciation) and Depreciation, depletion,
and amortization. Adjusted Gross Margin by segment should not be considered an alternative to operating income (loss), cash flows from
operating activities, or any other measure of financial performance or liquidity presented in accordance with GAAP. Adjusted Gross Margin by
segment presented by other companies may not be comparable to our presentation since each company may define this term differently.
32Non-GAAP Financial Measures
Diluted Adjusted Net Income per Share for the Twelve Months Ended
(in thousands, except per share amounts)
2017 2018 2019 Q3 2020
Adjusted Net Income (Loss) $ 63,266 $ 49,339 $ 90,218 $ (119,985)
Undistributed Adjusted Net Income allocated to participating securities (1) 765 695 968 —
Adjusted Net Income attributable to common stockholders 62,501 48,644 89,250 (119,985)
Plus: effect of convertible securities — — 8,978 —
Numerator for diluted income per common share $ 62,501 $ 48,644 $ 98,228 $ (119,985)
Basic weighted-average common stock shares outstanding 45,543 45,726 50,352 52,821
Add dilutive effects of common stock equivalents (2) 40 29 5,240 —
Diluted weighted-average common stock shares outstanding 45,583 45,755 55,592 52,821
Basic Adjusted Net Income (Loss) per common share $ 1.37 $ 1.06 $ 1.77 $ (2.27)
Diluted Adjusted Net Income (Loss) per common share $ 1.37 $ 1.06 $ 1.77 $ (2.27)
_____________________________________________
(1) Participating securities include restricted stock that has been issued but had not yet vested. These shares vested during the year ended December 31, 2019.
(2) Entities with a net loss from continuing operations are prohibited from including potential common shares in the computation of diluted per share amounts.
We have utilized the basic shares outstanding to calculate both basic and diluted Adjusted Net Loss per common share for the twelve months ended
September 30, 2020.
33You can also read