TSX: BDT INDUSTRIAL ALLIANCE PRESENTATION MAY, 2021 - Bird Construction
←
→
Page content transcription
If your browser does not render page correctly, please read the page content below
Bird Construction Inc.

               TSX: BDT

 INDUSTRIAL ALLIANCE
PRESENTATION MAY, 2021
DISCLAIMER
This presentation contains forward-looking statements and information ("forward-looking statements") within the meaning of applicable Canadian securities laws. The forward-looking
statements contained in this presentation are based on the expectations, estimates and projections of management of Bird Construction Inc. (“Bird” or “The Company”) and Stuart
Olson Inc. (“Stuart Olson”) as of the date of this presentation unless otherwise stated. The use of any of the words "believe", "expect", "anticipate", "contemplate", "target", "plan",
"intends", "continue", "may", "will", "should" and similar expressions are intended to identify forward-looking statements. More particularly and without limitation, this presentation
contains forward-looking statements concerning: the anticipated benefits of the acquisition of Stuart Olson (the “Transaction”) to Bird and its shareholders, including anticipated
synergies; the plans and strategic priorities of the combined company

In respect of the forward-looking statements concerning the anticipated benefits of the Transaction; and expectations and assumptions concerning, among other things: customer
demand for the combined company's services and anticipated synergies, capital efficiencies and cost-savings.

Since forward-looking statements address future events and conditions, by their very nature they involve inherent risks and uncertainties. Actual results could differ materially from
those currently anticipated due to a number of factors and risks. These include, but are not limited to the risks associated with the industries in which Bird and Stuart Olson operate in
general such as: operational risks, industry and inherent project delivery risks; delays or changes in plans with respect to growth projects or capital expenditures; costs and expenses;
health, safety and environmental risks; commodity price, interest rate and exchange rate fluctuations; compliance with environmental laws risks; competition, ethics and reputational
risks; ability to access sufficient capital from internal and external sources; global pandemics; repayment of credit facility; collection of recognized revenue; performance bonds and
contract security; potential for non-payment and credit risk and ongoing financing availability; regional concentration; regulations; dependence on the public sector; client concentration;
labour matters; loss of key management; ability to hire and retain qualified and capable personnel; subcontractor performance; unanticipated shutdowns, work stoppages, strikes and
lockouts; maintaining safe worksites; cyber security risks; litigation risk; corporate guarantees and letters of credit; volatility of market trading; failure of clients to obtain required permits
and licenses; payment of dividends; economy and cyclicality; Public Private Partnerships project risk; design risks; completion and performance guarantees/design-build risks; ability to
secure work; estimating costs and schedules/assessing contract risks; quality assurance and quality control; accuracy of cost to complete estimates; insurance risk; adjustments and
cancellations of backlog; joint venture risk; internal and disclosure controls; Public Private Partnerships equity investments; failure to realize the anticipated benefits of the Transaction;
and changes in legislation, including but not limited to tax laws and environmental regulations.

The forward-looking statements in this presentation should not be interpreted as providing a full assessment or reflection of the unprecedented impacts of the recent COVID-19
pandemic ("COVID-19") and the resulting indirect global and regional economic impacts.

Readers are cautioned that the foregoing list of factors is not exhaustive. Additional information on other factors that could affect the operations or financial results of the parties, and
the combined company, including any risk factors related to COVID-19, are included in reports on file with applicable securities regulatory authorities, including but not limited to Bird's
Annual Information Form for the year ended December 31, 2020, which may be accessed on Bird's SEDAR profile, respectively, at www.sedar.com.

The forward-looking statements contained in this presentation are made as of the date hereof and the parties undertake no obligation to update publicly or revise any forward-looking
statements, whether as a result of new information, future events or otherwise, unless so required by applicable securities laws.

                                                                                                                                                                                                       2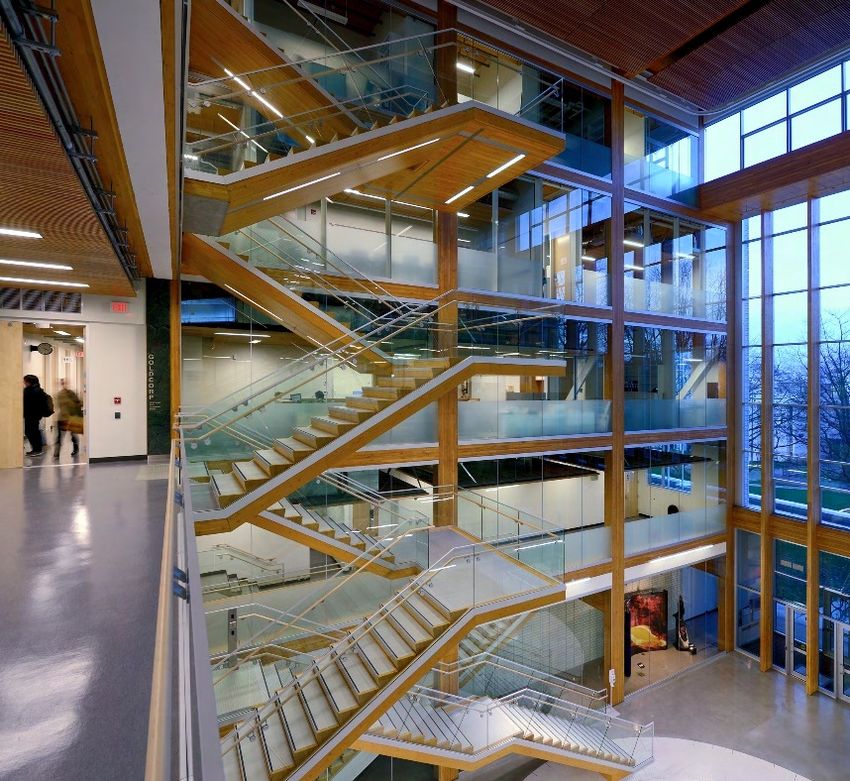
DISCLAIMER
TERMINOLOGY
Throughout this presentation, management uses the following terms that may not be comparable with similar terms presented by other companies and require definition:
"Backlog" (also referred to in the construction industry as "work on hand") is the total value of all contracts awarded to the Company, less the total value of work completed on these contracts
as of the date of the most recently completed quarter. This includes all contracts that have been awarded to the Company whether the work has commenced or will commence in the normal
course. It includes all the Company’s remaining performance obligations in its contracts with its clients, including work orders issued from MSAs related to MRO services. It does not include
amounts for variable consideration that are constrained, agency relationship construction management projects, and estimated future work orders to be performed as part of master services
agreements. The Company’s Backlog equates to the Company’s remaining performance obligations.
“Pending Backlog" is the total potential revenue of awarded but not contracted projects including where the Company has been named preferred proponent, where a contract has not been
executed and where the letter of intent or agreement received is non-binding. It may also include amounts for agency relationship construction management projects, pre-construction
activities and estimated future work orders to be performed as part of MSAs. Management does not provide any assurance that a contract will be finalized, or revenue recognized in the
future. Management uses Pending Backlog to assess the future operating performance of its business. Management believes that investors and analysts use this measure, as it may provide
predictive value to assess the ongoing operations of the business and a more consistent comparison between financial reporting periods. Pending Backlog cannot be reconciled to any IFRS
measure.
NON-GAAP MEASURES
Throughout this presentation, management uses the following terms which have no standardized meaning prescribed by GAAP and are considered non-GAAP measures. Therefore, these
terms may not be comparable with similar terms presented by other companies and require definition:
Management uses “Adjusted Earnings”, “Adjusted Earnings Per Share”, "Adjusted EBITDA”, and "Adjusted EBITDA Margin" to assess the operating performance of its business.
Management believes that if investors and analysts use “Adjusted Earnings”, and/or “Adjusted EBITDA”, it may provide predictive value to assess the on-going operations of the business
and it provides a more consistent comparison between financial reporting periods.
Management considers these to be important supplemental measures of the Company's performance and management believes these measures are frequently used by securities analysts,
investors and other interested parties in the evaluation of companies in industries with capital structures similar to that of the Company. These measures have been described and presented
in order to provide potential investors with additional information regarding the Company's liquidity and its ability to generate funds to finance its operations. Readers are encouraged to
review the Company's annual and most recent MD&A filed on SEDAR for a full discussion of the use of each measure.
MARKET DATA
Market data and other statistical information used throughout this presentation are based on internal company research, independent industry publications, government publications, reports
by market research firms or other published independent sources. Industry surveys, publications, consultant surveys and forecasts generally state that the information contained therein has
been obtained from sources believed to be reliable. Although the Company believes such information is accurate and reliable, the Company has not independently verified any of the data
from third-party sources cited or used for management's industry estimates, nor has the Company ascertained the underlying economic assumptions relied upon therein. While the Company
believes internal company estimates are reliable, such estimates have not been verified by any independent sources, and the Company does not make any representations as to the
accuracy of such estimates. Statements as to our position relative to our competitors or as to market share refer to the most recent available data.

CURRENCY
Unless otherwise indicated, all currency in this presentation is presented in Canadian dollars.                                                                                                3
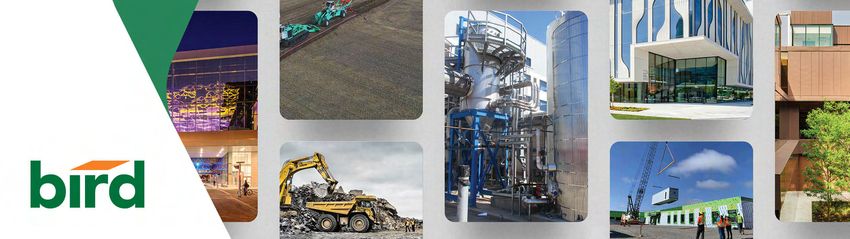
OVER 100 YEARS BUILDING CANADA

                                 4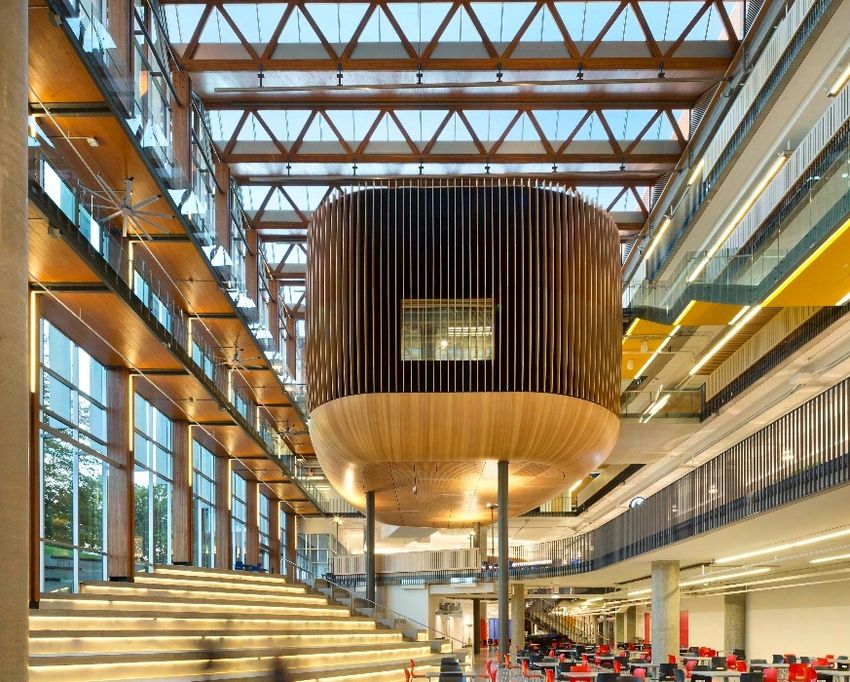
BIRD CONSTRUCTION (TSX:BDT)
                                 $1.5B                                       $41.6M                                             $81.9M                                                $2.7B                                    $511.8M
                            FULL-YEAR 2020                                FULL-YEAR 2020                                        FULL-YEAR 2020                                            BACKLOG                                    MARKET CAP
                               REVENUE                                  ADJUSTED EARNINGS                                      ADJUSTED EBITDA                                         March 31, 2021                                at May 25, 2021

                              91.4%                                               $0.39                                              +82%
                         2-YR SHAREHOLDER                                        ANNUALIZED                                       EMPLOYEES ARE                                           5,000+                                         NATIONAL
                         RETURN (Incl. Dividend)                                  DIVIDEND                                       SHAREHOLDERS(1)                                        EMPLOYEES                                        PRESENCE

                                                          BDT SHARE PRICE HISTORY

                                                                                                           52 WEEK RANGE
                                                                                                            $9.95            HIGH
                                                                                                            $5.69            LOW

Adjusted EBITDA and Adjusted EBITDA % are non-GAAP measures. “Adjusted EBITDA” represents earnings (loss) before taxes, interest, depreciation and amortization, finance and other costs, finance income, impairment of property and equipment, impairment
                                                                                                                                                                                                                                                                                 5
          of goodwill and intangible assets, loss or gain on sale of property and equipment, restructuring costs outside of normal course, and acquisition-related costs and integration costs. (1) Percentage of employee shareholders figure is pre-Stuart Olson acquisition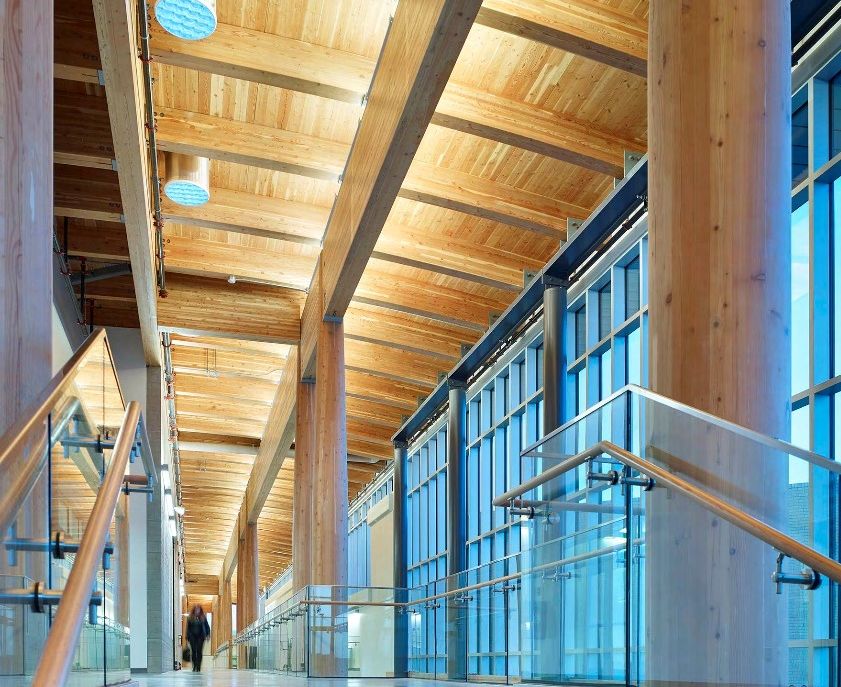
DIVERSE                         BUILDINGS     LIGHT INDUSTRIAL
                                                                           NATURAL
                                                                          RESOURCES
     EXPERTISE
Delivering solutions
from coast-to-coast,
serving a broad scope
of end-markets.
                                       MODULAR           POWER          TRANSPORTATION
Comprehensive range of
construction services from new
construction for industrial,
commercial, and institutional
markets; to industrial
maintenance, repair and
operations services, heavy civil
construction, and contract
surface mining; as well as                                                INDUSTRIAL
vertical infrastructure including,
                                     ENVIRONMENTAL      UTILITIES
                                                                         MAINTENANCE
electrical, mechanical, and
specialty trades.
                                                                                      6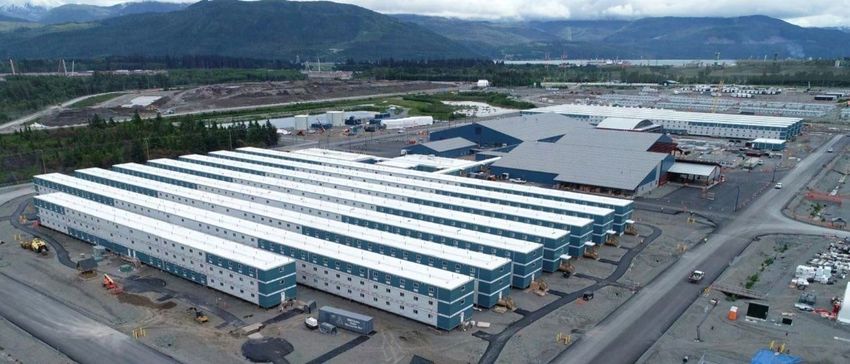
FULL-SUITE SERVICE OFFERING

DIVERSIFIED REVENUE STREAMS

  CONSTRUCTION              MAINTENANCE,                    DESIGN-BUILD               SELF-PERFORM                 PUBLIC PRIVATE
  MANAGEMENT                   REPAIR &                                                                           PARTNERSHIPS (PPP)
                           OPERATIONS (MRO)                  FIXED PRICE /
INTEGRATED PROJECT                                         STIPULATED SUM
   DELIVERY (IPD)
    COST PLUS             INDUSTRIAL SERVICE
                             AGREEMENTS

RISK SCALE

Reflecting its broad scope, Bird's clients include leading firms in the energy, mining, commercial, institutional, retail, multi-
tenant residential, industrial, water and wastewater, renewables, nuclear, and civil sectors. Bird generates consistent
diversified revenue streams through its enhanced service offerings across a multitude of markets and industries.

                                                                                                                                    7
CONSTRUCTING A STRONG FOUNDATION

         DRIVING SUPERIOR SHAREHOLDER VALUE CREATION
         • Balanced and disciplined approach to capital allocation

         TARGETING SUSTAINABLE PROFITABLE GROWTH
         • Managing risk profile through diversification
         • Recurring revenue focus
         • Consistent margin improvement
         ENVIRONMENTAL, SOCIAL, GOVERNANCE
         • Building value for communities through responsible and sustainable operations and
           building relationships with a client-first focus
         INNOVATION AND TECHNOLOGY VALUE
         • Technology solutions that drive efficiency, performance and safe, proactive worksites

         MERGERS AND ACQUISITIONS
         • Focus on Stuart Olson integration, maximizing value, and realizing synergies

         FOUNDATIONAL SUCCESS
         • Building our diverse team of experienced professionals, creating a high-performance,
           inclusive, and engaging culture
         • Strong balance sheet provides the Company the ability to build up

                                                                                                   8
DISCLAIMER
                                 STRONG TEAM OF CONSTRUCTORS
LEVERAGING OUR TALENTED      •   Executive leadership and operational leadership composed of experienced
LEADERSHIP TEAM                  professionals each with over 25 years in the industry

                             •   Building a high-performance culture centred on great people
DEEP BENCH STRENGTH AND
                             •   Competitive people programs and dynamic platform for career growth
RECRUITING FOR THE FUTURE

                             •   Bird employee management training program
ROBUST PEOPLE PROGRAMS       •   Field leadership and site management development programs
SUPPORTING CONTINUOUS        •   Eagles Flight Leadership training
LEARNING AND DEVELOPMENT     •   Highly-aligned workforce through employee share purchase program
                             •   Leveraging technology solutions to support the business, mitigate risk, and equip
CONTINUOUS IMPROVEMENT           employees with robust and effective tools, programs, and platforms
AND INNOVATION FOCUS         •   Regular and rigorous review of existing and future technology tools

                             •   Mandatory Indigenous Cultural Awareness Training Program
COMMITTED TO DIVERSITY AND   •   Progressive Aboriginal Relations certified - Canadian Council for Aboriginal Business
INCLUSION                    •   Inaugural member of the Aboriginal Procurement Champions Group
                             •   Employer Champion for National Strategy for Supporting Women in Trades

             foundational
                 success                                                                                             9
TRANSFORMATIONAL ACQUISITION

$95.7M                $1B             +$600M         +$900M
    TOTAL             BACKLOG          PENDING         REVENUE    110+ YRS IN CANADA
CONSIDERATION                          BACKLOG                      3,000 EMPLOYEES

INDUSTRY SAFETY         GREATER       TOP EMPLOYER    COMMUNITY   ENHANCED SERVICE
    LEADER          DIVERSIFICATION     IN ALBERTA     FOCUSED       OFFERINGS

      mergers &
     acquisitions                                                                    10
INTEGRATION SYNERGIES UPDATE
BIRD CLOSED ITS ACQUISITION OF STUART OLSON IN THE THIRD QUARTER OF 2020
REALIZATION OF SYNERGIES
$8 million of the stated $10.0 million in cost
synergies have been set in motion.
COST SAVINGS
Fully realized the remaining $15 million in
depreciation and amortization and interest
cost savings.
CAPTURING CROSS-SELLING
Strategic wins and enhanced service
offerings, including an overpass project for a
longstanding Industrial client, a $550 million+
MSA contract, increased self perform
capabilities, and technology solutions.
mergers &
acquisitions 11LEVERAGING INNOVATION & TECHNOLOGY
BUILDING INFORMATION MAINTENANCE, REPAIR, LEVERAGING SMART BUILDING
MODELLING AND VIRTUAL AND OPERATION INNOVATIVE PERFORMANCE
DESIGN & CONSTRUCTION MANAGEMENT SOLUTIONS TECHNOLOGY
Utilizing integrated multi- Multi-year maintenance and Leveraging a variety of tools Lifecycle building performance
disciplinary performance turnaround contracts from virtual reality, drones, services through optimization,
models such as BIM/VDC to supporting major oil & gas infrared scanning, and and integrated technologies
mitigate risk, enhance clients through bundled automated project software to from the planning stages,
processes, and support the service offerings, facility strengthen our service through to commissioning,
bottom line of our business, maintenance, and predictive offerings and save our clients and post-warranty.
and our clients. technologies. time and money.
innovation and
technology value 12STACK
MODULAR
Turnkey solution bridging the gap
between site and modular
construction. Structural steel modular
buildings up to 40-storeys for multi-family,
hospitality, senior (long-term care) and
student housing, and resource clients.
RAPID DELIVERY ACROSS CANADA & THE USA
OPPORTUNITIES MARKET POISED FOR GROWTH
SCHEDULE AND COST CERTAINTY & PREDICTABILITY
GREEN REDUCED WASTE AND HIGH ENERGY
EFFICIENCY PRODUCT
innovation and
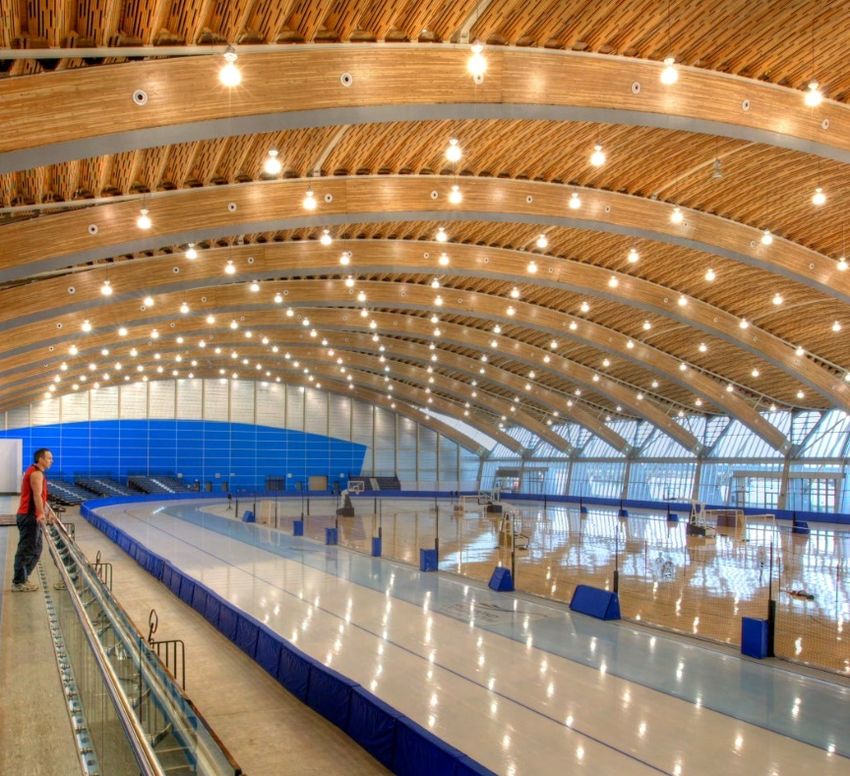
technology value 13MASS
TIMBER
Bird is a North American
leader in wood construction
with unmatched expertise,
experience, and supply chain
knowledge.
>$1.27B COMPLETED OR
UNDER CONSTRUCTION
>$234M PRECONSTRUCTION
>$1.02B OPPORTUNITIES
ACROSS CANADA
innovation and
technology value 14SUSTAINABILITY OVERVIEW
BUILD GREEN
Bird’s long-term strategic vision is rooted in our belief that the construction industry plays
Pursuing opportunities to utilize sustainable
building materials and minimize resource
an important role in providing sustainable, innovative, and lasting solutions for not only
waste. 200+ LEED projects to date. our clients, partners, and employees, but for the communities in which we live and work.
-Teri McKibbon, President and CEO
WORK GREEN
Delivering innovative solutions for
sustainable construction.
LIVE GREEN
Safe, inclusive workplace that supports
physical and mental wellbeing, promotes
professional development, and positive
community engagement.
CORPORATE GOVERNANCE
Cultivating a culture of honesty and
accountability.
environmental,
social, governance 15BUILDING SUSTAINABLE GROWTH
CONTINUALLY PURSUIT OF OVERALL
MANAGING BACKLOG MARGIN IMPROVEMENT
RISK PROFILE
RETAINING SIGNIFICANT
FINANCIAL FLEXIBILITY TO
DIVERSIFIED SERVICES & FOCUSED ON INCREASING PURSUE ORGANIC AND
GEOGRAPHICAL PRESENCE RECURRING REVENUE INORGANIC GROWTH
STREAMS OPPORTUNITIES
targeting sustainable
profitable growth 16DIVERSIFYING RISK REVENUE BY CONTRACT TYPE
in millions of Canadian dollars
28.8 0.4
• Public Private Partnership
100%
102.1 15.5 11.8
134.6 100.6
(PPP) 90% 36.3
176.9
80%
179.5 Higher risk
• Design-Build-Finance 70%
• Complex Design-Build
60%
50%
• Stipulated Sum 40%
• Unit Price
• Specified Design-Build 30%
20%
10% Lower risk
• Construction Management
• Integrated Project Delivery 0%
• Cost-Plus 2018A 2019A 2020A 2020 Q1 2021 Q1
CM/CP/IPD Stip Sum, Unit Price & Spec DB DBF & Complex DB PPP
• Increased diversification across services, end-markets and geographies; well-
balanced portfolio of low-to-medium risk projects.
• Over 95% percent of revenue is considered low-to-medium risk and supports the
company balanced revenue mix target. Focus on maintaining balance going forward.
targeting sustainable
profitable growth (1) Higher risk contract revenue includes: PPP, alternative finance and complex design build contracts 17CONTRACT AWARDS
CONCRETE FOUNDATIONS AND PAVING AT LNG FACILITY INDUSTRIAL SITE OVERPASS1 NANAIMO CORRECTIONAL$154M
STORM AND EFFLUENT PONDS1 CORRECTIONAL EXPANSIONS ‘THE BURKE’ TOWER1 $172M MRO CONTRACT $550M+
targeting sustainable
profitable growth 18
(1) Awards subsequent to quarter-endSTRONG BACKLOG & PENDING BACKLOG1
in millions of Canadian dollars
64% of Backlog expected to 5,000
convert into Revenue over the
4,500
next 12 months
4,000
MARCH 31, 2021 3,500 1,636 1,685
1,300
• Quarter-end Backlog was ~$2.6B 3,000
• Year-end Pending Backlog was ~$1.7B 2,500
• Backlog increased 84.2% year-over-year
2,000 575
• Increase primarily due to the acquisition of 750 600
625
625
Stuart Olson which added $996 million to 1,500 500 300 225
Backlog at acquisition date 2,590 2,682 2,627
1,000
• Pending Backlog now includes a greater 1,441 1,547 1,427 1,645
proportion MSA contracts. These contracts 1,249 1,244 1,347 1,186 1,297 1,240 1,235 1,296 1,283 1,380
500
represent a recurring revenue stream over
the next one to six years 0
Q1 Q2 Q3 Q4 Q1 Q2 Q3 Q4 Q1 Q2 Q3 Q4 Q1 Q2 Q3 Q4 Q1
2017 2018 2019 2020 2021
targeting sustainable Backlog
Backlog Pending Backlog
profitable growth 19
(1) Please see Terminology slide for description of Pending BacklogSTRONG GOVERNMENT SPENDING OUTLOOK
$350B+ IN GOVERNMENT SPENDING OPPORTUNITIES
FEDERAL 2021-2022 BUDGET HIGHLIGHTS
Infrastructure-related spending of $26B over 6 years
$14.9B | Public Transit Over 8 Years
$3.0B | Long-term Care and Affordable Housing* Over 5 Years (*$2.5B Over 7 Years)
$6.0B | Infrastructure In Indigenous Communities Over 5 Years
OTHER FEDERAL ANNOUNCEMENTS
Climate Plan related spending of $15B Canada Infrastructure Bank $10B
PROVINCIAL 2021-2022 BUDGET HIGHLIGHTS
$3.6B for Affordable Housing, $7.8B for Health Care, $7.6B for $21B for Highway Planning or Construction. The following over
ON
$22.5B $116.4B
BC
Transportation, and $3.5B for Education over 3-Years. 10 Years - $30.2B for Healthcare, $2.6B for Long-Term Care,
and $62.6B for Transportation.
$20.7B over 3-Years for Roads, Hospitals, and Schools.
$135B Expected Spending from Quebec Infrastructure Plan to
$2.2B for Health Facilities, $3B for Capital Maintenance and $20.7B $135.4B
QC
AB
2021-2031, including $408M for Affordable Housing.
Public Infrastructure Renewal, and $2.4B for Roads and Bridges.
$3.1B Infrastructure Investment for Capital Investment in $467M for roads, and bridges, $95.5M for healthcare
ATLANTIC
CANADA
Schools, Hospitals, Highways, for Crown Corporations, and $3.1B construction, and repair, $178.2 healthcare redevelopment, $1.0B
SK
Other Needed Infrastructure. $217.2M for schools, in NS. $10M for Long-term care in NB.
$630M for Highways, Road Construction, and Maintenance. $30M for lot development, $12M for Affordable Community
TERRITORIES
Over $292M for Health Facilities Infrastructure, and $415M for $1.3B Housing, $10.5M for K12, $54.3M for Bridges and Highways. $0.1B
MB
THE
20
K-12 and Post Secondary Infrastructure.INCREASING ADJUSTED EBITDA MARGIN
in millions of Canadian dollars
TRAILING TWELVE MONTH (TTM) ADJUSTED EBITDA
Q1 2021
1,565 1,627 7%
1600
1,419 1,382 1,376
1,504
5.9%
6%
5.9%
1400 5.5%
TTM ADJUSTED
1200 5% EBITDA Q1 2021
1000
3.6% 4%
800
3%
10
2.1% 2.3% SEQUENTIAL QUARTERS
600
1.8% OF IMPROVING TTM
2% ADJUSTED EBITDA %
400
0.8% 1%
200
Revenue Adj. EBITDA % (TTM)
0 0%
2017 2017 2017 2017 2018 2018 2018 2018 2019 2019 2019 2019 2020 2020 2020 2020 2021 ADJUSTED EBITDA
Q1 Q2 Q3 Q4 Q1 Q2 Q3 Q4 Q1 Q2 Q3 Q4 Q1 Q2 Q3 Q4 Q1 INCREASING
targeting sustainable
profitable growth Adjusted EBITDA and Adjusted EBITDA % are non-GAAP measures “Adjusted EBITDA” represents earnings (loss) before taxes, interest,
depreciation and amortization, finance and other costs, finance income, impairment of property and equipment, impairment of goodwill and intangible 21
assets, loss or gain on sale of property and equipment, restructuring costs outside of normal course, and acquisition-related costs and integration costs.REVENUE, NET INCOME AND ADJUSTED EARNINGS
in millions of Canadian dollars except per share amounts
REVENUE NET INCOME ADJUSTED EARNINGS
$1,600 $0.92
$40.0 $0.80 $0.90 $45.0 $1.00
$1,400 $35.0 $0.80 $40.0
$0.70 $0.80
$1,200 $30.0 $35.0
$0.60
$1,000 $25.0 $30.0
$0.50 $0.60
$20.0 $25.0
$800 $36.1 $0.40
$1,382 $1,376 $1,504 $15.0 $41.6
$600 $0.22 $0.30 $20.0 $0.40
$10.0 $0.13 $0.22
$400
$0.20 $15.0 $0.17
$5.0 $9.5 $0.03
$1.1 $7.1 $0.10 $10.0
$0.20
$200 $445 $(0.02) $0.03
$322 $0.0 $0.00 $5.0
$(0.02)
$9.5 $1.1 $9.1 $0.00
$- $(5.0) 2018A
$(1.0) 2019A 2020A 2020 Q1 2021 Q1 $(0.10)
$0.0
2018A 2019A 2020A 2020 Q1 2021 Q1
$(5.0) 2018A
$(1.0) 2019A 2020A 2020 Q1 2021 Q1 $(0.20)
Net Income EPS Adj. Earnings Adj. EPS
• Q1’21 revenue of $444.6M is up year- • Q1’21 Net Income of $7.1M improved • Q1’21 Adjusted Earnings of $9.1M
over-year from $321.6M year-over-year from $1.1M improved year-over-year from $1.1M
• TTM at Q1’21 revenue growth year- • TTM at Q1’21 EPS growth year-over- • TTM at Q1’21 Adjusted EPS growth
over-year despite headwinds from year despite headwinds from COVID- year-over-year despite headwinds
COVID-19 pandemic 19 pandemic and acquisition & from COVID-19 pandemic
integration costs
targeting sustainable
profitable growth TTM - Trailing Twelve Month 22STRONG FINANCIAL POSITION
Q1 2021
MARCH 31, 2021
in millions of Canadian dollars
26.4% 1.22 0.36x
LT DEBT CURRENT ADJUSTED NET DEBT/ Accessible cash $ 31.1
TO EQUITY RATIO TTM ADJUSTED
EBITDA(1)
Restricted cash $ 45.1
• Q4 2020 announced new syndicated credit facilities $165M
revolving credit facility and a $35M committed, non-revolving Held in joint operations
term debt facility accounts $ 48.8
• Accordion feature for up to additional $50M Cash and cash
• Leverage remains one of the industry’s lowest, providing equivalents $ 125.0
flexibility to successfully grow the business organically and
through accretive M&A
Adjusted net debt $ 34.2
driving superior Shareholder Equity $ 217.0
shareholder value (1) Adjusted net debt reflects accessible cash and current and long-term loans and borrowings 23BALANCED CAPITAL ALLOCATION PRIORITIES
$15.0
$13.0
CAPEX (2) $11.0
$9.0
$7.0 $14.6 $14.4 $14.2
$5.0
OPERATING CASHFLOW (1)
$3.0
$1.0 $2.3
$1.0
$80.0 -$1.0 2018A 2019A 2020A 2020YTD Q1 2021YTD Q1
$70.0
$20.0
$60.0
$18.0
$50.0 DIVIDENDS $16.0
$14.0
$40.0 $12.0
$71.7 $10.0
$30.0 $8.0 $16.6 $16.6 $17.6
$6.0
$20.0 $4.0
$30.2 $2.0 $4.1 $5.2
$10.0 $20.8
$12.3 $-
$7.1 2018A 2019A 2020A 2020YTD Q1 2021YTD Q1
$-
2018A 2019A 2020A 2020YTD Q1 2021 YTD MERGER AND
Q1
ACQUISITION
OPPORTUNITIES
Repaid $5M of LTD during Q1 2021. Repay all or a
LONG TERM DEBT portion of remaining drawn on revolving
REPAYMENT committed syndicated facility
driving superior
shareholder value 24
(1) Operating cash flow - Refer to the consolidated statement of cash flows – “Cash flows from operations before changes in non-cash working capital”
(2) Includes additions of computer software purchases classified as intangible assets. Excludes ROU Asset additionsWHY INVEST IN BIRD
Maintaining A Strong Balance A Leading Canadian Key Focus on Overall Diversified National Presence
Sheet With Significant Construction Company Margin Improvement with increased cross-selling
Financial Flexibility opportunities being realized
through the integration
of Stuart Olson
Diversifying Book of Business Delivering Long-term
and Increasing Recurring Shareholder Value
Revenue Streams
Maintaining Backlog Proven Track Record
Risk Profile Within Of Growth Through
Acceptable Parameters Accretive M&A
25ANALYST COVERAGE
ATB CAPITAL CANACCORD| CIBC WORLD iA CAPITAL MARKETS
MARKETS INC. GENUITY MARKETS Naji Baydoun
Chris Murray Yuri Lynk Jacob Bout 514.830.8077
647.776.8246 514.844.3708 416.956.6766 Naji.baydoun@iagto.ca
cmurray@atb.com yuri.lynk@canaccordgenuity.com jacob.bout@cibc.com
LAURENTIAN BANK NATIONAL BANK RAYMOND TD
SECURITIES FINANCIAL JAMES LTD. SECURITIES
Nishita Mehta Maxim Sytchev Frederic Bastien Michael Tupholme
416.560.0717 416.869.5617 604.659.8232 416.307.9389
mehtaN@lb-securities.ca maxim.sytchev@nbc.ca frederic.bastien@raymondjames.ca michael.tupholme@tdsecurities.com
26QUESTIONS
FINANCIAL HIGHLIGHTS
                                                                                            Q1 2021 RESULTS(1)
STRONG                                                   Solid start to 2021 despite
SOLID
FINISH TO 2020                                           2020 being a year of
                                                                                            $455M       38.2%
START TO 2021
                                                         unprecedented uncertainty                  REVENUE

                                                                                            $39.9M      136.0%
                                                                                                 GROSS PROFIT
                                                         Healthy Backlog of $2.6B
HEALTHY                                                                                     $21.0M      178%
                                                         and Pending Backlog(2) of
BACKLOG
                                                         $1.7B                                  ADJUSTED EBITDA

                                                                                             $9.1M        731%
                                                                                               ADJUSTED EARNINGS
STRONG                                                   Strong Balance Sheet and
                                                         healthy pipeline of
BALANCE SHEET
                                                         opportunities in 2021              $389.3M       93.9%
                                                                                                 SECUREMENTS

 (1) Increase percentages and values represent year-over-year.                                                     28
(2) Please see Terminology slide for description of Pending Backlog
You can also read