Investor Overview Presentation - March 2021 - Seeking Alpha
←
→
Page content transcription
If your browser does not render page correctly, please read the page content below
March 2021

             Investor Overview Presentation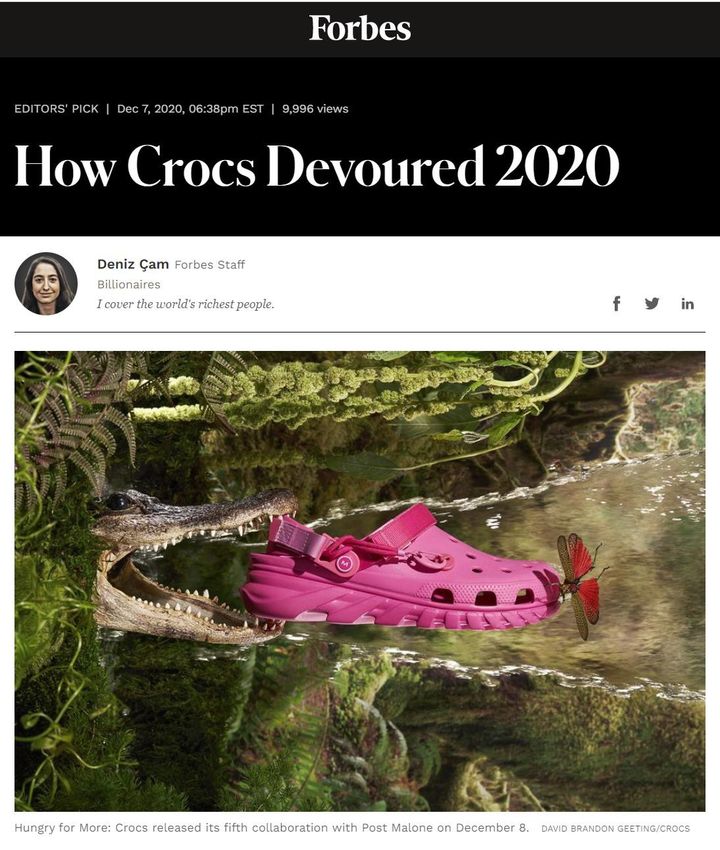
Disclaimer
    This presentation contains statements relating to future results of Crocs, Inc. (the “Company,” “Crocs,” “we,” “us” or “our”) (including certain outlooks, projections and business
    trends) that are “forward-looking statements” as defined in the Private Securities Litigation Reform Act of 1995. Forward-looking statements are typically identified by words or
    phrases such as “believe,” “expect”, “anticipate,” “estimate,” “should,” “are likely to be,” “will,” and similar expressions. These statements include, but are not limited to, statements
    regarding potential impacts to our business related to the COVID-19 pandemic, our financial condition, strategic plans, brand and liquidity outlook and expectations regarding our
    future revenue, Adjusted EBITDA (as defined below), Free Cash Flow, tax rate, inventory and capital expenditures. These statements involve known and unknown risks,
    uncertainties and other factors, which may cause our actual results, performance or achievements to be materially different from any future results, performances, or achievements
    expressed or implied by the forward-looking statements. These risks and uncertainties include, but are not limited to, the following: the COVID-19 outbreak and related government,
    private sector, and individual consumer responsive actions; current global financial conditions, including economic impacts resulting from the COVID-19 outbreak; the effect of
    competition in our industry; our ability to effectively manage our future growth or declines in revenues; changing consumer preferences; our ability to maintain and expand revenues
    and gross margin; our ability to accurately forecast consumer demand for our products; our ability to successfully implement our strategic plans; our ability to develop and sell new
    products; our ability to obtain and protect intellectual property rights; the effect of potential adverse currency exchange rate fluctuations and other international operating risks; and
    other factors described in our most recent Annual Report on Form 10-K under the heading “Risk Factors” and our subsequent filings with the Securities and Exchange Commission
    (the “SEC”). Readers are encouraged to review that section and all other disclosures appearing in our filings with the SEC. These forward-looking statement are made only as of
    the date hereof, and Crocs undertakes no obligation to update or revise the forward-looking statements, whether as a result of new information, future events or otherwise, except
    as otherwise required by law.

    In addition to financial measures presented on the basis of accounting principles generally accepted in the United States of America (“GAAP”), we present, among other measures,
    Adjusted EBITDA, Adjusted EBITDA Margin, EBITDA, EBITDA Margin, Free Cash Flow, Adjusted Cost of Sales, Adjusted Gross Profit, Adjusted Gross Margin, Adjusted
    Income from Operations and Adjusted Operating Margin, which are Non-GAAP Financial Measures (collectively, the “Non-GAAP Financial Measures”). The Non-GAAP
    Financial Measures exclude the impact of items that management believes affect the comparability or underlying business trends in our consolidated financial statements for the
    periods presented. We also present certain information related to our current period results of operations through “constant currency,” which is a Non-GAAP Financial Measure and
    should be viewed as a supplement to our results of operations and presentation of reportable segments under GAAP. Constant currency represents current period results that have
    been retranslated using exchange rates used in the prior year comparative period. We believe the use of constant currency enhances the visibility of the underlying business trends
    excluding the impact of foreign currency exchange rate fluctuations. We use the Non-GAAP Financial Measures results to assist in comparing business trends from period to period
    on a consistent basis in communications with the board of directors, stockholders, analysts, and investors concerning our financial performance. We believe that the Non-GAAP
    Financial Measures are useful to investors and other users of our consolidated financial statements as an additional tool for evaluating operating performance and trends. For the
    periods presented, we believe it is helpful to evaluate our results excluding the impacts of various adjustments relating to special or nonrecurring items. Investors should not
    consider the Non-GAAP Financial Measures in isolation from, or as a substitute for, financial information prepared in accordance with GAAP.

2
Table of Contents

    11.   Company Overview

    22.   Key Investment Highlights

    33.   Financial Overview and Business Strategy

          Appendix

3
1. Company Overview

Crocs At-a-Glance

    Scaled Brand:                                            Strong Margins:                    Iconic Product:                                                      Global Reach:

                                                                 FY2020 Adj. EBITDA(1):
                                                                                                                                                                                             42%
           FY2020 Sales:                                                                                                                                                   International Revenue
                                                                       $290mm
            $1,386mm                                                                                    69mm Pairs of                                                               (Distributed in
                                                                    20.9% Margin(1)
                                                                                                      Shoes Sold in 2020                                                           80+ Countries)

    Widely Recognized:                                       Robust Growth:                     Category Leader:                                                     High Digital Penetration:

                ~64%
                                                                                                                        #1
                                                                           +12.9%                                                                                                      42%
             Global Aided                                                                          in Clog Category(3)
                                                                       FY2018 - FY2020                                                                                           FY2020 Global
          Brand Awareness(2)                                            Revenue CAGR                                                                                          Digital Penetration(4)

                                              Iconic, Multichannel Brand Positioned for Long-Term Growth

    (1)      See reconciliation to GAAP equivalents in Appendix.                          (4)    Digital penetration includes: e-tail (reported within wholesale) and e-commerce (inclusive of existing e-commerce
    (2)      Company estimate as of year-end 2020.                                               segment reported within direct-to-consumer (“DTC”)).
5   (3)      Based on management’s estimates and industry knowledge.
                                                                                                                                                                                                               •     Strictly Private & Confidential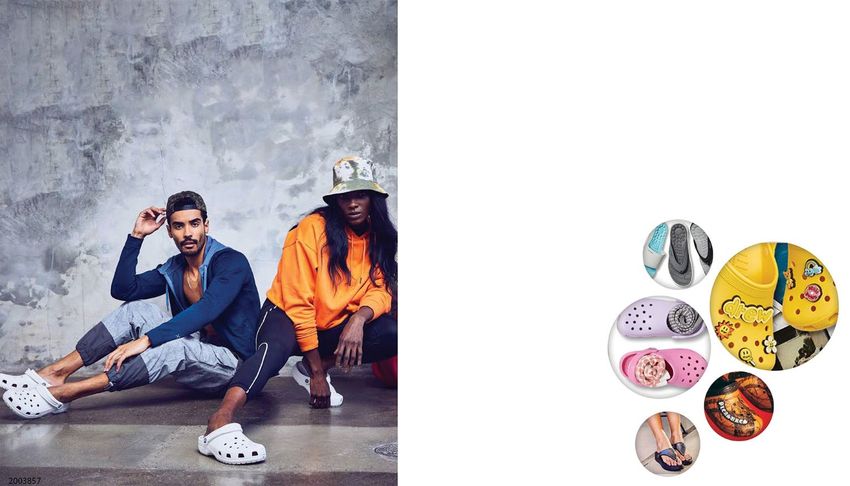
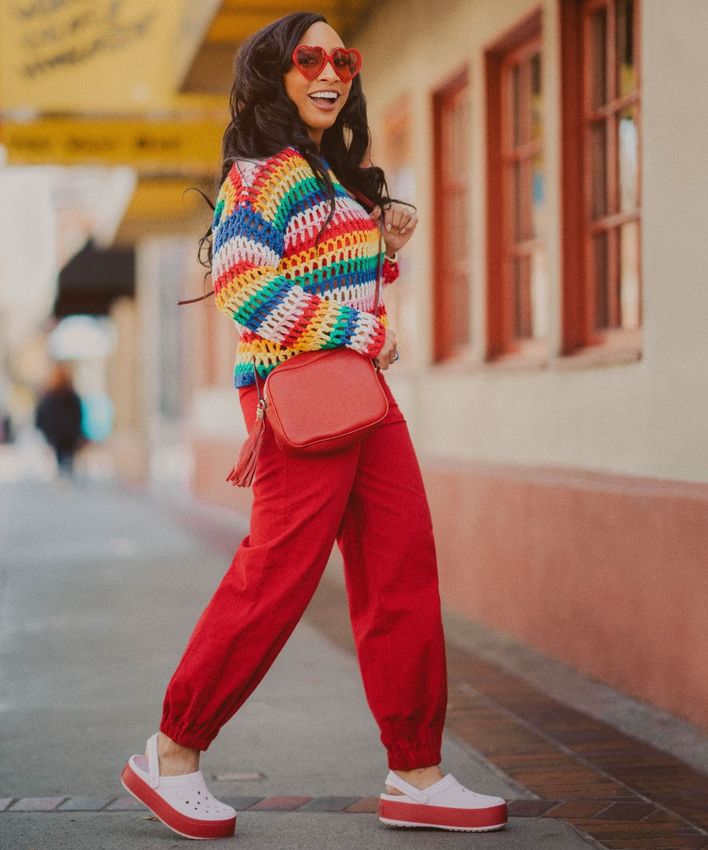
Multifaceted Marketing Strategy to Drive Broad Awareness and Brand Affinity
    Shift to Digital / Social   Celebrity Campaigns         Collaborations

6
                                                                        •   Strictly Private & Confidential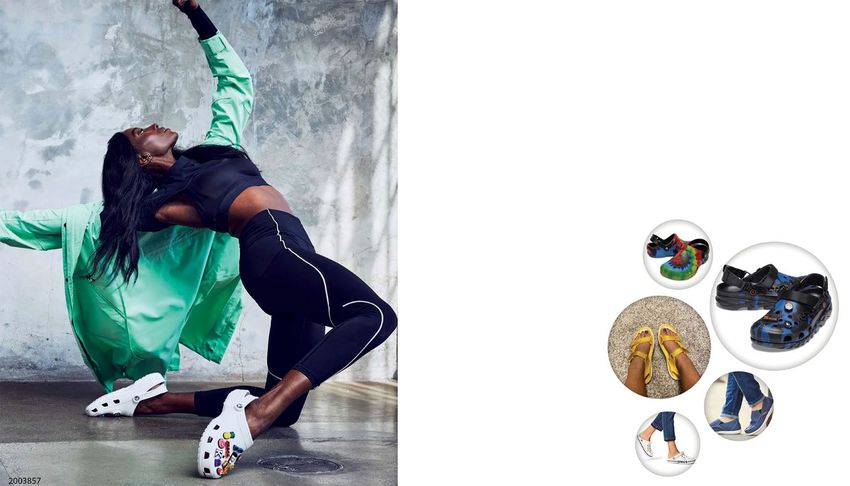
Omnichannel Distribution Mix with Focus on Digital
                                                                     DTC                                                                                                                                                 Wholesale
                                                                (50% of Sales)(1)                                                                                                                                     (50% of Sales)(1)
                                                                                                                                  Digital
                                                                                                                              (42% of Sales)(1)

                                                                                                                                                                                            E-tailers
                                                                                                                       Third-party marketplaces                                                                                           Distributors, multi-brand and
       Company-owned stores                                             Crocs.com                                                                                                   (e.g., Amazon, Zappos,
                                                                                                                             (e.g., Tmall)                                                                                                        B&M retailers
                                                                                                                                                                                            Zalando)

    • Operates 351 locations                           • Operates e-commerce channel through own site (Crocs.com) and                                                          • Wholesale channel includes select number of e-tailers, distributors
      worldwide, including full-price,                   third-party marketplaces (e.g., Tmall, VIP, Rakuten, eBay)                                                              and B&M retailers
      outlet, kiosk and store-in-store
      formats                                          • Company fulfills product (1P)
                                                                                                                                                                               • Strong network of international distributors
    • Global network of carefully                      • Advanced online capabilities, focused on operational excellence
      chosen locations with proven                       and seamless customer experience
                                                                                                                                                                               • Choose leading partners with close alignment to Crocs product and
      store concept
                                                       • Fast-growing distribution channel driven by accelerated consumer                                                        marketing strategies
    • Strong store base with 21.2%(2)                    adoption, performance-driven marketing and expanded digital reach
      retail comparable store sales
      growth in FY2020

         Note:      “B&M” represents brick-and-mortar.
         (1)        Channel breakdown reflects FY2020.
7        (2)        Retail comparable store sales (“CSS”) growth reflects period over period change as if the current period results were in constant currency, which is a Non-GAAP Financial Measure. See further details in Appendix.
                                                                                                                                                                                                                                                     •   Strictly Private & Confidential
Digital Acceleration Driven by Strategic Investment in Channel
               Crocs Digital-First Approach Since 2015…                                     …Prepares Company for Rapid Growth during Pandemic

    • Emphasis on digital and strengthening of digital platform, experience and              FY2020 Digital Performance Highlights
      partnerships has yielded continued double-digit growth
                                                                                             • Accelerated consumer adoption of e-commerce throughout the pandemic
    • Robust digital strategy and e-commerce offering:                                       • Strong digital growth of 50%, benefitting from:

      - Early investment in first- and third-party mix optimization by country and region      - Strong brand heat

                                                                                               - Fewer discounts and promotions
      - Investment in people and technologies to elevate consumer experience,
        develop brand affinity and increase conversion through relevant content              • Digital represented 42% of total revenue in FY2020, compared to 31% of total
                                                                                               revenue in 2019
      - Acceleration of digital platform investment to execute retention strategies
                                                                                             Accelerated Digital Growth in FY2020
        around data, segmentation and personalization                                        % Digital Penetration                                            55%

                                                                                                             39%                      39%             40%
                                                                                                                                                              42%
                                                                                                       30%                      28%
                                                                                                                                                              31%

                                                                                                        Americas              Asia Pacific              EMEA

                                                                                                         FY2019      FY2020       FY2019 Global    FY2020 Global

8
                                                                                                                                                         •   Strictly Private & Confidential
Crocs has Built a Profitable Platform with Incremental Growth Opportunity
Revenue Crocs Transformation
($ in mm) ’16 – ’20 CAGR
+7.5%
$1,386
$1,231 Since 2014, Crocs has transformed the
$1,036 $1,024 $1,088 brand by focusing on:
Crystal clear, consumer-centric
brand strategy
FY2016 FY2017 FY2018 FY2019 FY2020
YoY Growth:
(5.0%) (1.2%) 6.3% 13.1% 12.6%
Iconic and incredibly versatile
E-Commerce Penetration: Digital Penetration: product offering
12.6% 14.6% 16.8% 31.1% 41.5%
EBITDA(1) Adj. EBITDA(1)
($ in mm) ($ in mm) ’18 – ’20 CAGR Digital-first approach
+58.6% $290
’16 – ’17 YoY Growth
$166
+90.2%
Disciplined execution
$115
$51
$27
FY2016 FY2017 FY2018 FY2019 FY2020 Best-in-class talent (at all levels)
% Margin(1):
2.6% 5.0% 10.6% 13.5% 20.9%
Note: In 2019, Crocs began reclassification of online metrics tracking so digital now reported separately and includes: e-tail (reported within wholesale) and e-commerce (inclusive of existing e-commerce segment reported within DTC). Prior to
2019, reported e-commerce penetration, which includes company-operated e-commerce sites and third-party-operated marketplace activity.
9 (1) See reconciliation to GAAP equivalents in Appendix.
• Strictly Private & Confidential
2. Key Investment Highlights
Key Investment Highlights

          1   Leading Global Footwear Brand Anchored by Iconic Product with Democratic Appeal

              2         Market Leader in Clog Category with Significant Whitespace in Sandals and Personalization

                  3      Accelerating Our Industry-Leading Digital Penetration

                  4      Global Footprint with Opportunity to Grow and Scale International Markets

                  5     Authentic, Come As You Are Culture with Commitment to ESG

              6       Strong Financial Profile with Exceptional Free Cash Flow Generation

          7   Best-in-Class Management Team with Deep Industry Knowledge and Expertise

11
                                                                                                             •   Strictly Private & Confidential
1 Leading Global Footwear Brand Anchored by Iconic Product with Democratic Appeal
• Classic clog is an unmistakable icon recognized around
the world
• Powerful global brand with large, diverse consumer base
• Brand desirability, brand relevance and brand
consideration each rose double-digits in 2020 and over the
past four years in annual brand survey
• Market leader in expanding global clog category that has
grown to $5bn(1)
Top 10 Top 10
non-athletic global footwear brand for
footwear brand U.S. teens
Brand of the Year
2020 Footwear News
Achievement Awards
Sources: L.E.K. Consulting, internal estimates and Footwear News.
(1) Based on management’s estimates and industry knowledge.
12
• Strictly Private & Confidential2 Market Leader in Clog Category with Significant Whitespace in Sandals and Personalization
Clog Category
• $5bn market with outpaced growth in casual footwear
• Crocs is currently the market leader in the clog category(1)
• Opportunity to further grow the category
• Key drivers of clog growth and relevance include impactful collaborations and personalization
• Strongest growth in Americas with continued opportunity in Europe and Asia
Personalization with Jibbitz
• Optimistic storytelling and personalization will be even more critical post COVID-19
• Major driver of average selling price and overall clog and sandal sales while expanding the originality and
uniqueness of the Crocs line of products
• Jibbitz audience has ~2x customer lifetime value vs. clog, sandals and work
• Sales accelerated, doubling in 2020
Sandals Category
• ~$30bn market, expected to grow in line with casual footwear at ~4% per year
• Large share growth opportunity within fragmented category with no dominant players
• Consistent track record of growth in sandals, accounting for 18% of Crocs footwear sales in 2020
• Key drivers of sandal growth are:
– Targeting female explorers
– Marketing to support awareness
– Higher purchase frequency (multiple purchase occasions)
Sources: L.E.K. Consulting and internal estimates.
(1) Based on management’s estimates and industry knowledge.
13
• Strictly Private & Confidential3 Accelerating Our Industry-Leading Digital Penetration
DTC Channel Wholesale Channel
Rapidly Growing Digital Platform Strong Wholesale Network
• Investment in digital infrastructure has led to rapid growth in e-commerce channel • Selective wholesale distribution network with strong portfolio of leading e-tailers,
• 50% digital revenue growth in 2020 vs. 2019, with room for further expansion B&M, retailers and distributors
• Products sold and distributed in 80+ countries across key geographies through
Targeted Global Retail Footprint wholesale partners
• Disciplined store strategy with carefully chosen locations (351 stores)
• Proven DTC platform with strong comparable sales growth of 39.2%(1) in 2020
Wholesale
50%
Omnichannel
Route to
Market
DTC
50%
DTC Revenue Growth Wholesale Revenue Growth
’17 – ’20 CAGR ’17 – ’20 CAGR
+12.4% +8.9%
$693
$693
$656
$574 $578
$510 $536
$487
FY2017 FY2018 FY2019 FY2020 FY2017 FY2018 FY2019 FY2020
DTC Comparable Sales Growth(1): % Growth:
4.7% 14.3% 16.0% 39.2% (1.8%) 7.8% 13.5% 5.6%
(1) DTC CSS growth reflects period over period change as if the current period results were in constant currency, which is a Non-GAAP Financial Measure. See further details in Appendix.
14
• Strictly Private & Confidential4 Global Footprint with Opportunity to Grow and Scale International Markets
Global Footprint The China Opportunity
• Established retail presence across 3 continents and FY2020 Revenue by Geography Significant Whitespace
distribution in 80+ countries
EMEA • 2nd largest footwear market in the world
• Strong network of international distributors 18%
• Underpenetrated with less than 5% of FY2020 sales in
• Double-digit YoY growth in owned e-commerce
China
(+58%) across all regions in FY2020
Asia
Pacific
• Continue to scale international markets with focus on 20% Americas Investing for Growth
62%
EMEA in 2021 and Asia Pacific in 2022
• Building brand awareness in second year with Yang Mi
• Majority of stores are off-mall, primarily outlets and
store-in-store locations • Developing local-for-local marketing and collaborations
Netherlands • Changing brand image through new concept stores
2
Canada Russia
8 26
• Focusing on key T1 and T2 cities with high spending
Retail Presence
China
power and participation of Gen Z consumers
U.S.
154 18 Japan
France Austria 12
Region Retail Stores
4 3 • Repositioning to a higher quality partner store network
Germany South Korea
Americas 165 Puerto Rico
3
14 90
• Accelerating strong e-commerce presence through
Asia Pacific 137
Singapore
marketplaces (JD, Tmall, VIP)
17
EMEA 49
• Maintaining focus through Board oversight committee
Total 351
Successful global expansion with international accounting for 42% of revenue in 2020
15
• Strictly Private & Confidential5 Authentic, Come as You Are Culture with Commitment to ESG
Environment Social Governance
• Joined Sustainable Apparel Coalition (SAC) • Diverse workforce with diversity recruiting strategy • Remains an area of strength evidenced by ISS and
MSCI rankings
• Female: 52% Management / 68% All Other
• Exploring environmentally-friendly raw materials
• URG: 23% Management / 57% All Other • Diverse Board: 38% Female / 13% URG
• Currently rework ~45% of our Croslite production waste • Culture of learning & development
back into our production processes • Responsible and performance-driven compensation
• Regular engagement / employee listening
programs
• Over 98% of our product line is currently Vegan with a • Implemented pay equity practices
goal of being a 100% Vegan brand by the end of 2021 • Established CAYA Councils and CAYA Series • Robust Enterprise Risk Management and Ethics &
Compliance program frameworks
• Maintain a factory Social Compliance Code of Conduct
• In 2020, over 85% of our product has been sold without
and Certification Process
shoe boxes • Established an ESG / sustainability management and
• Social compliance audits in accordance with WRAP oversight framework
• Over the past 5 years, we’ve been able to save almost principles
250mm shoe boxes from entering the market • Monitor ~600 chemicals in our supply chain for • Strong internal controls, accounting and audit practices
compliance with legal / regulatory requirements
• Partner with several organizations to keep unsellable
• Crocs Cares provides shoes, funds and time, with ~1
product and samples out of the landfill, with >90,000 pairs
million pairs donated in the past 5 years
of shoes donated in 2020
Note: URG represents underrepresented groups. CAYA represents “Come as You Are”. WRAP represents Worldwide Responsible Accredited Production.
16
• Strictly Private & Confidential6 Strong Financial Profile with Robust Free Cash Flow Generation
Revenue
($ in mm) ’16 – ’20 CAGR
+7.5%
$1,231 $1,386
$1,036 $1,024 $1,088
FY2016 FY2017 FY2018 FY2019 FY2020
% Growth:
(5.0%) (1.2%) 6.3% 13.1% 12.6%
EBITDA(1) Adj. EBITDA(1) ’18 – ’20 CAGR
($ in mm) ’16 – ’17 YoY Growth ($ in mm) +58.6% $290
+90.2%
$166
$115
$27 $51
FY2016 FY2017 FY2018 FY2019 FY2020
% Margin:
2.6% 5.0% 10.6% 13.5% 20.9%
Free Cash Flow(1)
($ in mm) $225
$85 $102
$53
$18
FY2016 FY2017 FY2018 FY2019 FY2020
Capital Expenditures:
$22 $13 $12 $37 $42
(1) See reconciliation to GAAP equivalents in Appendix.
17
• Strictly Private & Confidential7 Best-in-Class Management Team with Deep Industry Knowledge and Expertise
Name and Title Biography Prior Experience
Andrew Rees • Joined Crocs as President in 2014; became CEO and joined Board of Directors in 2017
CEO and Director • Previously served as Managing Director at L.E.K. Consulting where he founded and led the firm’s Retail and
Crocs Tenure: 6+ years Consumer Products Practice for 13 years
Industry Tenure: 25+ years • Prior to L.E.K., he served as VP of Strategic Planning and Retail Operations for Reebok International
Michelle Poole • Became President in Sept. 2020, adding oversight for Americas, Asia and EMEA regional commercial teams
President
• Previously served as EVP and Chief Product and Merchandising Officer at Crocs beginning in 2014
Crocs Tenure: 6+ years
• Brings more than 29 years of experience having served at Converse, Timberland and Sperry Top-Sider
Industry Tenure: 29+ years
Anne Mehlman • Rejoined Crocs in 2018, bringing over 15 years of financial and operational experience
EVP and CFO • Previously served as CFO of Zappos.com and VP of Corporate Finance at Crocs from 2011 to 2016
Crocs Tenure: 7+ years • Previous experience includes Director of Finance at RSC Equipment Rental and various financial roles at
Industry Tenure: 15+ years Corporate Express and Lockheed Martin
Elaine Boltz • Joined Crocs as Chief Operations and Transformations Officer in 2020
EVP and COO • Previously served as President of TJX Digital from 2011 to 2017
Crocs Tenure: 1 year • Previous experience includes Head of Chico’s FAS direct-to-consumer business, Chief Marketing and
Industry Tenure: 10+ years Strategy Officer at Ann Inc. and Senior Principal at BCG
Dan Hart • Joined Crocs as Chief Legal and Risk Officer in 2009
EVP and CL&RO • Previously served as SVP and General Counsel at Océ North America from 2006 to 2009
Crocs Tenure: 11+ years • Previous experience includes SVP of General Counsel and Human Resources for Invensys Controls and
Industry Tenure: 30+ years senior legal positions at Dictaphone Corporation and Brooke Group
Adam Michaels • Promoted to SVP and Chief Digital Officer after joining the company as Vice President of Global E-Commerce
SVP and CDO in 2013
Crocs Tenure: 7+ years • Previously led e-commerce channel at Reebok
Industry Tenure: 15+ years • Founded and grew e-commerce start-up, Cloud 9 Living, into a successful growth business
18
• Strictly Private & Confidential3. Financial Overview & Business Strategy
2020: A Very Successful Year
• Robust revenue growth (+13% YoY)
• Improved quality of revenues
– Fewer discounts and promotions
• Expanded margins
– Higher prices
– Fewer discounts and promotions
– Favorable product mix
– Leveraged SG&A, while supporting growth
• Invested to support future growth
− Doubled e-commerce distribution capacity in the U.S.
− Relocating EMEA distribution center in 2021
• Strengthened balance sheet
Source: Image from Forbes.
20
• Strictly Private & ConfidentialFY2020 Performance Update
FY2020 Financial Results Q4 2020 Financial Results
($ in mm) ($ in mm)
FY2020 vs. PY $412
56.0%
+56.5%
+670
bps
Revenue $1,386 +13.5%(1) $263
49.3%
Adj. Gross Margin(2) 54.6% +350 bps
Operating Income $214 66% Revenue Adj. Gross Margin (2)
$94
$87
Adj. Operating Income(2) $263 84%
+391%
+577%
Adj. Operating Margin(2) 18.9% +730 bps
$19
$13
Adj. EBITDA(2) $290 75%
Adj. Operating Income (2) Adj. EBITDA (2)
Q4 2019 Q4 2020
(1) Revenue growth on a constant currency basis.
(2) See reconciliation to GAAP equivalents in Appendix.
21
• Strictly Private & ConfidentialPositioned for Global Growth
Four Key Powerful Social & Digital-Led Largest Long-Term
Product Pillars Digital Marketing Route to Market Growth Opportunity
in Asia
Clog: Innovate & grow clog Digital and social focus globally E-commerce: Double-digit plus Americas: Strong growth
relevance growth continues momentum
Come As You Are
Sandals: Significant long-term Retail: Prioritize outlets as most EMEA: Solid growth on brand heat
growth potential Brand ambassadors profitable retail format
Social influencers Asia: Largest long-term growth
Personalization Wholesale: Strong growth potential
Collaborations opportunities within e-tail accounts;
Visible Comfort Technology long-term growth potential with
distributors
22
• Strictly Private & ConfidentialAppendix
Adjustments Reconciliation
Adjusted cost of sales, gross profit, and gross margin reconciliation Three Months Ended December 31, Year Ended December 31,
2020 2019 2020 2019 2018
($ thousands)
GAAP revenues $ 411,506 $ 262,979 $ 1,385,951 $ 1,230,593 $ 1,088,205 (1) Represents expenses, including expansion costs, related to our distribution centers in Dayton, Ohio and
Dordrecht, the Netherlands and initial costs for our new third-party operated distribution center in Chiba, Japan.
GAAP cost of sales $ 182,422 $ 136,741 $ 636,003 $ 613,537 $ 528,051
New distribution centers (1) (1,550) (3,413) (4,186) (11,394) - (2) Represents an inventory write-off in our Asia Pacific segment associated with the impact of COVID-19.
COVID-19 inventory write-off(2) - - (2,396) - -
Other - 84 (119) (91) -
(3) Represents bad debt expense associated with the impact of COVID-19 on wholesale partners in our Asia
Total adjustments (1,550) (3,329) (6,701) (11,485) -
Pacific and Americas segments.
Adjusted cost of sales $ 180,872 $ 133,412 $ 629,302 $ 602,052 $ 528,051
GAAP gross profit $ 229,084 $ 126,238 $ 749,948 $ 617,056 $ 560,154 (4) Represents costs incurred in response to COVID-19, including hazard pay, cleaning costs, and legal costs.
GAAP gross margin 55.7% 48.0% 54.1% 50.1% 51.5% (5) Represents non-recurring expenses related to relocation of Crocs corporate headquarters planned for
March 2020.
Adusted gross profit $ 230,634 $ 129,567 $ 756,649 $ 628,541 $ 560,154
Adjusted gross margin 56.0% 49.3% 54.6% 51.1% 51.5%
(6) Represents impairments to our long-lived assets for a retail store in New York City and for our former corporate
headquarters in Niwot, Colorado.
Adjusted selling, general and administrative expenses reconciliation Three Months Ended December 31, Year Ended December 31,
2020 2019 2020 2019 2018 (7) Represents ongoing duplicate rent costs associated with our move to our new headquarters in Broomfield,
($ thousands) Colorado, while we conclude the lease for our former headquarters.
GAAP revenues $ 411,506 $ 262,979 $ 1,385,951 $ 1,230,593 $ 1,088,205
(8) Represents non-recurring expenses associated with cost reduction initiatives in 2019 and our SG&A reduction
GAAP selling, general and administrative expenses $ 164,453 $ 117,882 $ 535,824 $ 488,407 $ 497,210 plan in 2018.
Donations of inventory 70 - (9,900) - -
COVID-19 severance costs - - (2,403) - - (9) Represents fees associated with the November 4, 2019 underwritten public offering, in which certain investment
COVID-19 impact of bad debt expense(3) 315 - (4,118) - - funds affiliated with The Blackstone Group Inc. sold 6.9 million shares of our stock to Morgan Stanley & Co.
Other COVID-19 costs (4) (18) - (845) - - LLC. We did not receive any proceeds from this sale.
Accelerated depreciation of assets (5) - - - - (1,306)
Asset impairments (6) (21,071) - (21,071) - - (10) Represents non-recurring expenses associated with the 2018 closures of Mexico and Italy manufacturing and
Duplicate headquarters rent(7) (154) - (1,274) - - distribution facilities.
Non-recurring expenses associated with cost reduction initiatives (8) - (584) - (2,282) (6,082)
Offering fees (9) - (589) - (589) - (11) Represents non-recoverable duties, non-recurring costs related to the closure of company-owned retail stores
Closure of manufacturing and distribution facilities (10) - - - - (13,712) in Australia, employee severance costs, and various other immaterial items.
Other(11) 8 - (2,125) - -
Total adjustments (20,850) (1,173) (41,736) (2,871) (21,100)
(12) Adjusted selling, general and administrative expenses are presented gross of tax.
Adjusted selling, general and administrative expenses (12) $ 143,603 $ 116,709 $ 494,088 $ 485,536 $ 476,110
GAAP selling, general and administrative expenses as a percent of revenues 40.0% 44.8% 38.7% 39.7% 45.7% (13) See ‘Adjusted cost of sales and gross margin reconciliation’ above for more details.
Adjusted selling, general and administrative expenses as a percent of revenues 34.9% 44.4% 35.6% 39.5% 43.8%
(14) See ‘Adjusted selling, general and administrative expenses reconciliation’ above for more details.
Adjusted income from operations and operating margin reconciliation Three Months Ended December 31, Year Ended December 31,
2020 2019 2020 2019 2018
($ thousands)
GAAP revenues $ 411,506 $ 262,979 $ 1,385,951 $ 1,230,593 $ 1,088,205
GAAP income from operations $ 64,631 $ 8,356 $ 214,124 $ 128,649 $ 62,944
Cost of sales adjustments (13) 1,550 3,329 6,701 11,485 -
Selling, general and administrative expenses adjustments (14) 20,850 1,173 41,736 2,871 21,100
Adjusted income from operations $ 87,031 $ 12,858 $ 262,561 $ 143,005 $ 84,044
GAAP operating margin 15.7% 3.2% 15.4% 10.5% 5.8%
Adjusted operating margin 21.1% 4.9% 18.9% 11.6% 7.7%
24
• Strictly Private & ConfidentialAdjustments Reconciliation (Cont’d)
Adjusted EBITDA and Adjusted EBITDA margin reconciliation Three Months Ended December 31, Year Ended December 31,
2020 2019 2020 2019 2018
($ thousands)
GAAP revenues $ 411,506 $ 262,979 $ 1,385,951 $ 1,230,593 $ 1,088,205 (1) See ‘Adjusted cost of sales and gross margin reconciliation’ above for more details.
GAAP net income $ 183,330 $ 19,913 $ 312,861 $ 119,497 $ 50,437 (2) See ‘Adjusted selling, general and administrative expenses reconciliation’ above for more details.
Interest expense 1,149 1,893 6,742 8,636 955
Interest income (26) (108) (215) (601) (1,281)
Income tax expense (benefit) 119,907 13,693 105,882 175 (14,720)
Depreciation and amortization 7,368 6,705 27,619 24,213 29,250
Cost of sales adjustments (1) 1,550 3,329 6,701 11,485 -
Selling, general and administrative expenses adjustments (2) 20,850 1,173 41,736 2,871 21,100
Adjusted EBITDA $ 94,314 $ 19,212 $ 289,562 $ 165,926 $ 115,181
GAAP net income $ 183,330 $ 19,913 $ 312,861 $ 119,497 $ 50,437
GAAP net income margin 44.6% 7.6% 22.6% 9.7% 4.6%
Adjusted EBITDA $ 94,314 $ 19,212 $ 289,562 $ 165,926 $ 115,181
Adjusted EBITDA margin 22.9% 7.3% 20.9% 13.5% 10.6%
EBITDA and EBITDA margin reconciliation Year Ended December 31,
2017 2016
($ thousands)
GAAP revenues $ 1,023,513 $ 1,036,273
GAAP net income $ 10,238 $ (16,494)
Interest expense 869 836
Interest income (870) (692)
Income tax expense (benefit) (7,942) (9,281)
Depreciation and amortization 33,130 34,043
EBITDA $ 51,309 $ 26,974
GAAP net income $ 10,238 $ (16,494)
GAAP net income margin 1.0% (1.6)%
EBITDA $ 51,309 $ 26,974
EBITDA margin 5.0% 2.6%
Free cash flow reconciliation Year Ended December 31,
2020 2019 2018 2017 2016
($ thousands)
Cash provided by operating activities $ 266,902 $ 89,958 $ 114,162 $ 98,264 $ 39,754
Purchases of property, equipment, and software (42,033) (36,576) (11,979) (13,117) (22,194)
Free cash flow $ 224,869 $ 53,382 $ 102,183 $ 85,147 $ 17,560
25
• Strictly Private & ConfidentialAdjustments Reconciliation (Cont’d)
Definitions
Comparable Retail Store Sales: Reflects period over period change as if the current period results were in constant currency, which is a Non-GAAP
Financial Measure. Comparable store status is determined on a monthly basis. Comparable store sales include the revenues of stores that have been in
operation for more than twelve months. Stores in which selling square footage has changed more than 15% as a result of a remodel, expansion, or reduction
are excluded until the thirteenth month in which they have comparable prior year sales. Temporarily closed stores are excluded from the comparable store
sales calculation during the month of closure and in the same month in the following year. Location closures in excess of three months are excluded until the
thirteenth month post re-opening.
Direct-to-Consumer Comparable Sales: Includes retail and e-commerce. Reflects period over period change as if the current period results were in
constant currency, which is a Non-GAAP Financial Measure. Comparable store status is determined on a monthly basis. Comparable store sales include the
revenues of stores that have been in operation for more than twelve months. Stores in which selling square footage has changed more than 15% as a result
of a remodel, expansion, or reduction are excluded until the thirteenth month in which they have comparable prior year sales. Temporarily closed stores are
excluded from the comparable store sales calculation during the month of closure and in the same month in the following year. Location closures in excess of
three months are excluded until the thirteenth month post re-opening. E-commerce revenues are based on same site sales period over period.
26
• Strictly Private & ConfidentialYou can also read


