Influence of weather on cork-ring width - ANTONIA CARITAT,1 EMILIA GUTIÉRREZ2 and MARISA MOLINAS1,3
←
→
Page content transcription
If your browser does not render page correctly, please read the page content below
Tree Physiology 20, 893–900
© 2000 Heron Publishing—Victoria, Canada
Influence of weather on cork-ring width
ANTONIA CARITAT,1 EMILIA GUTIÉRREZ2 and MARISA MOLINAS1,3
1
Laboratori del Suro, University of Girona, Campus Montilivi, E-17071 Girona, Spain
2
Department of Ecology, University of Barcelona, Avinguda Diagonal 645, E-08028 Barcelona, Spain
3
Author to whom correspondence should be addressed
Received August 4, 1999
Summary Ring-width series of cork from Quercus suber L. an alternate system is followed in which only some trees are
Downloaded from http://treephys.oxfordjournals.org/ by guest on September 26, 2015
trees growing at two sites in Extremadura (southwestern stripped each season.
Spain) were analyzed in relation to monthly precipitation and Because most phellems do not show annual growth rings,
temperature, and to climatic indices combining both variables. little is known about interannual variability in phellem growth
Ring width of cork showed strong positive correlations with or about how climatic factors affect phellogen activity (Waisel
precipitation, especially during the fall and winter. Moderately 1995). Nevertheless, cork rings of Q. suber can be dated and
low temperatures were favorable for cork growth, except in subjected to climatic analysis. A previous study by Caritat et
winter and during the onset of phellogen activity. We conclude al. (1996b) established a 14-year cork-ring chronology and re-
that drought or temperature, or both, can limit cork growth dur- ported evidence of the influence of precipitation and tempera-
ing the annual drought period. ture on ring width variability of cork. The present study
extends this previous chronology and constructs a new one
Keywords: climatic variability, cork growth, cork-ring chro- from a different site in the same area. Both chronologies were
nology, dendroclimatology, phellogen activity, Quercus suber. analyzed in relation to precipitation, temperature and com-
bined climatic indices. The objectives were: (1) to determine
the influence of climate on the interannual pattern of ring-
Introduction width variability of cork, and (2) to analyze the relationship
Quercus suber L., which is well known for its cork production, between cork growth and climatic variables. The overall ob-
is an evergreen oak that grows on siliceous substrates and is jective was to assess to what extent summer drought affects
widely distributed in the western Mediterranean region. The cork growth in an area characterized by Mediterranean clima-
xerophytic character of the cork tree is seen in features such as tic conditions.
sclerophylly, the presence of a lignotuber (Molinas and Verd-
aguer 1993a, 1993b), litterfall pattern (Caritat et al. 1996a),
Materials and methods
and stomatal response to water deficit (Tenhunen et al. 1984,
Oliveira et al. 1992). In Q. suber, the cork cambium (phel-
Study area
logen) is a permanent layer that adds a new layer of cork to the
outer bark (phellem) of the tree each year. The phellogen usu- The two study sites, La Herguijuela (Campo Arañuelo,
ally becomes active in April and may remain active until the Cáceres) and Torre Sirgada (Jerez de los Caballeros, Badajoz),
end of October (Natividade 1950). Cork ring boundaries are were chosen for their different topographic conditions in
clearly demarcated because spring cells have thinner walls and Extremadura (southwestern Spain) (Table 1). At both sites, the
larger diameters than those formed later in the season. Cork cork woodland is a multipurpose forest or dehesa used for
from wild trees is deeply furrowed and irregular, making it dif- livestock and cork production. At La Herguijuela, the cork
ficult to identify the rings. However, the natural or wild cork trees are partially stripped each year, whereas at Torre Sirgada
must first be removed to obtain commercial cork, and the new cork-stripping campaigns take place every 2 years. At both
growth is much more uniform and forms more regular rings. sites, cork harvests occur at 10-year intervals.
Wild cork is removed when the tree is about 30 cm in diameter
(about 30–40 years old). Henceforth, commercial cork is re- Samples and data collection
moved each time the bark reaches at least 25 mm in thickness, Cork samples of 10 × 10 cm 2 were taken at breast height and in
resulting in harvest intervals (referred to as cork peel-off turns) the same southern orientation during the stripping of the trees.
of 8–14 years, depending on the area. The cork is harvested To observe the growth rings, the samples were boiled in water
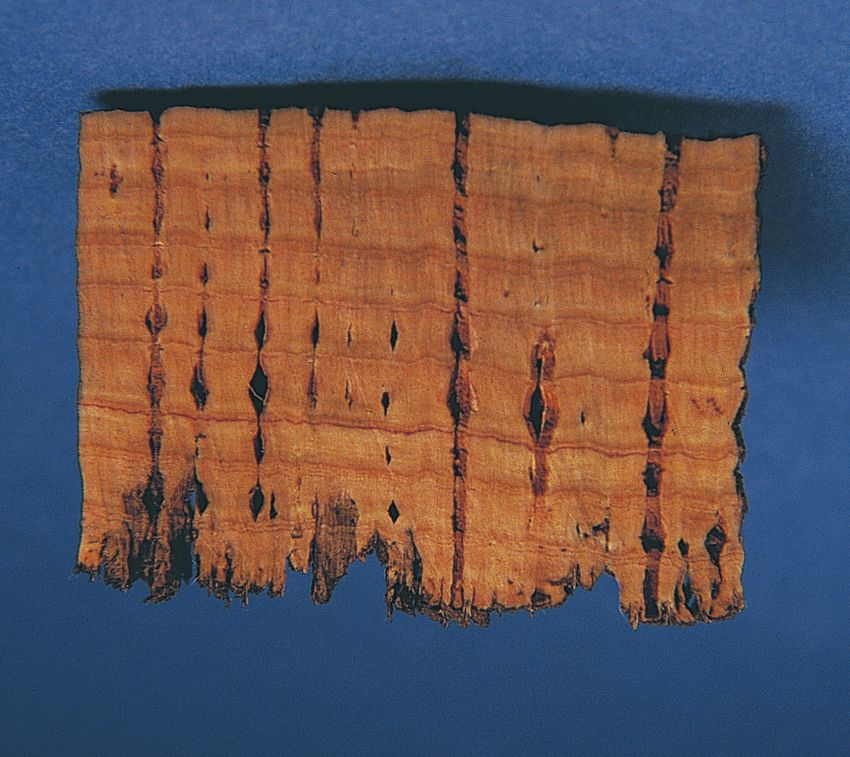
only during the season when the tree is in sap and the layers for about 45 min to prepare them for thin sectioning (Figure 1).
separate more easily, usually beginning in June and lasting un- Total bark thickness was measured, rings were counted and
til August. For a more regular distribution of the cork harvest, dated, and a visual synchronization was carried out. The wid-894 CARITAT, GUTIÉRREZ AND MOLINAS
Table 1. Topographical and forestry parameters of the La Herguijuela and Torre Sirgada sites in Extremadura (southwestern Spain).
Parameter La Herguijuela Torre Sirgada
Geographic coordinates 05°55′ W, 39°6′ N 06°50′ W, 38°23′ N
Altitude (m a.s.l.) 300–400 500–600
Annual precipitation (mm)1 777.5 606.2
Soil parent material Alluvial debris Shale
Slope (%) 5–7 20
Tree age (range, years) 150–170 25–160
Tree density (ha –1)2 30 57
Tree height (mean ± SD, m)2 6.89 ± 0.95; n = 15 8.91 ± 2.20; n = 18
DBH (mean ± SD, cm)2 62 ± 4; n = 15 69 ± 15; n = 18
Bifurcation height (mean ± SD, m)2 2.47 ± 0.20; n = 15 3.24 ± 1.25; n = 18
Cork ring width (range, mm) 1.85–5.25 1.95–4.70
Cork ring width (mean ± SD, mm) 3.30 ± 0.96 3.56 ± 0.95
Shrub stratum No shrub stratum present Low shrub stratum with Cistus salvifol-
ius L. and C. crispus L.
Downloaded from http://treephys.oxfordjournals.org/ by guest on September 26, 2015
Herbaceous stratum Annual grasses with Tuberarietalia guttatae Annual grasses with Aegylops genicul-
(L.) Fourr. being the most abundant species. ata, Plantago sp. and Briza maxima L.
equally abundant.
1
Annual precipitation for the period 1979–1995.
2
Values for mature trees under cork extraction.
est and narrowest rings were used as markers. The initial and of the records, climatic series from Malpartida were checked
final rings were rejected as being associated with incomplete against Salto de Torrejón (220 m a.s.l., 0.5 km from La Herg-
growth periods. For each cork sample, cork-ring series were uijuela); the series from Jerez de los Caballeros were checked
identified along three radii. Ring widths of the cork were mea- against Valencia de Mombuey (297 m a.s.l.) and Fregenal de
sured with a 10× binocular microscope equipped with a mi- la Sierra (580 m a.s.l.), located 25 and 16 km from Tore
crometer scale.
Climatic data were obtained from nearby weather stations
belonging to the Centro Metereológico Territorial de Extrem-
adura (Spain). Precipitation and temperature series from the
Malpartida weather station (23 km from the La Herguijuela
site) and from Jerez de los Caballeros station (10 km from the
Torre Sirgada site) were used (Figure 2). To assure the quality
Figure 2. Climate diagrams for the study period (1979–1995) for
Malpartida (Campo Arañuelo, Cáceres) and Jerez de los Caballeros
(Badajoz). Symbols: 䊊, temperature; 䊉, precipitation. Note the
occurrence of the drought season in summer and to a lesser extent in
spring. Note the marked drop in precipitation at the beginning of the
Figure 1. Cork specimen from La Herguijuela, Cáceres, Spain. Note summer drought season in La Herguijuela. Temperature and precipi-
the presence of cork rings of different width. tation values at the top of the graphs are mean values.
TREE PHYSIOLOGY VOLUME 20, 2000SENSITIVITY OF CORK GROWTH TO CLIMATE 895
Sirgada, respectively. Pearson correlation coefficients (r) be- other indices designed to unmask the effects of water deficits
tween the monthly climatic variables of Malpartida and Jerez on cork growth. These indices were formed by using precipita-
were significant for precipitation (r = 0.84, P < 0.001, n = 17) tion in periods with high positive effect (see Table 2) divided
and temperature (r = 0.63, P < 0.01, n = 17). by temperatures with high negative effect (spring or summer
months) or divided by combinations made by subtracting tem-
Cork-ring series and data analysis peratures with positive effect (usually April or May) from
temperatures with high negative effect. Multiple linear regres-
To establish the mean ring width chronology of the cork for
sion analysis was also used to assess the relative predictive ca-
each site, we obtained mean harvest-year series and then over-
pabilities of climatic independent variables.
lapped and averaged the successive harvest-year series. To ob-
tain a mean harvest-year series, a cork growth curve was built
for each sampled tree and the individual series were compared Results
with each other using multiplot representations for visual cor-
roboration (Cook and Kairiukstis 1990). The Pearson correla- Chronologies
tion coefficient (r) between the series was calculated to verify At both sites, the individual tree series in each harvest year
synchronization and the series showing statistically signifi- were closely correlated with one another (La Herguijuela
cant coefficients were averaged. For La Herguijuela, six har-
Downloaded from http://treephys.oxfordjournals.org/ by guest on September 26, 2015
mean r ± SD = 0.81 ± 0.08, P < 0.05; Torre Sirgada = 0.74 ±
vest-year series (1989, 91, 93, 94, 95 and 96) were overlapped. 0.09, P < 0.05). The correlation coefficients between sites for
The 93 series was formed from 46 out of 57 individual-tree se- the overlapping years were r = 0.703 (n = 13 years in common,
ries (Caritat el al. 1996b). The 89, 91, 94, 95 and 96 series were P < 0.01) for growth indices and r = 0.678 (n = 13, P < 0.02)
formed from 13 out of 15, 11 out of 13, 5 out of 10, 9 out of 12, for ring width.
and 10 out of 13 individual series, respectively. For Torre Sir- The range of ring widths (Table 1) was typical of mature
gada, three harvest-year series (1989, 92 and 95) were over- cork trees (100–150 years old) in the dehesa of southwestern
lapped. At this site, the 89 and 92 series were formed from four Spain (Caritat et al. 1996b), and comparable with wood-ring
out of 10 individual series and the 95 series was formed from chronologies established in other regions of Spain (Pérez-
eight out of 12 individual series. A series was selected if its co- Antelo 1994, Gutiérrez et al. 1998). Generally, the years of
efficient of correlation (Pearson’s r) was significant at P < maximum and minimum cork growth were common to both
0.05. sites (r = 0.678, P < 0.02) (Figure 3). Interannual variability in
Cork-ring chronologies showed a decreasing trend in ring cork growth indices, as measured by the mean sensitivity coef-
width with time that was attributed to aging (Natividade ficient MSx (Fritts 1976), was high. The MSx was 0.185 (RW)
1950). To minimize this effect and maximize the interannual and 0.167 (GI) for trees at La Herguijuela, and 0.222 (RW)
fluctuations due to climate, each series of raw data was stan- and 0.214 (GI) for trees at Torre Sirgada.
dardized by means of the empirical growth function: Yt =
atbe –ctEt, where Yt = ÿt E t, where Yt is the actual measurement of Response to precipitation
ring width (RW), ÿt is the estimated value, and E t is the resid-
The effects of monthly precipitation on cork growth indices
ual or remainder, called growth index (GI) in dendro-
are given in Figure 4. Most correlation coefficients were not
chronological studies (a, b and c = constants; t = time) (Warren
significant; however, precipitation in January had a significant
1980). The standardized series of growth indices were as-
positive effect at both sites, and precipitation in June and July
sumed to be constant with respect to the mean and variance.
had a positive effect that was significant at La Herguijuela.
Precipitation in October showed a negative correlation that
Effect of climate on cork rings was significant at Torre Sirgada. However, because October
The influence of climatic factors on the interannual pattern of rainfall is thought to contribute to cork growth, we tested its
ring width was measured by means of the Pearson correlation correlation with growth indices of the following year (t + 1)
coefficient (r). The relationship between cork growth and cli- and found a positive correlation at both sites that was signifi-
matic factors was analyzed by means of paired analyses and cant at La Herguijuela. The responses to accumulated precipi-
bivariate scatterplots in which ring width (RW) or growth in- tation over certain months were more striking than the effect
dex (GI) was used as the dependent variable. The mathemati- of monthly precipitation, especially for trees at La Hergui-
cal functions showing the best fit were then selected. The juela. The highest correlations were obtained when rainfall
Bonferroni method (Sokal and Rohlf 1995) was used to limit from autumn and winter months of the preceding year was
the overall experimental error rate. The climatic variables con- added to that of the spring and summer of the current year (Ta-
sidered were monthly precipitation (mm), precipitation accu- ble 2). As shown in Figure 5, cork growth was synchronous
mulated during selected periods, mean monthly temperature with accumulated precipitation. A shift in the mean amount of
(Tm), mean maximum temperature (Tx-M), the mean minimum precipitation occurred in 1989, and this shift was also ob-
temperature (Ti-M), absolute maximum temperature (Tmax), and served in the cork series, most strikingly in the ring-width
absolute minimum temperature (Tmin). We also considered the chronologies.
drought index formed by the quotient between annual precipi- The scatterplots pairing ring-width data with accumulated
tation and mean annual temperature (P/T + 10) and several precipitation showed a strong and positive relationship that
TREE PHYSIOLOGY ON-LINE at http://www.heronpublishing.com896 CARITAT, GUTIÉRREZ AND MOLINAS
Table 2. Pearson correlation coefficients (r) between annual cork growth indices (GI) and ring width (RW) and the accumulated mean monthly
precipitation for certain periods. Asterisks indicate statistically significant coefficients (* = P < 0.05, ** = P < 0.01, and *** = P < 0.001). (The
Bonferroni adjusted α was 0.0045).
Period of precipitation La Herguijuela (n = 17) Torre Sirgada (n = 13)
RW GI RW GI
January to June 0.666* 0.796*** 0.088 0.345
January to December 0.437 0.351 0.011 –0.137
February to April 0.163 0.150 0.149 0.147
March to June 0.464 0.481 –0.406 –0.237
May to September 0.572* 0.668** –0.244 –0.141
June to September 0.677** 0.454 –0.098 –0.123
November (t – 1) to June 0.705** 0.691** 0.528 0.538
November (t – 1) to July 0.746*** 0.725*** 0.545 0.544**
November (t – 1) to September 0.781*** 0.721** 0.598* 0.691**
October (t – 1) to June 0.572* 0.712* 0.314 0.684**
Downloaded from http://treephys.oxfordjournals.org/ by guest on September 26, 2015
October (t – 1) to September 0.668** 0.770*** 0.395 0.757**
October (t – 1) to December (t – 1) 0.285 0.384 0.320 0.566*
was generally linear (Figures 6a, 6b and 6d). However, there Figure 8 depicts selected examples of bivariate analysis of
was a nonlinear relationship between ring width and accumu- temperature and cork growth indices. The relationship with
lated precipitation from November (t – 1) to June (t) at Torre November Tmin showed a gradual decrease in cork growth as
Sirgada (Figure 6c), indicating that, after a threshold amount temperature increased (Figure 8b). In the scatterplot that
of precipitation, the increase in ring width decreased with fur-
ther increases in precipitation.
Response to temperature
Temperature responses were built using the growth indices to
minimize the effect of precipitation. The correlation coeffi-
cients with monthly temperatures were low, being mostly neg-
ative and not statistically significant (Figure 4). There was a
high negative correlation for almost all March temperatures,
which was significant for Ti-M in trees at Torre Sirgada. The
negative effect of March temperatures on the cork growth in-
dices might be attributed to the early spring dry period that
usually occurs in March in this area (Figure 2). The general in-
verse relationship between cork growth and temperature was
more pronounced in trees at Torre Sirgada than at La
Herguijuela (Figure 7). At Torre Sirgada, cork growth was
lowest in 1993 when March Ti-M was highest. At La Herg-
uijuela, cork growth was highest when July Tm reached its
minimum value for the study period (1987 and 1988).
Figure 4. Response of cork growth indices to precipitation (P) and
temperature (T ) based on Pearson correlation coefficients (r) at La
Herguijuela (n = 17 years, 1979–95) and at Torre Sirgada (n = 13
years, 1982–94). Symbols: 䊊, Tm, monthly mean; ⵧ, Tmin, absolute
minimum; 䉭, Tmax, absolute maximum; 䉮, Ti-M, mean minimum; 䉫,
Tx-M, mean maximum temperatures. Asterisks indicate statistically
Figure 3. Cork growth indices from La Herguijuela and Torre Sirgada. significant correlation coefficients (P < 0.05).
TREE PHYSIOLOGY VOLUME 20, 2000SENSITIVITY OF CORK GROWTH TO CLIMATE 897
even if precipitation was high. The nonlinear relationship with
March Ti-M at Torre Sirgada indicates that cork growth rate
was almost constant between 5 and 7 °C, but decreased at
higher temperatures (Figure 8c).
Joint effect of precipitation and temperature
The correlation coefficients between cork growth and the
drought index, P/T + 10, were low and not significant. How-
ever, for the indices designed to emphasize soil water deficits,
the correlation coefficients for the drought index were usually
greater than those for precipitation or temperature considered
separately (Figure 9). In general, the relationship followed a
common pattern that fitted the function Y = ax b (Figures 9b–f).
However, in one case it was a linear relationship (Figure 9a),
indicating that, at La Herguijuela, cork growth was propor-
Downloaded from http://treephys.oxfordjournals.org/ by guest on September 26, 2015
tional to an increase in accumulated precipitation for the Janu-
ary to June period, or to a decrease in July Tmax. The most
common nonlinear behavior was caused by the limiting effect
of precipitation or temperature. If temperature was high com-
pared with precipitation, a narrow ring was formed even if pre-
Figure 5. Series of ring widths of cork (䊉) and growth indices (䊏) in
cipitation was abundant. Years with such behavior differed
relation to accumulated precipitation (䊊) at La Herguijuela. (a) Pre-
cipitation from November (t – 1) to June (t), and (b) from January to between the two sites because of small local climatic differ-
June. ences.
The relationship between annual cork growth and the inde-
pendent climatic variables, precipitation and mean tempera-
ture, exhibited adjusted R 2 values of 0.66 (La Herguijuela) and
paired cork growth indices and July Tm at La Herguijuela, an 0.64 (Torre Sirgada). The relationship was explained by the
exponential pattern emerged when the boundary points (cir- equations: GR = 0.519 + 0.00152P1–9 for La Huerguijuela and
cled dots) were selected (Figure 8a). There was a marked de- GR = –0.024 + 0.00109P11–9 + 0.035T3 for Torre Sirgada,
crease in cork growth when the temperature was above 28 °C, where GR is annual cork growth, P1–9 is precipitation from
Figure 6. Relationship between
cork ring width (RW) and pre-
cipitation. Scatterplots for the
periods (a) January to June and
(b) November (t – 1) to Sep-
tember (t) at La Herguijuela;
and (c) November (t – 1) to
June and (d) November to Sep-
tember at Torre Sirgada. The
goodness of fit, R 2, and the sig-
nificance level, P, are given in
each figure.
TREE PHYSIOLOGY ON-LINE at http://www.heronpublishing.com898 CARITAT, GUTIÉRREZ AND MOLINAS
Downloaded from http://treephys.oxfordjournals.org/ by guest on September 26, 2015
Figure 7. Series of ring widths of cork (䊉) and growth indices (䊏) in
relation to temperature (䊊). (a) Monthly mean July temperature (Tm)
for La Herguijuela, and (b) March mean minimum temperature (Ti-M)
for Torre Sirgada.
January to September, P11–9 is precipitation from November of
the previous year to September and T3 is the mean temperature
in March.
Discussion
Cork cambium dynamics are sensitive to climatic factors.
Cork-ring growth was high in rainy years (Figure 5) and dur- Figure 8. Paired relationships between growth indices and (a)
ing years in which temperature was moderately low (Figure 7). monthly mean July temperature (Tm) and (b) absolute minimum No-
The decrease in precipitation recorded after 1989 at La Her- vember temperature (Tmin) at La Herguijuela; and (c) mean minimum
guijuela and the increase in March Ti-M recorded after 1984 at March temperature (Ti-M) at Torre Sirgada. The goodness of fit, R 2,
Torre Sirgada could explain the trend of decreasing cork and the confidence level, P, are given in each figure. In (a), the circled
points indicate the values used to fit the exponential function. Uncir-
growth with time at both sites. The ring-width series were
cled points correspond to narrow rings formed in years in which July
more affected by long-term changes caused by precipitation, Tm was lower than 28 °C but precipitation was low (the narrowest one
whereas the series of growth indices were more affected by corresponds to 1983). Narrow rings were also formed in years in
inter-annual variability caused by temperature. which precipitation was higher but the temperature was above the
Precipitation exerted a large positive influence on cork 28 °C threshold, such as in 1989 and 1992.
growth and drought was a limiting factor, indicating the im-
portance of the water holding capacity of the soil. Precipitation
during November and December always had a positive influ- Temperature generally exerted a negative effect on cork
ence on cork growth in the following year. October appeared growth, which is typical for trees growing in a Mediterranean
to be a transitional month, probably because phellogen be- climate. Moderately low temperatures enhanced cork growth,
comes dormant at this time. Differences in precipitation be- except in January and February and at the onset of phellogen
tween sites could account for the higher sensitivity of cork activity (April to May). During this latter period, cork growth
growth to climate in trees at La Herguijuela than at Torre was stimulated by an increase in temperature, but later in the
Sirgada. There was more late autumn and winter precipitation season high temperatures slowed cork growth until the begin-
and more severe drought in the late spring at La Herguijuela ning of autumn. The significantly negative coefficients of the
than at Torre Sirgada (Figure 2). At Torre Sirgada, cork late autumn and winter temperatures (Figure 4) could be re-
growth was less restricted by lack of water (Figure 4). A satu- lated to carbon balance, because respiration rate can exceed
ration effect of soil water content could explain the nonlinear photosynthetic rate at this time of year (Edwards and Hanson
relationship between cork growth and precipitation during the 1996).
November to June period at this site (Figure 6c). At La Herguijuela, summer temperatures showed the high-
TREE PHYSIOLOGY VOLUME 20, 2000SENSITIVITY OF CORK GROWTH TO CLIMATE 899
Figure 9. Examples of the rela-
tionships between cork growth
indices (GI) and different cli-
matic indices: (a) quotient of
precipitation from January to
June and July Tmax; (b) quotient
of precipitation from November
Downloaded from http://treephys.oxfordjournals.org/ by guest on September 26, 2015
(t – 1) to September (t) and July
Tmax; (c) quotient of precipita-
tion from November (t – 1) to
September (t) and July Tmax mi-
nus May mean minimum tem-
perature (Ti-M); (d) quotient of
precipitation from January to
June and March Ti-M; (e) quo-
tient of precipitation from No-
vember (t – 1) to September (t)
and August Tmax minus May
Ti-M; and (f) quotient of precip-
itation from November to Sep-
tember and March Ti-M. Ti-M,
mean minimum; Tmax, absolute
maximum temperature.
est correlation coefficients. This, together with the positive ef- tation, or both, are unfavorable during their development per-
fect of precipitation in June and July, indicates that cork iod.
growth was restricted by temperatures above 28 °C or by the For the Mediterranean basin region, dendroclimatology has
lack of water, or both (Figures 2 and 7). The effect of tempera- been performed for beech (Gutiérrez 1988), some pine species
ture was less pronounced at Torre Sirgada than at La (Gutiérrez 1989) and a few deciduous oaks (Serre-Bachet
Herguijuela. At Torre Sirgada, cork-ring growth was con- 1982, Tessier et al. 1994). These dendroclimatological studies
trolled more by high temperatures during winter and at the be- have demonstrated that summer drought is the main factor
ginning of the growing period (Figure 4). The positive limiting wood ring growth. The wood rings of evergreen oaks
temperature effect observed in April at La Herguijuela was (Quercus ilex L. and Q. suber), the predominant tree species in
probably equivalent to the positive effect observed in May at the Mediterranean forest communities (Specht 1988), are hard
Torre Sirgada. This could indicate a certain delay in the activa- to identify. Few dendroclimatological data are available
tion of the phellogen that may be partially attributable to the (Liphschitz and Lev-Yadun 1986, Zhang and Romane 1991,
higher altitude of the La Herguijuela site. A similar delay was Oliveira et al. 1994, E. Gutiérrez, unpublished data). These
observed for the July and August temperatures (Figure 4). data suggest that cambial activity is highly sensitive to sum-
To understand cork growth, the effects of precipitation and mer precipitation and, as well as during the winter dormant pe-
temperature should be considered together (Figure 9). The riod, can be interrupted several times during the year, resulting
variance explained by drought indices is higher than that ex- in the formation of false rings. However, in semi-arid regions
plained by precipitation or temperature alone, except for July dominated by extensive cork woodlands and dehesas, as for
Tm, which appears to be the most restrictive factor during the example, certain areas in the south of the Iberian peninsula and
growing period at La Herguijuela (Figure 8). Multiple linear in northern Africa, drendrochronology of cork (subero-
regression analysis corroborated the general trends observed, chronology) could provide additional information. A practical
especially the relationship with precipitation. In years of se- application would be for the analysis and prediction of forest
vere summer drought, cork trees can lose all their leaves (Nati- decline due to anthropogenically induced climatic change. A
vidade 1950). Also, acorns can abort if temperature or precipi- detailed knowledge of how climate influences cork production
TREE PHYSIOLOGY ON-LINE at http://www.heronpublishing.com900 CARITAT, GUTIÉRREZ AND MOLINAS
and quality would aid in the management of this important Lisphschitz, N. and S. Lev-Yadun. 1986. Cambial activity of ever-
Mediterranean forest resource. Furthermore, a model could be green and seasonal dimorphics around the Mediterranean. Int.
built for a given area to predict cork growth. We could, there- Assoc. Wood Anatomist Bull. 7:145–153.
Natividade, V. 1950. Subericultura. Direcçao General dos Serviços
fore, adjust the timing of the cork-harvest years in accordance
Florestais e Aquicolas, Lisboa, pp 83–170.
with the growth predicted from the interannual variations of
Molinas, M. and D. Verdaguer. 1993a. Lignotuber ontogeny in the
precipitation and temperature. cork-oak (Quercus suber; Fagaceae). I. Late embryo. Am. J. Bot.
80:172–181.
Acknowledgments Molinas, M. and D. Verdaguer. 1993b. Lignotuber ontogeny in the
cork-oak (Quercus suber; Fagaceae). II. Germination and young
Members of the Forestry Section of the Instituto para el Corcho, la seedling. Am. J. Bot. 80:182–191.
Madera y el Carbón, Junta de Extremadura, Ap. 437, E-06800 Oliveira, G., O.A. Correira, M.A. Martins-Louçao and F.M. Catarino.
Mérida, Spain, have collaborated in the selection of the sites, in sam- 1992. Water relations of cork-oak (Quercus suber L.) under natural
ple and data collection and discussion of the results, and should be conditions. Vegetatio 99/100:199–208.
considered co-authors of this paper. Dr. Miguel Elena (Institute direc- Oliveira, G., O. Correira, M.A. Martins-Louçao and F.M. Catarino.
tor) and Dr. Enrique Cardillo deserve particular acknowledgement. 1994. Phenological and growth patterns of the Mediterranean oak
The authors thank the owners of La Herguijuela for their kind collabo- Quercus suber L. Trees 9:41–46.
ration and Dr. Emili Garcia-Berthou for his help in the preparation of Pérez Antelo, A. 1994. Nota de revisión de la investigación dendro-
Downloaded from http://treephys.oxfordjournals.org/ by guest on September 26, 2015
the manuscript. cronológica en España. Investigación Agraria, Sistemas y Re-
cursos Forestales 3:221–235.
Serre-Bachet, F. 1982. Analyse dendroclimatologique comparée de
References quatre espècies de pins et du chene pubescent dans la région de la
Caritat, A., M. Molinas and E. Gutiérrez. 1996a. Annual cork-ring Gardiole prés Rians (Var, France). Ecol. Medit. 8:167–183.
width variability of Quercus suber L. in relation to temperature and Specht, R.L. 1988. Natural vegetation—ecomorphological charac-
precipitation (Extremadura, southwestern Spain). For. Ecol. ters. In Mediterranean-Type Ecosystems: A Data Source Book. Ed.
Manage. 86:113–120. R.L. Specht. Kluwer Academic Publishers, Dordrecht, pp 14–61.
Caritat, A., G. Bertoni, M. Molinas, M. Oliva and A. Dominguez- Sokal, R.R. and F.J. Rohlf. 1995. Biometry. The principles and prac-
Planella. 1996b. Litterfall and mineral return in two cork-oak for- tice of statistics in biological research. Freeman, New York, 887 p.
ests in northeast Spain. Ann. Sci. For. 53:1049–1058. Tessier, L., P. Nola and F. Serre-Bachet. 1994. Deciduous Quercus in
Cook, E.R. and L.A. Kairiukstis. 1990. Methods of dendrochron- the Mediterranean region: tree-ring/climate relationships. New
ology. Applications in the environmental sciences. Kluwer Aca- Phytol. 126:355–367.
demic Publishers, Dordrecht, pp 3–19. Tenhunen, J.D., O.L. Lange, J. Gebel, W. Beyschlag and J. A.Weber.
Edwards, N.T. and P.J. Hanson. 1996. Stem respiration in a closed 1984. Changes in photosynthetic capacity, carboxylation effi-
canopy upland oak-forest. Tree Physiol. 16:433–439. ciency and CO2 compensation point associated with midday
Fritts, H.C. 1976. Tree rings and climate. Academic Press, New stomatal closure and midday depression of net CO2 exchange of
York, 576 p. leaves of Quercus suber. Planta 162:193–203.
Gutiérrez, E. 1988. Dendroecological study of Fagus silvatica L. in Waisel, Y. 1995. Developmental and functional aspects of the
the Montseny mountains (Spain). Acta Oecol. Oecol. Plant. 9: periderm. In The Cambial Derivatives. Ed. M. Iqbal. Encyclo-
301–309. paedia of Plant Anatomy, Gebrüder Borntraeger, Berlin, pp
Gutiérrez, E. 1989. Dendroclimatological study of Pinus sylvestris L. 293–311.
in southern Catalonia (Spain). Tree-Ring Bull. 49:1–9. Warren, W.G. 1980. On removing the growth trend from dendro-
Gutiérrez, E., J.J. Camarero, J. Tardiff, O. Bosch and M. Ribas. 1998. chronological data. Tree-Ring Bull. 40:35–44.
Tendencias recientes del crecimiento y la regeneración en bosques Zhang, S.H. and F. Romane. 1991. Variations de la croissance radiale
subalpinos del Parque Nacional de Aigüestortes. Ecologia 12: de Quercus ilex L. en function du climat. Ann. Sci. For. 48:
75–84. 225–234.
TREE PHYSIOLOGY VOLUME 20, 2000You can also read