FINANCIAL BUNDLING AND PRODUCT SWITCHING IN BANKING - CANADA, MARCH 2019
←
→
Page content transcription
If your browser does not render page correctly, please read the page content below

FINANCIAL BUNDLING AND
PRODUCT SWITCHING IN
BANKING
CANADA, MARCH 2019
NEXT 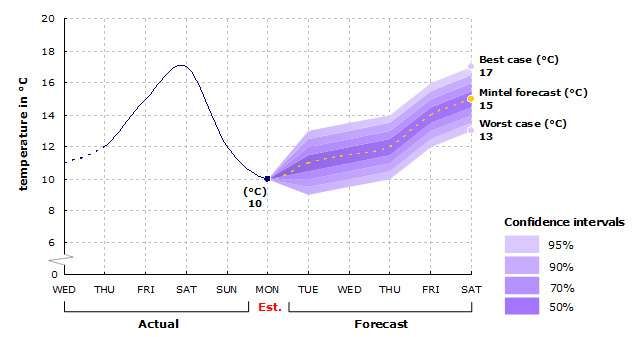
FINANCIAL BUNDLING AND PRODUCT SWITCHING IN BANKING - CANADA - MARCH 2019 2
OVERVIEW
Financial institutions (FIs) are always strategizing on ways to ‘Big bank’ definitions
increase customer share of wallet and build loyalty in the staid
world of Canadian retail banking. The Canadian consumer • The ‘‘big five’’ refers to TD Canada Trust, RBC Royal Bank,
banking industry is dominated by the five major banks, but there is Scotiabank, CIBC and BMO.
strong competition, not only among them, but from smaller virtual
banks, regional banks and credit unions. However, in this highly • The ‘‘big six’’ include all of the ‘‘big five’’ plus National Bank.
competitive market, banks cannot stand still. Digital banking and
the advent of Fintech require Canadian banks to stay focussed on Regional classifications
providing an excellent customer experience. Banks need to meet
the basic needs of their customers, but beyond that they need • Prairie Provinces: Alberta, Saskatchewan and Manitoba.
to know their customers, reward their loyalty and enable them to
interact in a seamless way. • Atlantic Provinces: New Brunswick, Newfoundland/Labrador,
Nova Scotia and Prince Edward Island.
The use of incentives to encourage multiple product ownership
and switching are important methods of building wallet share and Income
acquiring new customers. This Report covers consumer attitudes
and behaviour related to product bundling and switching in • Throughout the Report, income data refers to annual household
Canadian consumer banking. It explores the competitive landscape income.
of the major banks, switching intention of consumers, incentives
to switch, choice factors, switching and bundling behaviours and
attitudes related to bundling and incentives.
PREVIOUS © Mintel Group Ltd. All rights reserved. NEXT FINANCIAL BUNDLING AND PRODUCT SWITCHING IN BANKING - CANADA - MARCH 2019 3
REPORT CONTENT
OVERVIEW
‘Big bank’ definitions
Regional classifications
Income
EXECUTIVE SUMMARY
The issues
TD and RBC are the leading choices
Figure 1: Choice of main FI, December 2018
Tangerine is the top alternative choice
Figure 2: Switching choice of main FI, December 2018
Lower chequing fees and higher savings interest are the top switching influencers
Figure 3: Interest in incentives to switch (any rank), December 2018
Rewards programs will encourage more cross-sell
Figure 4: Interest in incentives to buy more products, December 2018
The opportunities
Having multiple products at one bank discourages switching
Figure 5: Attitudinal statements relating to loyalty in banking, December 2018
Bundling discounts have wide appeal
Figure 6: Attitudinal statements relating to loyalty (select), 18-44s vs over-45s, December 2018
Branches continue to play an important relationship building role
Figure 7: Attitudes about customer relationships in banking, December 2018
Digital banks mainly used as a supplemental bank
Figure 8: Attitudes about digital banks, Simplii Financial and Tangerine, December 2018
What it means
KEY PLAYERS
WHAT YOU NEED TO KNOW
Impact of new consumer protection legislation on banks
Meridian Credit Union clears key hurdle to launching new national bank
Coast Capital Savings approved to become BC’s first federal credit union
Meridian Credit Union launches “Price Drop”
Borrowell launches first free AI powered credit coaching tool
Bankers association says Canada needs a digital ID system
REGULATORY DEVELOPMENTS
Impact of new consumer protection legislation on banks
Naming and shaming
Whistleblower protections
Sales tactics
Regulatory relief
Meridian Credit Union clears key hurdle to launching new national bank
Coast Capital Savings approved to become BC’s first federal credit union
INDUSTRY DEVELOPMENTS & INNOVATIONS
Meridian Credit Union launches “Price Drop”
Borrowell launches first free AI powered credit coaching tool
MasterCard to drop its name from logo
Bankers association says Canada needs a digital ID system
RBC launches new accelerator programme
PREVIOUS © Mintel Group Ltd. All rights reserved. NEXT FINANCIAL BUNDLING AND PRODUCT SWITCHING IN BANKING - CANADA - MARCH 2019 4
MARKETING INITIATIVES
Simplii Financial launches first-ever campaign
Figure 9: Choosing Simplii Financial means your banking is one less thing to juggle, September 2018
HSBC gets opera singers to pitch its services
Figure 10: HSBC Bank Canada | Don’t let your banking become a tragedy, November 2018
CIBC adds a personal touch to its multicultural marketing
PayPal debuts Xoom in Canada
Figure 11: Paypal money go Xoom, December 2018
Meridian Credit Union making more inroads in the GTA
BMO launching new financial-crimes unit
BUNDLING AND SWITCHING INITIATIVES
Scotia’s Momentum Rewards Bundle
Figure 12: Scotiabank’s Momentum banking bundle, September 2017
RBC VIP Banking bundle and new account offer
Other Banking Bundles
Switching offers for New Customers
THE CONSUMER
WHAT YOU NEED TO KNOW
TD and RBC are the leading choices
Tangerine is the top alternative choice
Lower chequing fees and higher savings interest are the top switching influencers
No-fee banking is the main selling feature of digital banks
Rewards programs will encourage more cross-sell
Around two in three consumers would recommend their main FI
Having multiple products at one bank discourages switching
CHOICE OF MAIN FI
TD and RBC are the leading choices
Figure 13: Choice of main FI, December 2018
Significant regional differences in market penetration of banks
Figure 14: Choice of main FI choices (select), Atlantic Canada vs Quebec, August 2016
One in four Asian Canadians considers TD as their main FI
Figure 15: Choice of main FI, Asian Canadians vs overall population, December 2018
SWITCHING CHOICE OF MAIN FI
Tangerine is the top alternative choice
Figure 16: Switching choice of main FI, December 2018
TD and Scotia are top switching choices of younger consumers
Figure 17: Switching choice of main FI (select), 18-44s vs over-45s, December 2018
INCENTIVES TO SWITCH
Lower chequing fees and higher savings interest are the top switching influencers
Figure 18: Interest in incentives to switch (any rank), December 2018
Men value full range of products and digital capabilities more
Figure 19: Select interest in incentives to switch (any rank), by gender, December 2018
Higher interest rates matter more to older consumers
Figure 20: Select interest in incentives to switch (any rank), 18-44s vs over-45s, December 2018
Lower fees matter less to over-55s
Figure 21: Interest in incentives to switch (rank #1), by age, December 2018
DIGITAL BANKS
No-fee banking is the main selling feature of digital banks
Figure 22: Attitudes about digital banks, December 2018
35-54s more enthused about digital banks
Figure 23: Attitudes about digital banks, by age, December 2018
PREVIOUS © Mintel Group Ltd. All rights reserved. NEXT FINANCIAL BUNDLING AND PRODUCT SWITCHING IN BANKING - CANADA - MARCH 2019 5
Men more likely to be attracted by high interest savings accounts
Figure 24: Attitudes about digital banks, by gender, December 2018
Digital banks mainly used as a supplemental bank
Figure 25: Attitudes about digital banks, Simplii Financial and Tangerine customers, December 2018
INCENTIVES TO INCREASE SHARE OF WALLET
Rewards programs will encourage more cross-sell
Figure 26: Interest in incentives to buy more products, December 2018
Over-55s generally less interested in incentives
Figure 27: Interest in incentives to buy more products (select), by age, December 2018
Higher income earners more interested in most incentives
Figure 28: Interest in incentives to buy more products, HHI under $50K vs over $50K, December 2018
Financially stressed parents with young children more interested in incentives
Figure 29: Interest in incentives to buy more products (select), by parental status, December 2018
TURF Analysis
Methodology
Rewards and a price matching program would appeal to around 60%
Figure 30: TURF Analysis – cross-sell incentives, December 2018
CUSTOMER RELATIONSHIPS
Around two in three consumers would recommend their main FI
Figure 31: Attitudes about customer relationships in banking, December 2018
Figure 32: Agreement with statement “I would recommend my main bank/credit union to a friend/family member”, by select FIs, December 2018
Around seven in ten have a good relationship with their local branch
Figure 33: Agreement with statement “I have a good relationship with my local bank/credit union”, 18-44s vs over-45s, December 2018
Desjardins and RBC customers appear to have a stronger relationship
Figure 34: Agreement with statement “I have a good relationship with my local bank/credit union”, Desjardins customers vs overall, December 2018
Branches continue to play an important relationship building role
LOYALTY
Having multiple products at one bank discourages switching
Figure 35: Attitudinal statements relating to loyalty in banking, December 2018
Bundling discounts have wide appeal
Figure 36: Attitudinal statements relating to loyalty (select), 18-44s vs over-45s, December 2018
Young men more likely to contemplate switching
Figure 37: Attitudinal statement relating to switching, by age and gender, December 2018
APPENDIX
DATA SOURCES AND ABBREVIATIONS
Data sources
Consumer survey data
Abbreviations and terms
PREVIOUS © Mintel Group Ltd. All rights reserved. NEXT FINANCIAL BUNDLING AND PRODUCT SWITCHING IN BANKING - CANADA - MARCH 2019 6
DATABOOK CONTENT
Standard demographics you can expect to see tracked in our Databooks:
• Age and income
• Age
• Area
• Born in Canada
• Children in household
• Education
• Employment
• Family structure
• Financial situation
• Gender and age
• Gender and marital status
• Gender
• Generation
• Household income
• Household size
• Housing situation
• Language primarily spoken in the home
• Marital status
• Mobile device ownership
• Number of children of any age in household
• Number of children under 18 in household
• Parental status by gender
• Parental status
• Race and origin
• Race
• Region
• Sexual orientation
• Social media
• Visit social media websites daily
• Visit social media websites weekly
Consumer Research
Q1 Choice of Main FI
Q1 Choice of Main FI, by demographics
Q2 Incentives to increase share of wallet
Q2 Incentives to increase share of wallet, by demographics
Q3 Incentives to switch
Q3 Incentives to switch, by demographics
Q4 Incentives to switch
Q4 Incentives to switch, by demographics
Q5 Switching choice of Main FI
Q5 Switching choice of Main FI, by demographics
Q6 Attitudes towards banking
Q6 Attitudes towards banking, by demographics
Q7 Attitudes towards banking
Q7 Attitudes towards banking, by demographics
PREVIOUS © Mintel Group Ltd. All rights reserved. NEXT FINANCIAL BUNDLING AND PRODUCT SWITCHING IN BANKING - CANADA - MARCH 2019 7
Demographics By Demographics
Demographics by demographics
Crosstabs
C1 Cross Q16 by Q20
PREVIOUS © Mintel Group Ltd. All rights reserved. NEXT REPORT, US - YEAR MONTH 8 RESEARCH METHODOLOGY PREVIOUS NEXT
CANADA RESEARCH METHODOLOGY 9
Canada Research Methodology
Mintel is an independent market analysis
research has been conducted using a Female, 18-24 6.9 139
company that prides itself on supplying
device agnostic platform for online surveys
objective information on a whole range of Female, 25-34 8.8 177
(ie respondents can now take surveys from
markets and marketing issues. Female, 35-44 9.4 188
a smartphone in addition to a computer or
There are six main sources of research that tablet). This methodology change may result Female, 45-54 8.7 174
are used in the compilation of Mintel reports: in data differences from previous years; any
Female, 55-64 8.6 172
trending should be done with caution.
• Consumer research Female, 65+ 8.5 170
Sampling
• Social media research Total 100 2,000
Online Surveys
• Desk research
Lightspeed
• Trade research Region % N
Founded in 1996, Lightspeed's double Ontario 40.2 804
• Statistical forecasting opt-in U.S. online consumer panel contains Quebec 22.1 443
approximately 1.27 million U.S. consumers. British Columbia 13.3 265
Mintel reports are written and managed by Lightspeed recruits its panelists through
Alberta 10.7 214
analysts with experience in the relevant many different sources including web
Saskatchewan 3.0 61
markets. advertising, permission-based databases
and partner-recruited panels. Note: Manitoba 4.8 95
Consumer research Lightspeed GMI was re-branded as Atlantic Provinces
Lightspeed in September 2016. (New Brunswick,
Newfoundland/
Exclusive and original quantitative 5.9 118
Labrador, Nova
consumer research is commissioned Mintel sets quotas on age and gender,
Scotia, Prince
for almost all Mintel reports. In addition, region, and household income. Specific Edward Island)
qualitative research is also undertaken for quotas for a sample of 2,000 adults aged
a large proportion of reports in the form of 18+ are shown below. Total* 100 2,000
online discussion groups. Mintel invests a
considerable sum each year in consumer Please note: these quotas are only *Mintel does not include rural regions such as the Yukon
research, and the purchaser of a Mintel representative of a standard General or the Northwest Territories (including Nunavut) in its
report benefits, as the price of an individual Population survey sample of 2,000 internet research. Thus the consumer research data does not
report is less than the cost of the original users aged 18+. Sample size, targets, and reflect opinions and behaviours of the population living in
research alone. The research brings an quotas may vary per report. Please see the those areas.
up-to-date and unique insight into topical Report Appendix for further details.
issues of importance. Household income % N
Age groups by Less than $25,000 14.0 281
Consumer research is conducted among a % N
gender $25,000 - $49,999 20.8 416
nationally representative sample of internet
$50,000 - $69,999 15.0 300
users in Canada and is carried out by Male, 18-24 7.9 158
$70,000 - $99,999 17.8 356
Lightspeed. The results are only available in Male, 25-34 9.1 181 $100,000 and over 32.4 647
Mintel reports. Note that Mintel’s exclusive
research is conducted online in both English Male, 35-44 10.4 207
and French. Male, 45-54 8.1 163 Total 100 2,000
Male, 55-64 6.1 123
Starting in July 2017, Mintel’s consumer Secondary Data Analysis
Male, 65+ 7.4 148
PREVIOUS © Mintel Group Ltd. All rights reserved. NEXT CANADA RESEARCH METHODOLOGY 10
In addition to exclusively commissioned This is a statistical visualisation method for TURF (Total Unduplicated Reach &
surveys, Mintel gathers syndicated data picturing the associations between rows Frequency) analysis identifies the mix
from the most respected consumer (image, attitudes) and columns (brands, of features, attributes, or messages that
research firms. This allows Mintel analysts products, segments, etc.) of a two-way will attract the largest number of unique
to form objective and cohesive analyses contingency table. It allows us to display respondents. It is typically used when the
of consumer attitudes and behaviour. brand images (and/or consumer attitudes number of features or attributes must be
Qualitative Research towards brands) related to each brand or should be limited, but the goal is still to
covered in this survey in a joint space that reach the widest possible audience. By
Revelation by FocusVision is easy to understand. The significance of identifying the Total Unduplicated Reach,
the relationship between a brand and its it is possible to maximize the number
FocusVision provides Mintel with qualitative associated image is measured using the of people who find one or more of their
bulletin board software. This allows the Chi-square test. If two brands have similar preferred features or attributes in the
creation of Internet-based, ‘virtual’ venues response patterns regarding their perceived product line. The resulting output from
where participants recruited from Mintel’s images, they are assigned similar scores TURF is additive, with each additional
online surveys gather and engage in on underlying dimensions and will then feature increasing total reach. The chart
interactive, text-based discussions led by be displayed close to each other in the is read from left to right, with each arrow
Mintel moderators. perceptual map. indicating the incremental change in total
reach when adding a new feature. The final
Further Analysis CHAID analysis bar represents the maximum reach of the
total population when all shown features are
Mintel employs numerous quantitative data CHAID (Chi-squared Automatic Interaction offered.
analysis techniques to enhance the value Detection), a type of decision tree analysis,
of our consumer research. The techniques is used to highlight key target groups in a Social Media Research
used vary form one report to another. Below sample by identifying which sub-groups
describes some of the more commonly used are more likely to show a particular To complement its exclusive consumer
techniques. characteristic. This analysis subdivides the research, Mintel tracks and analyses social
sample into a series of subgroups that share media data for inclusion in selected reports.
Repertoire Analysis similar characteristics towards a specific Using Infegy’s Atlas software, Mintel ‘listens
response variable and allows us to identify in’ on online conversations across a range
This is used to create consumer groups which combinations have the highest of social platforms including Facebook,
based on reported behaviour or attitudes. response rates for the target variable. It is Twitter, consumer forums and the wider
Consumer responses of the same value commonly used to understand and visualise web.
(or list of values) across a list of survey the relationship between a variable of
items are tallied into a single variable. interest such as “interest in trying a new Atlas provides rich consumer insight via
The repertoire variable summarises the product” and other characteristics of the the analysis of commentary posted publicly
number of occurrences in which the value sample, such as demographic composition. on the internet. The system performs
or values appear among a list of survey comprehensive and broad collection of
items. For example, a repertoire of brand Key Driver Analysis data from millions of internet sources,
purchasing might produce groups of those working to ensure a faithful and extensive
that purchase 1-2 brands, 3-4 brands and 5 Key driver analysis can be a useful tool in sampling of feedback from the widest
or more brands. Each subgroup should be helping to prioritise focus between different range of individuals. The dataset contains
large enough (ie N=75+) to analyse. factors which may impact key performance commentary posted in real time, as well as
indicators (eg satisfaction, likelihood to a substantial archive dating back through
Cluster Analysis switch providers, likelihood to recommend 2007.
a brand, etc). Using correlations analysis
This technique assigns a set of individual or regression analysis we can get an Trade research
people in to groups called clusters on the understanding of which factors or attributes
basis of one or more question responses, of a market have the strongest association Informal
so that respondents within the same cluster or “link” with a positive performance on
are in some sense closer or more similar to key performance indicators (KPIs). Hence, Trade research is undertaken for all reports.
one another than to respondents that were we are able to identify which factors or This involves contacting relevant players
grouped into a different cluster. attributes are relatively more critical in a in the trade, not only to gain information
market category compared to others and concerning their own operations, but also
Correspondence Analysis ensures that often limited resources can be to obtain explanations and views of the
allocated to focusing on the main market strategic issues pertinent to the market
drivers. being researched. Such is Mintel’s concern
with accuracy that draft copies of reports are
TURF Analysis sent to industry representatives, to get their
PREVIOUS © Mintel Group Ltd. All rights reserved. NEXT CANADA RESEARCH METHODOLOGY 11
feedback and avoid any misrepresentation as Statistics Canada and the Canadian forecast are collated in Mintel’s own market
of the market. These comments are Grocer. Other information is also gathered size database and supplemented by macro-
incorporated into reports prior to final from store and exhibition visits across and socio-economic data sourced from
publication. Canada, as well as using other databases organisations such as Statistics Canada,
within the Mintel Group, such as the Global The Bank of Canada, The Conference
Formal New Product Database (GNPD), which Board of Canada and the Economist
Internally, Mintel’s analysts undertake monitors FMCG sales promotions. Intelligence Unit.
extensive trade interviews with selected
key experts in the field for the majority of All analysts have access to Mintel’s Market Within the forecasting process, the model
reports. The purpose of these interviews Size and Macroeconomic Databases – searches for, and analyses relationships
is to assess key issues in the market a database containing many areas of between, actual market sizes and a
place in order to ensure that any research consumer spending and retail sales as well selection of key economic and demographic
undertaken takes these into account. as macroeconomic and demographic factors factors (independent variables) in order to
which impinge on consumer spending identify those predictors having the most
In addition, using experienced external patterns.. influence on the market.
researchers, trade research is undertaken
for some reports. This takes the form of The database is used in conjunction with Factors used in a forecast are stated in
full trade interview questionnaires and an SPSS forecasting program which uses the relevant report section alongside an
direct quotes are included in the report and weighted historical correlations of market interpretation of their role in explaining the
analysed by experts in the field. This gives a dynamics, with independent variables, to development in demand for the product or
valuable insight into a range of trade views produce future spending scenarios. market in question.
of topical issues.
Statistical Forecasting Qualitative insight
Desk research
Statistical modelling At Mintel we understand that historic data is
Mintel has an internal team of market limited in its capacity to act as the only force
analysts who monitor: government statistics, For the majority of reports, Mintel produces behind the future state of markets. Thus,
consumer and trade association statistics, five-year forecasts based on an advanced rich qualitative insights from industry experts
manufacturer sponsored reports, annual statistical technique known as ‘multivariate regarding past and future events that may
company reports and accounts, directories, time series auto-regression’ using the impact the market play a crucial role in our
press articles from around the world and statistical software package SPSS. post statistical modeling evaluation process.
online databases. The latter are extracted
from hundreds of publications and websites, Historical market size data feeding into each
both Canada and overseas. All information
is cross-referenced for immediate access.
Data from other published sources are the
latest available at the time of writing the
report.
This information is supplemented by
an extensive library of Mintel’s reports
produced since 1972 globally and added
to each year by the 500+ reports which are
produced annually.
In addition to in-house sources, researchers
also occasionally use outside libraries such
PREVIOUS © Mintel Group Ltd. All rights reserved. NEXT CANADA RESEARCH METHODOLOGY 12
As a result, the Mintel forecast allows for fall within these outer limits, which we call Weather analogy
additional factors or market conditions the best and worst case forecasts. These,
outside of the capacity of the data analysis based on the statistically driven forecast, To illustrate uncertainty in forecasting in
to impact the market forecast model, using are the highest (best case) and lowest an everyday example, let us assume the
a rigorous statistical process complemented (worst case) market sizes the market is following weather forecast was produced
by in-depth market knowledge and expected to achieve. based on the meteorologists’ current
expertise. knowledge of the previous weather condition
Over the next five years, the widening during the last few days, atmospheric
The Mintel fan chart bands successively show the developments observations, incoming weather fronts etc.
that occur within 95%, 90%, 70% and 50%
Forecasts of future economic outcomes probability intervals. Statistical processes Now, how accurate is this forecast and how
are always subject to uncertainty. In order predict the central forecast to fall within the certain can we be that the temperature on
to raise awareness amongst our clients darker shaded area which illustrates 50% Saturday will indeed be 15°C?
and to illustrate this uncertainty, Mintel has probability, i.e. a 5 in 10 chance.
introduced a new way of displaying market To state that the temperature in central
size forecasts in the form of a fan-chart. A general conclusion: Based on our current London on Saturday will rise to exactly 15°C
knowledge of given historic market size data is possible but one can’t be 100% certain
Next to historical market sizes and a current as well as projections for key macro- and about that fact.
year estimate, the fan chart illustrates the socio-economic measures that were used to
probability of various outcomes for the create the forecast, we can assume that in To say the temperature on Saturday will
market value/volume over the next five 95% of the time the actual market size will be between 13°C and 17°C is a broader
years. fall within the purple shaded fan. In 5% of all statement and much more probable.
cases this model might not be correct due
At a 95% confidence interval, we are saying to random errors and the actual market size In general, we can say that based on the
that 95 out of 100 times the forecast will will fall out of these boundaries. existing statistical model, one can be 95%
certain that the temperature on Saturday
will be between 13°C and 17°C, and
respectively 50% certain it will be between
about 14.5°C and 15.5°C. Again, only in
5% of all cases this model might not be
correct due to random errors and the actual
temperature on Saturday will fall out of
these boundaries and thus will be below
13°C or above 17°C.
(To learn more about uncertainty in weather
forecasts visit: http://research.metoffice.gov.
uk/research/nwp/ensemble/uncertainty.html)
PREVIOUS © Mintel Group Ltd. All rights reserved. NEXT Disclaimer Terms and Conditions of use Any use and/or copying of this document is subject to Mintel‘s standard terms and conditions, which are available at http://www.mintel.com/legal If you have any questions regarding usage of this document please contact your account manager or call your local helpdesk. Published by Mintel Group Ltd www.mintel.com email: info@mintel.com Help desk UK +44 (0)20 7778 7155 US +1 (312) 932 0600 Australia +61 (0)2 8284 8100 Japan +81 (3) 5456 5605 China +86 (21) 6386 6609 Singapore +65 (0) 6653 3600 © 2019 Mintel Group Ltd. All rights reserved. Confidential to Mintel. PREVIOUS
You can also read