Quantitative and Qualitative Analysis of Hydrogen Accumulation in Hydrogen-Storage Materials Using Hydrogen Extraction in an Inert Atmosphere - MDPI
←
→
Page content transcription
If your browser does not render page correctly, please read the page content below
metals
Article
Quantitative and Qualitative Analysis of Hydrogen
Accumulation in Hydrogen-Storage Materials Using
Hydrogen Extraction in an Inert Atmosphere
Maria N. Babikhina 1, *, Viktor N. Kudiiarov 1     ID
                                                        , Andrei V. Mostovshchikov 2   ID
                                                                                            and
Andrey M. Lider 1
 1   Division for Experimental Physics, School of Nuclear Science and Engineering, National Research Tomsk
     Polytechnic University, Tomsk 634050, Russia; viktor.kudiiarov@gmail.com (V.N.K.); lider@tpu.ru (A.M.L.)
 2   Research Laboratory for Super High Frequency Technology, School of Nuclear Science and Engineering,
     National Research Tomsk Polytechnic University, Tomsk 634050, Russia; pasembellum@mail.ru
 *   Correspondence: m.babihina@mail.ru; Tel.: +7-953-927-3071

 Received: 10 July 2018; Accepted: 21 August 2018; Published: 28 August 2018

 Abstract: Currently, standard samples with high hydrogen concentrations that meet the requirements
 of hydrogen extraction in an inert atmosphere are not currently available on the market. This article
 describes the preparation of Ti-H standard samples and the calibration of RHEN602, a hydrogen
 analyzer, using LECO (LECO, Saint Joseph, MI, USA). Samples of technically pure titanium
 alloy were chosen as the material for sample production. The creation procedure includes five
 main steps: sample preparation (polishing to an average roughness of 0.04 µm using sandpaper),
 annealing, hydrogenation, maintenance in an inert gas atmosphere, and characterization of the
 samples. The absolute hydrogen concentration in the samples was determined by two methods:
 volumetric and mass change after the introduction of hydrogen. Furthermore, in-situ X-ray diffraction,
 temperature programmed desorption (TPD) analysis, and thermogravimetric analysis were used
 during measurements to investigate the phase transitions in the samples. As a result of this work,
 a series of calibration samples were prepared in a concentration range up to 4 wt % hydrogen,
 optimal parameters for measuring high concentrations of hydrogen. The calibration line was obtained
 and the calibration error was 10%.

 Keywords: RHEN602 by LECO; hydrogen; standard samples; titanium alloy

1. Introduction
     An important task for the extension of the hydrogen economy is the development of promising
hydrogen storage materials [1–6]. In order to possess high rates of hydrogen sorption and desorption,
advanced hydrogen storage materials should have optimal elemental and phase composition.
Additionally, they should accumulate a large amount of hydrogen and be cyclically stable [7–11]. In the
matrix, metal hydrides have a high bulk density of hydrogen atoms, a wide range of operating pressures
and temperatures, catalytic activity, and are the most used materials for hydrogen storage [12–20].
Intermetallic compounds based on hydride-forming metals—such as Zr, Ti, Pd, and V—can accumulate
up to four mass % of hydrogen [21–30] and are widely used for hydrogen storage. Measurement of the
hydrogen concentration in hydrogen storage materials is an important stage in the development and
testing of materials.
     At present, the following methods are used to measure hydrogen concentration in metals:
emission spectroscopy, spectrometry with inductively coupled plasma, charged particle activation
analysis, mass spectral analysis, high-temperature vacuum annealing with mass spectrometric

Metals 2018, 8, 672; doi:10.3390/met8090672                                     www.mdpi.com/journal/metals
Metals 2018, 8, 672                                                                                 2 of 11

recording of hydrogen, and extraction in an inert gas medium with determination of hydrogen
content by means of a thermocondimetric cell along the calibration line [31,32]. The last method has
been the most widely used in both scientific laboratories and industries.
     The application of the hydrogen extraction method in an inert gas environment makes it possible
to determine hydrogen concentration with high accuracy (quantitative analysis) by means of a
calibration line, as well as by analyzing the shape of the extraction curve (the number of maxima
on the curve, and the width and height of the maximum). The state of hydrogen in the material
(qualitative analysis) can be evaluated analogously to the method used for thermally stimulated
desorption [33–37]. However, when quantitatively and qualitatively analyzing hydrogen accumulation
in storage materials with high hydrogen concentration, two difficulties can arise: incorrect results or
unobtainable analysis results.
     The first difficulty, regarding incorrect results, is that hydrogen analyzers, whose operation
principle is based on the method of extraction in an inert gas medium, are calibrated for reference
samples at low concentration. Thus, the hydrogen analyzers of the RHEN series using LECO (LECO,
Saint Joseph, MI, USA) [38] are calibrated as reference samples with hydrogen concentrations from
6 to 60 ppm, and have a sensitivity of 0.02 ppm, with an error in determining small (up to 100 ppm)
hydrogen concentrations not exceeding 10%. When measuring high hydrogen concentrations, however,
the measurement error can be significantly greater, since reference samples with low concentrations
are used for calibration. To solve this problem, it is necessary to calibrate the analyzer using reference
samples with high concentrations. However, such samples are not sold by analyzer manufacturers.
As such, it is necessary to prepare samples with known high hydrogen concentrations.
     The second difficulty, regarding unobtainable analysis results, occurs when the upper threshold
sensitivity of the thermocondimetric cell exceeds its limits. This happens when a sample with high
hydrogen content melts very rapidly and a large amount of hydrogen enters the cell in a short period
of time. Rapid melting of the analyzed sample occurs during the standardized analysis, as the current
passing through the sample immediately provides the maximum value. An increase in the gradual
stepwise of amperage in an initial value to its maximum will result in a more gradual extraction
of hydrogen, without exceeding the upper threshold of sensitivity for the thermocondimetric cell.
This will allow for an analysis of samples with high hydrogen contents, including the analysis of the
extraction curve shape and form.
     Thus, the samples with known high hydrogen concentrations were prepared in this study.
The optimal parameters for analyzing the samples with high hydrogen concentration were selected
so that the upper threshold of sensitivity for the thermal conductivity cell would not be exceeded.
Using LECO, the hydrogen analyzer RHEN602 was calibrated according to the prepared samples and
the selected optimal parameters. The efficiency of the developed technique was tested on various
samples of hydrogen storage materials.

2. Materials and Methods
     The material used for the preparation of samples with known high hydrogen content and tested
with the hydrogen analyzer calibration must have a number of properties: High sorption rates under
hydrogenation conditions; a stable state of hydrogen without the possibility of desorption under
standard temperature and pressure; cost-effectiveness; accessibility; and safety when handling. In this
paper, technically pure titanium alloy was chosen as the material that satisfies the above conditions;
it has also been thoroughly studied [39–47]. The samples for hydrogenation were made of 3 mm long
wire that was 2.5 mm in diameter. To produce the calibration samples with high concentration (4 wt %),
commercially pure titanium powder was used. The introduction of hydrogen was carried out by
gas-phase hydrogenation at 600 ◦ C and under a pressure of 2 atm. To achieve various concentrations of
hydrogen with the Gas Reaction Controller, an LPB automated complex was used (Advanced Materials
Corporation, Pittsburgh, PA, USA). Different concentrations of hydrogen were achieved by varying
the hydrogenation time. Six series of samples were obtained. Each series contained 10 samples with
Metals 2018, 8, 672                                                                                  3 of 11

the same concentration. It should be noted that as the concentration increased, the saturation time
increased linearly (Table 1).

                                  Table 1. The calibration samples series.

             Hydrogenation                                         Hydrogenation
 Series                       Concentration (wt %)    Series                         Concentration (wt %)
              Time (min)                                            Time (min)
    1                  55        0.643 ± 0.032           4               140            1.559 ± 0.078
    2                  70        1.068 ± 0.053           5               160            1.860 ± 0.093
    3                 120        1.125 ± 0.056           6               210              4.0 ± 0.1

       The concentration was determined by two methods: volumetric and mass change after the
introduction of hydrogen [48–52]. The concentration of the resulting series of the calibration samples
are shown in Table 1.
       Temperature programmed desorption analysis was carried out with Stanford Research Systems’
quadrupole mass spectrometer RGA100, which is part of the equipment used in the advanced Gas
Reaction Controller LPB complex (Advanced Materials Corporation, Pittsburgh, PA, USA). During gas
phase hydrogenation, phase transitions in the material were studied in situ at Precision Diffractometry
II, located at the Boreskov Institute of Catalysis in the Siberian Brach of the Russian Academy of Sciences
(SB RAS), on the 6th channel of synchrotron radiation of the VEPP-3 electron storage ring. A special
feature of the station is the use of a one-coordinate detector (OD-3M) in a powder diffractometer.
The detector consists of a multiwire proportional gas chamber, a recording unit with a coordinate
processor, and a computer. Single-axis detectors record scattered radiation simultaneously in a certain
range of angles (~30 ◦ C) over 3328 channels, with a response rate up to 10 MHz. The test sample was
placed in a chamber that was evacuated to a pressure below 10−4 Pa. The sample was heated linearly
in the range of 30 to 750 ◦ C, at a heating rate of 6 ◦ C/min. The recording of the diffractograms was
carried out every minute of heating, meaning every 6 ◦ C. The wave length of synchrotron radiation
was 1.0102 Å. The processing of the measured diffractograms and the identification of reflexes were
carried out using PDF-2-search-match, FullProf, and Crystallographica. The technique development
was assessed on hydrogen analyzer RHEN602 using LECO (LECO, Saint Joseph, MI, USA).

3. Results and Discussion
      Stepwise heating was used to analyze the samples with high hydrogen concentration without
exceeding the upper threshold of sensitivity of the thermocondimetric cell. First, the initial value of
the current applied to the sample was determined from the melting degree of the flux. Tin was used
as a fluxing agent in this analyzer. Flux was used to bring heat uniformly throughout the volume of
the solid sample and to ensure the particulate sample would not be blown from the crucible during
analysis. The melting of the flux began at the current strength of 170 A. During the analysis, it was
determined that the current strength should not exceed 700 A, since the degassing process takes place
at the given current strength. Therefore, 650 A was chosen as the current strength’s extreme value.
Next, the interval 170–650 A was divided into steps; a total of three routes with dimensions of 30, 60,
and 120 A were selected. For each step, the holding time was 20 s and the time of the current increase
was 15 s. Thus, for different routes, the total analysis time was different (600, 250, and 150 s at 30, 60,
and 120 A, respectively).
      Furthermore, the time parameters were chosen. The analysis time was determined to be the
total heating and holding times at constant current strength. To determine the optimum heating
and holding time, another experiment was performed. The main fitting of time parameters was
the analysis duration, particularly for the maximum mass of the test sample. We assumed that the
heating time should not exceed or be equal to the holding time. The minimum heating time was 10 s,
although this was not enough time for heating in each stage. Therefore, the heating time of 10 s was
selected, since during the given time, the hydrogen was uniformly detected by the sensor. The fitting
Metals 2018, 8, 672 4 of 11
of the holding time began at 15 s, but the higher the current strength, the more the sample heated
up, and when the exposure took place at the given current, the sensitivity threshold was exceeded.
Metals 2018, 8, x FOR PEER REVIEW 4 of 10
As has2018,
Metals already been
8, x FOR PEERnoted,
REVIEWwe did not want the analysis process to take much time, so the optimal 4 of 10
holding time was 20 s and the heating time was 15 s. It should also be mentioned that with the selected
parameters, the mass of the test sample was 0.035 g, which is greater than other investigated
time parameters,
parameters, the mass
the mass of the
of the testtest sample
sample waswas 0.035g,g,which
0.035 whichisis greater
greater than
than other investigated
investigated
parameters. The next step was to choose the step of the furnace heating. After analyzing the curve
parameters.
parameters. The next step was to to choose
choose the
the step
step of
of the
the furnace
furnace heating.
heating. After
After analyzing
analyzing the
the curve
curve
obtained by thermal desorption spectroscopy of zirconium alloy (Figure 1a), we established that the
obtained
obtained by by thermal
thermal desorption
desorption spectroscopy
spectroscopy of of zirconium
zirconium alloy
alloy (Figure
(Figure 1a),
1a), we
we established
established that
that the
the
optimal step was 100 ◦°C corresponding to 60 A.
optimal
optimal step
step waswas 100 C corresponding
100 °C corresponding to to 60
60 A.
A.
(a) (b)
(a) (b)
Figure 1. (a) Temperature programmed desorption curves of the titanium alloy and (b) the hydrogen
Figure 1. (a) Temperature programmed desorption curves of the titanium alloy and (b) the hydrogen
Figure 1. (a)
extraction Temperature
curve programmed
for the furnace heating desorption
current stepcurves
120 A.of the titanium alloy and (b) the hydrogen
extraction curve for
extraction curve for the
the furnace
furnace heating
heating current
currentstep
step120
120A.
A.
Analysis of previous works [53–58] demonstrated that the first peak of titanium alloy hydrogen
Analysis of previous works [53–58] demonstrated that the first peak of titanium alloy hydrogen
desorption
Analysis is of
observed
previousatworks
600 °C. This demonstrated
[53–58] temperature corresponds
that the first to theofphase
peak boundary
titanium between
alloy hydrogen
desorption is observed at 600 °C. This temperature corresponds to the phase boundary between
phases δ and
desorption is observed at 600 ◦during
β + δ. Hence, C. This this TPD step,
temperature dissociation
corresponds of hydrides
to the occurs.between
phase boundary Anotherphases
high-
phases δ and β + δ. Hence, during this TPD step, dissociation of hydrides occurs. Another high-
temperature peak between 690 to 720 °C corresponds to the transition from the
δ and β + δ. Hence, during this TPD step, dissociation of hydrides occurs. Another high-temperature α-phase to the β-
temperature peak between ◦ 690 to 720 °C corresponds to the transition from the α-phase to the β-
phase.
peak between 690 to 720 C corresponds to the transition from the α-phase to the β-phase.
phase.
A preliminary step was conducted to determine the temperature dependence of hydrogen for
A preliminary step was conducted to determine the temperature dependence of hydrogen for
each peak. This was accomplished by melting the material in an inert gas atmosphere at a heating heating
each peak. This was accomplished◦by melting the material in an inert gas atmosphere at a heating
furnace stepwise,
furnace stepwise,with
withaastep
stepofof120
120 C°C(Figure
(Figure 1b).
1b). Thus,
Thus, after
after thethe experiment,
experiment, we we determined
determined thatthat
the
furnace stepwise, with a step of 120 °C (Figure 1b). Thus, after the experiment, we determined ◦ that
the first peak aligns with the dissociation hydride. The high temperature peak
first peak aligns with the dissociation hydride. The high temperature peak occurred at 1000 C. occurred at 1000 °C.
the first peak aligns with the dissociation hydride. The high temperature peak occurred at 1000 °C.
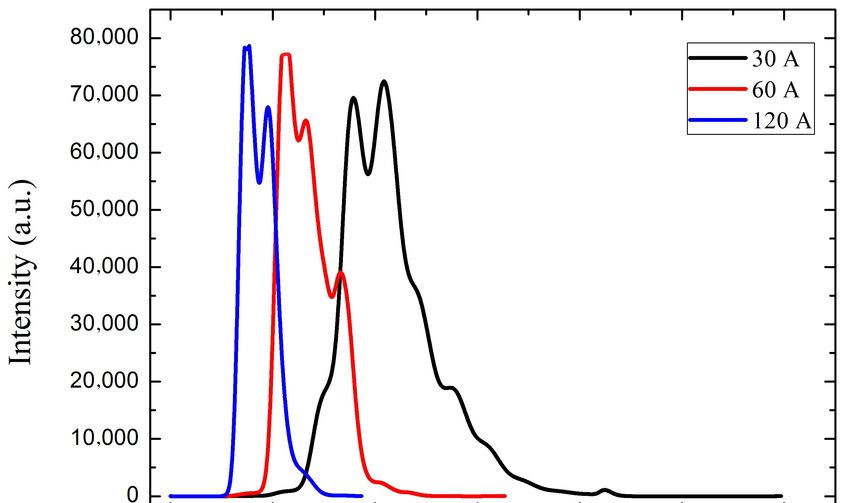
performed an in-situ
Additionally, we performed in-situ study
study ofof phase
phase transitions
transitions of titanium
titanium hydride
hydride powder
Additionally, we performed an in-situ study of phase transitions of titanium hydride powder
having stoichiometry of TiH TiH22 (4 wt %). The results are shown in Figure Figure 2.
2.
having stoichiometry of TiH2 (4 wt %). The results are shown in Figure 2.
Figure 2.
Figure 2. Kinetics
Kinetics of
of phase
phase transitions
transitions during
during thermal
thermal exposure
exposure in
in titanium
titanium powder
powder after
after hydrogen
hydrogen
Figure 2. Kinetics of phase transitions during thermal exposure in titanium powder after hydrogen
saturation from a gaseous medium.
saturation from a gaseous medium.
saturation from a gaseous medium.
Figure 3 shows a diffraction pattern that reveals the kinetics of phase transitions of titanium
Figure 3 shows a diffraction pattern that reveals the kinetics of phase transitions of titanium
alloy samples after their saturation with hydrogen from a gaseous medium during thermal exposure.
alloy samples after their saturation with hydrogen from a gaseous medium during thermal exposure.
With a linear heating of 6 °C/min, the decrease in intensity of titanium hydride reflections began at
With a linear heating of 6 °C/min, the decrease in intensity of titanium hydride reflections began at
520 °C. At 530 °C, these reflections disappeared almost completely, and hydrogen desorption began
520 °C. At 530 °C, these reflections disappeared almost completely, and hydrogen desorption beganMetals 2018, 8, x FOR PEER REVIEW 5 of 10
Metals 2018, 8, 672 5 of 11
the δ and β + δ phases. Throughout the volume of the material, the saturation of the titanium alloy
with hydrogen from a gaseous medium was the formation of hydrides.
Furthermore,
Figure 3 shows anaincrease in temperature
diffraction pattern thatbeyond
reveals530 the°C correlated
kinetics with transitions
of phase a decrease inof reflection
titanium
intensity
alloy of the
samples titanium’s
after α-phase with
their saturation and an increasefrom
hydrogen in reflection
a gaseousintensity
mediumof the titanium’s
during β-phase.
thermal exposure.
This correlation
With indicates
a linear heating ◦
of 6 the gradual
C/min, thetransition
decrease ofin titanium
intensityfrom α- to β-modification.
of titanium At 690–720
hydride reflections began°C,
at
520 ◦ C. At 530 ◦phase
the α-titanium passed
C, these completely
reflections into the β-titanium
disappeared phase, leading
almost completely, to another
and hydrogen peak appearing
desorption began
on thermostimulated
(Figure hydrogen
1a). The dissociation desorption
temperature of spectrum
hydrides at 530 ◦ C1a).
(Figure corresponds to the boundary between
the δ We
andperformed
β + δ phases.a thermogravimetric analysisof
Throughout the volume (TGA) of pure titanium
the material, powder
the saturation ofwithout hydrogen,
the titanium alloy
in addition
with hydrogento afrom
saturation withmedium
a gaseous hydrogen at the
was the formation
maximumof concentration
hydrides. (4 wt %) (Figure 3).
Q
5.80 -2
Residue:
5.740mg
5.75 (106.2%)
635.0°C 0.1148mg
5.70 326.2°C
0.6 -4
Temperature Difference (°C/mg)
5.65 325.9°C
Heat Flow (W/g)
Weight (mg)
5.60
0.08171mg
0.4 -6
5.55
5.50 631.5°C
0.1443mg 0.2 -8
5.45
320.4°C
89.64J/g
5.40
320.3°C 548.5°C 524.7°C
0.068°C·min/mg 239.5J/g 0.365°C·min/mg
5.35 -10
0 100 200 300 400 500 600 700 800 900
Exo Up Temperature (°C)
(a) Q
5.75 0
Residue: 543.3°C 542.0°C
5.710mg 2739J/g 2.882°C·min/mg
(102.4%) 0.1644mg 0.6 -2
5.70
Temperature Difference (°C/mg)
0.4 -4
652.0°C
5.65
Heat Flow (W/g)
0.2 -6
Weight (mg)
0.0 -8
5.60 0.08242mg 0.09512mg
-0.2 -10
5.55
-0.4 -12
562.4°C
5.50 -14
0 100 200 300 400 500 600 700 800 900
Exo Up Temperature (°C)
(b)
Figure 3.
Figure 3. Thermogravimetric-curve of of
Thermogravimetric-curve commercially pure
commercially titanium
pure powder
titanium (a) before
powder and (b)
(a) before andafter
(b)
hydrogenation.
after hydrogenation.
According to the results of thermal analysis, the original titanium powder, before hydrogenation
Furthermore, an increase in temperature beyond 530 ◦ C correlated with a decrease in reflection
and when heated in air, was characterized by a gradual increase in the sample’s mass. When heated
intensity of the titanium’s α-phase and an increase in reflection intensity of the titanium’s β-phase.
to 800 °C, the total weight gain was 6.2%. A light increase in mass was the result of the slowly oxidized
This correlation indicates the gradual transition of titanium from α- to β-modification. At 690–720 ◦ C,
titanium powder when heated in air (Figure 3a).Metals 2018, 8, 672 6 of 11
the α-titanium phase passed completely into the β-titanium phase, leading to another peak appearing
on thermostimulated hydrogen desorption spectrum (Figure 1a).
We performed a thermogravimetric analysis (TGA) of pure titanium powder without hydrogen,
in addition to a saturation with hydrogen at the maximum concentration (4 wt %) (Figure 3).
According to the results of thermal analysis, the original titanium powder, before hydrogenation
and when heated in air, was characterized by a gradual increase in the sample’s mass. When heated to
Metals 2018, 8, x FOR PEER REVIEW 6 of 10
800 ◦ C, the total weight gain was 6.2%. A light increase in mass was the result of the slowly oxidized
titanium
The powder
heat flow when
from heated in air (Figure
the sample had two 3a).pronounced endoeffects. At 320.4 and 524.7 °C, the
The heat flow from the sample had two pronounced ◦ C,
endoeffects did not cause a change in the oxidized titanium endoeffects. At 320.4 there
powder. Additionally, and 524.7
were no
the endoeffects
pronounced did not cause
deviations in the a change
mass in the oxidized
change titanium powder.
curve accompanying theAdditionally,
endoeffects.there
Thus,were no
these
pronounced
endoeffects referdeviations in the
to phase mass change
transitions curve
in the accompanying
structure the endoeffects.
of the titanium particlesThus, these endoeffects
themselves. The most
refer
probable endoeffects are the phase transitions (recrystallization) in the oxide shellmost
to phase transitions in the structure of the titanium particles themselves. The probable
covering the
endoeffects
titanium powder.are the phase transitions (recrystallization) in the oxide shell covering the titanium powder.
After
After the
the titanium
titanium powder
powder had had been
been saturated
saturated with with hydrogen,
hydrogen, aa significant
significant endoeffect
endoeffect (2739
(2739 J/g)
J/g)
was
was recorded using differential thermal analysis. The endoeffect was accompanied by decrease
recorded using differential thermal analysis. The endoeffect was accompanied by a 1.66% a 1.66%
in the sample’s
decrease in themass (by 0.2%
sample’s massrelative
(by 0.2%to the initialtomass
relative the of the sample).
initial mass of theThissample).
endoeffect, accompanied
This endoeffect,
by
accompanied by a decrease in the sample’s mass, arose when the hydrogenated powderthe
a decrease in the sample’s mass, arose when the hydrogenated powder was heated and wastitanium
heated
hydride decomposed
and the titanium (Figure
hydride 3b).
decomposed (Figure 3b).
Temperature
Temperature dependence
dependence for for each
each hydrogen
hydrogen peak peak waswas determined
determined by melting hydrogen
by melting hydrogen content
content
in an inert gas atmosphere, heating the furnace stepwise at steps of 100 ◦ C. Thus, as the result of the
in an inert gas atmosphere, heating the furnace stepwise at steps of 100 °C. Thus, as the result of the
performed
performed experiment,
experiment, we we established
established that
that the
the first
first peak
peak waswas related
related to
to the
the dissociation
dissociation of of hydrides.
hydrides.
However, the high temperature peak was related to 1000 ◦ C. Additionally, we concluded that the
However, the high temperature peak was related to 1000 °C. Additionally, we concluded that the
heating ◦ was optimal for the development of the technique. For comparison, heating steps
heating stepstepof of100
100 C °C was optimal for the development of the technique. For comparison, heating
of 200 and 50 ◦ C, which are equivalent to 120 A and 30 A, were evaluated. Notably, the transfer of
steps of 200 and 50 °C, which are equivalent to 120 A and 30 A, were evaluated. Notably, the transfer
small
of small currents
currents into thethe
into temperature
temperature maymay result
resultin in
a greater
a greater confidence
confidence interval,
interval,inin
the
thespan
spanofoferror.
error.
Figure 4 presents hydrogen extraction curves with heating steps of 200 ◦ C (120 A), 100 ◦ C (60 A),
Figure 4 presents hydrogen extraction curves with heating steps of 200 °C (120 A), 100 °C (60 A),
and ◦ C (30 A).
and 5050 °C (30 A).
Figure 4. Hydrogen extraction curves with heating steps of 200 ◦°C
C (120 A), 100 ◦°C
C (60 A), and 50 ◦°C
C
(30 A).
After fitting the time parameters for each step, it was necessary to determine the maximum
possible sample mass for each measured
measured step
step (Table
(Table2).
2).
Table 2. Sample mass for each measured step.
Step Mass 0.01 ± 0.002 g Mass 0.02 ± 0.002 g Mass 0.03 ± 0.002 g Mass 0.04 ± 0.002 g
1 (120 A) + + - -
2 (60 A) + + + -
3 (30 A) + + + +Metals 2018, 8, 672 7 of 11
Table 2. Sample mass for each measured step.
Step Mass 0.01 ± 0.002 g Mass 0.02 ± 0.002 g Mass 0.03 ± 0.002 g Mass 0.04 ± 0.002 g
1 (120 A) + + - -
2 (60 A) + + + -
3 (30 A) + + + +
Metals 2018, 8, x FOR PEER REVIEW 7 of 10
According to the presented results, we obtained the following findings:
Step 1. 1.
Step At a At
furnace heating
a furnace step of
heating step200of◦ C
200(120
°C A),
(120the
A),measured weightweight
the measured of the of
sample was 0.02
the sample wasg. 0.02
It was
g.
Itnot
wasnecessary to carry
not necessary toout
carrytheout
measurements
the measurements in this in
mode.
this mode.
Step
Step 2. 2.
At aAt a furnace
furnace heating
heating stepstep of 100
of 100 ◦ C°C(60(60 A),
A), themaximum
the maximumsamplesamplemass
masstoto measure
measure hydrogen
concentration was 0.03 g; the analysis time was optimally
concentration was 0.03 g; the analysis time was optimally fitted fitted for measurements.
Step
Step 3. 3.
At aAt a furnace
furnace heating
heating of 50of◦ C
stepstep 50(30°C A),
(30 the
A), maximum
the maximum sample
sample mass mass
waswas
0.040.04 g. Given
g. Given thatthat
the
the maximum analysis time could not exceed 600 s, these settings could not
maximum analysis time could not exceed 600 s, these settings could not be selected as the basic be selected as the
basic settings
settings for measurement,
for measurement, since
since the the process
process of determining
of determining the hydrogen
the hydrogen content
content in in the
the material
material
cannot be cannot be prolonged
prolonged over time. over time.
orderto
In order toestablish
establishaccuracy
accuracy in in
thethe developed
developed procedure,
procedure, we needed
we needed to know
to know a material’s
a material’s exact
exact concentration,
concentration, since since the technique
the technique was developed
was developed to measure
to measure high high concentration.
concentration. In this
In this case,case,
the
the material also had to have a known high hydrogen concentration.
material also had to have a known high hydrogen concentration. For such concentrations, the For such concentrations,
the gravimetric
gravimetric method method canasserve
can serve as an method
an external external formethod for determining
determining hydrogen
hydrogen content. content.
Furthermore,
Furthermore,
it was necessary it to
was
knownecessary
the masstoofknow the mass
the material beforeof and
the after
material beforeThis
saturation. andrepresents
after saturation.
a main
This represents
limitation of thisamethod,
main limitation
especiallyof when
this method,
comparingespecially
it to thewhen
method comparing
of meltingit to
thethe method
sample of
in an
melting
inert gasthe sample in an
environment. Ininert gas environment.
the latter case, it is notIn the lattertocase,
necessary know it is
thenot necessary
mass to know
value before the mass
saturation.
valueThebefore saturation.
calibration line was obtained as a result of the calibration of obtained samples. The
The calibration
developed procedure linereliability
was obtainedwasasevaluated
a result of the calibration
using of obtained
stoichiometric samples.hydride
zirconium The developed
(ZrH2)
procedure
(Figure 5). reliability was evaluated using stoichiometric zirconium hydride (ZrH2 ) (Figure 5).
Figure
Figure 5.
5. The
The developed
developed procedure
procedure reliability
reliability evaluation.
evaluation.
The measured concentration in stoichiometric zirconium hydride lies on the calibration line.
The measured concentration in stoichiometric zirconium hydride lies on the calibration line. Thus,
Thus, we concluded that the developed technique for measuring high concentrations of hydrogen is
we concluded that the developed technique for measuring high concentrations of hydrogen is reliable
reliable and satisfies the stated goal.
and satisfies the stated goal.
4. Conclusions
In this study, a technique was developed to measure high hydrogen concentrations with a
hydrogen analyzer, RHEN602 using LECO. Over the course of the study, we performed the following
procedures: (1) The series of the calibration samples were prepared within the concentration rangeMetals 2018, 8, 672 8 of 11
4. Conclusions
In this study, a technique was developed to measure high hydrogen concentrations with a
hydrogen analyzer, RHEN602 using LECO. Over the course of the study, we performed the following
procedures: (1) The series of the calibration samples were prepared within the concentration range of
up to 4 wt % hydrogen; (2) Optimal parameters for measuring high concentrations of hydrogen were
selected, such as establishing heating and holding times of 15 and 20 s, setting the step of the furnace
heating current at 60 A, and having samples weigh in at is 0.030 ± 0.001 g; (3) The analyzer was
calibrated according to the obtained calibration samples. We established that the developed technique
can be used when measuring hydrogen content from 0.5 to 4 wt % hydrogen. (4) The reliability was
evaluated using stoichiometric zirconium hydride. When measuring the samples, all obtained data
was placed within a confidence interval of 10%. Based on the presented results, we concluded that the
developed technique meets the stated goal and can be applied for further research.
Author Contributions: M.N.B. analyzed the results, prepared the paper, directed the work, and carried out the
calibration of RHEN602 using LECO. M.N.B. and V.N.K. performed sample preparation, hydrogen concentration
determination, hydrogenation of samples, and revised the manuscript. A.M.L. and A.V.M. carried out testing of
calibration samples and analyzed the results.
Funding: The study is supported by the Ministry of Education and Science of the Russian Federation, Project No.
11.1928.2017/4.6.
Acknowledgments: The research was carried out within the framework of the grant of the Program for Enhancing
Competitiveness of Tomsk Polytechnic University.
Conflicts of Interest: The authors declare no conflict of interest.
References
1. Borzenko, V.; Eronin, A. The use of air as heating agent in hydrogen metal hydride storage coupled with
PEM fuel cell. Int. J. Hydrogen Energy 2016, 41, 23120–23124. [CrossRef]
2. García-Triviño, P.; Fernández-Ramírez, L.M.; Gil-Mena, A.J.; Llorens-Iborra, F.; García-Vázquez, C.A.;
Jurado, F. Optimized operation combining costs, efficiency and lifetime of a hybrid renewable energy system
with energy storage by battery and hydrogen in grid-connected applications. Int. J. Hydrogen Energy 2016,
41, 23132–23144.
3. Ortiz, A.L.; Zaragoza, M.J.M.; Collins-Martínez, V. Hydrogen production research in Mexico: A review. Int. J.
Hydrogen Energy 2016, 41, 23363–23379. [CrossRef]
4. Ramírez-Dámaso, G.; Ramírez-Platón, I.E.; López-Chávez, E.; Castillo-Alvarado, F.L.; Cruz-Torres, A.;
Caballero, F.; Mondragón-Guzmán, R.; Rojas-Hernández, E. A DFT study of hydrogen storage on surface
(110) of Mg1−x Alx (0 ≤ x ≤ 0.1). Int. J. Hydrogen Energy 2016, 41, 23388–23393.
5. Ortiz, A.L.; Sámano, R.P.; Zaragoza, M.M.; Collins-Martínez, V. Thermodynamic analysis and process
simulation for the H2 production by dry reforming of ethanol with CaCO3 . Int. J. Hydrogen Energy 2015, 40,
17172–17179. [CrossRef]
6. Liu, W.; Aguey-Zinsou, K.F. Hydrogen storage properties of in-situ stabilised magnesium nanoparticles
generated by electroless reduction with alkali metals. Int. J. Hydrogen Energy 2015, 40, 16948–16960.
[CrossRef]
7. Bouazizi, N.; Boudharaa, T.; Bargougui, R.; Vieillard, J.; Ammar, S.; Le Derf, F.; Azzouz, A. Synthesis and
properties of ZnO-HMD@ZnO-Fe/Cu core-shell as advanced material for hydrogen storage. J. Colloids
Interface Sci. 2017, 491, 89–97. [CrossRef] [PubMed]
8. Köse, D.A.; Yurdakul, Ö.; Şahin, O.; Öztürk, Z. The new metal complex templated polyoxoborate(s) (POB(s))
structures. Synthesis, structural characterization, and hydrogen storage capacities. J. Mol. Struct. 2017, 1134,
809–813.
9. Kolachev, B.A.; Shalin, R.E.; Ilin, A.A. Hydrogen Storage Alloys; Metallurgy: Moscow, Russia, 1995; p. 384.
(In Russian)
10. Zhang, Y.; Li, J.; Zhang, T.; Wu, T.; Kou, H.; Xue, X. Hydrogenation thermokinetics and activation behavior
of non-stoichiometric Zr-based Laves alloys with enhanced hydrogen storage capacity. J. Alloys Compd. 2017,
694, 300–308. [CrossRef]Metals 2018, 8, 672 9 of 11
11. Suárez-Alcántara, K.; Palacios-Lazcano, A.F.; Funatsu, T.; Cabañas-Moreno, J.G. Hydriding and dehydriding
in air-exposed Mg Fe powder mixtures. Int. J. Hydrogen Energy 2016, 41, 23380–23387.
12. Chen, X.; Zou, J.; Zeng, X.; Ding, W. Hydrogen storage properties of a Mg-La-Fe-H nano-composite prepared
through reactive ball milling. J. Alloys Compd. 2017, 701, 208–214. [CrossRef]
13. Ma, M.; Duan, R.; Ouyang, L.; Zhu, X.; Chen, Z.; Peng, C.; Zhu, M. Hydrogen storage and hydrogen
generation properties of CaMg2 -based alloys. J. Alloys Compd. 2017, 691, 929–935. [CrossRef]
14. Suárez-Alcántara, K.; Palacios-Lazcano, A.F.; Funatsu, T.; Cabañas-Moreno, J.G. Mg–M–LiH alloys prepared
by mechanical milling and their hydrogen storage characteristics. Int. J. Hydrogen Energy 2015, 40,
17344–17353.
15. Hino, S.; Grove, H.; Ichikawa, T.; Kojima, Y.; Sørby, M.H.; Hauback, B.C. Metal aluminum amides for
hydrogen storage–Crystal structure studies. Int. J. Hydrogen Energy 2015, 40, 16938–16947. [CrossRef]
16. Tarasov, B.P.; Lototsky, M.V.; Yartys, V.A. The problem of hydrogen storage and the prospects for using
hydrides for the accumulation of hydrogen. Russ. Chem. J. 2006, 50, 34–48. (In Russian)
17. Kulik, O.P.; Chernyshev, L.I. Hydrogen Energy: Storage and Transportation of Hydrogen (Review);
Frantsevich, I.N., Ed.; Preprint of NAS of Ukraine; Institute of Problems of Materials Science: Ukraine,
Ukraine; pp. 1–67. (In Russian)
18. Pundt, A.; Kirchheim, R. Hydrogen in metals: Microstructural aspects. Annu. Rev. Mater. Res. 2006, 36,
555–608. [CrossRef]
19. Wang, L.; Jiang, J.; Ma, A.; Li, Y.; Song, D.A. Critical Review of Mg-Based Hydrogen Storage Materials
Processed by Equal Channel Angular Pressing. Metals 2017, 7, 324. [CrossRef]
20. Da Silva Dupim, I.; Ferreira Santos, S.; Huot, J. Effect of Cold Rolling on the Hydrogen Desorption Behavior
of Binary Metal Hydride Powders under Microwave Irradiation. Metals 2015, 5, 2021–2033. [CrossRef]
21. Perevezentsev, A.N.; Andreev, B.M.; Kapyshev, V.K.; Rivkis, L.A.; Malek, M.P.; Bystritskii, V.M.; Stolupin, V.A.
Hydrides of intermetallic compounds and alloys, their properties and applications in nuclear engineering.
Phys. Elem. Part. Atom. Nucl. 1988, 19, 1386. (In Russian)
22. Azhazh, V.M.; Tikhonovsky, M.A.; Shepelev, A.G.; Kurilo, Yu.P.; Ponomarenko, T.A.; Vinogradov, D.V.
Materials for hydrogen storage: Analysis of the development trend on the basis of data on information flows.
Q. Atom. Sci. Technol. 2006, 1, 145–152. (In Russian)
23. Milanović, I.; Milošević, S.; Rašković-Lovre, Ž.; Novaković, N.; Vujasin, R.; Matović, L.; Fernándezc, J.F.;
Sánchez, C.; Novaković, J.G. Microstructure and hydrogen storage properties of MgH2 –TiB2 –SiC composites.
Ceram. Int. 2013, 39, 4399–4405.
24. Fernandez, A.; Deprez, E.; Friedrichs, O. A comparative study of the role of additive in the MgH2 vs. the
LiBH4 –MgH2 hydrogen storage system. Int. J. Hydrogen Energy 2011, 36, 3932–3940. [CrossRef]
25. Friedrichs, O.; Kolodziejczyk, L.; Sánchez-López, J.C.; Fernandez, A.; Lyubenova, L.; Zander, D.; Köster, U.;
Aguey-Zinsoud, K.F.; Klassen, T.; Bormann, R. Influence of particle size on electrochemical and gas-phase
hydrogen storage in nanocrystalline Mg. J. Alloys Compd. 2008, 463, 539–545. [CrossRef]
26. Leardini, F.; Bodega, J.; Ares, J.R.; Fernandez, J.F. Realistic simulation in a single stage hydrogen compressor
based on AB2 alloys. Int. J. Hydrogen Energy 2016, 41, 9780–9788.
27. Kumar, S.; Jain, A.; Ichikawa, T.; Kojima, Y.; Dey, G.K. Development of vanadium based hydrogen storage
material: A review. Renew. Sustain. Energy Rev. 2017, 72, 791–800. [CrossRef]
28. Shao, H.; Xin, G.; Zheng, J.; Li, X.; Akiba, E. Nanotechnology in Mg-based materials for hydrogen storage.
Nano Energy 2012, 1, 590–601. [CrossRef]
29. Zhang, T.; Zhang, Y.; Zhang, M.; Hu, R.; Kou, H.; Li, J.; Xue, X. Hydrogen absorption behavior of Zr-based
getter materials with Pd Ag coating against gaseous impurities. Int. J. Hydrogen Energy 2016, 41, 14778–14787.
[CrossRef]
30. Tarnawski, Z.; Kim-Ngan, N.T.H. Hydrogen storage characteristics of Ti–and V–based thin films. J. Sci. Adv.
Mater. Dev. 2016, 1, 141–146. [CrossRef]
31. Protsenko, O.M. Experience in developing a methodology for measuring hydrogen content in titanium
alloys. Electron. Sci. J. 2014, 12, 1–5. (In Russian)
32. Grigorovich, K.V. New possibilities of modern methods for determination of gas-forming impurities in
metals. Diag. Mater. 2007, 73, 23–34. (In Russian)
33. Furuya, Y.; Takasaki, A.; Mizuno, K.; Yoshiie, T. Hydrogen desorption from pure titanium with different
concentration levels of hydrogen. J. Alloys Compd. 2007, 446, 447–450. [CrossRef]Metals 2018, 8, 672 10 of 11
34. Eliezer, D.; Tal-Gutelmacher, E.; Cross, C.E.; Boellinghaus, T. Hydrogen absorption and desorption in a
duplex-annealed Ti–6Al–4V alloy during exposure to different hydrogen-containing environments. Mater. Sci.
Eng. A 2006, 433, 298–304. [CrossRef]
35. Tal-Gutelmacher, E.; Eliezer, D.; Abramov, E. Thermal desorption spectroscopy (TDS)—Application in
quantitative study of hydrogen evolution and trapping in crystalline and non-crystalline materials. Mater. Sci.
Eng. A 2007, 445, 625–631. [CrossRef]
36. Von Zeppelin, F.; Haluška, M.; Hirscher, M. Thermal desorption spectroscopy as a quantitative tool to
determine the hydrogen content in solids. Thermochim. Acta 2003, 404, 251–258. [CrossRef]
37. Takasaki, A.; Furuya, Y.; Ojima, K.; Taneda, Y. Hydride dissociation and hydrogen evolution behavior of
electrochemically charged pure titanium. J. Alloys Compd. 1995, 224, 269–273. [CrossRef]
38. Determination of Total and Surface Hydrogen by Melting in an Inert Gas Atmosphere: [Electronic Resource].
LECO Corporation–Representative Office in Russia, 2012. Available online: http://ru.leco-europe.com/
product/rhen602/ (accessed on 27 August 2018). (In Russian)
39. Mikhaylov, A.A.; Laptev, R.S.; Kudiiarov, V.N.; Volokitina, T.L. Titanium defect structure change after
gas-phase hydrogenation at different temperatures and cooling rates. AIP Conf. Proc. 2016, 1783, 020152.
40. Hadjixenophontos, E.; Michalek, L.; Roussel, M.; Hirscher, M.; Schmitz, G. The role of surface oxides on
hydrogen sorption kinetics in titanium thin films. Appl. Surf. Sci. 2018, 441, 324–330. [CrossRef]
41. Laptev, R.; Lider, A.; Bordulev, Y.; Kudiiarov, V.; Garanin, G. Hydrogenation-induced microstructure changes
in titanium. J. Alloys Compd. 2015, 645, S193–S195. [CrossRef]
42. Stepanova, E.; Bordulev, Y.; Kudiiarov, V.; Laptev, R.; Lider, A.; Jiang, X. Effect of hydrogen on the structural
and phase state and defect structure of titanium Alloys. AIP Conf. Proc. 2016, 1772, 030016.
43. Sakintuna, B.; Lamari-Darkrim, F.; Hirscher, M. Metal hydride materials for solid hydrogen storage: A
review. Int. J. Hydrogen Energy 2007, 32, 1121–1140. [CrossRef]
44. Larionov, V.V.; Lider, A.M.; Laptev, R.S. Control of changes in the defect structure of titanium saturated with
hydrogen. IOP Conf. Ser. Mater. Sci. Eng. 2016, 135, 012025. [CrossRef]
45. Ulmer, U.; Dieterich, M.; Pohl, A.; Dittmeyer, R.; Linder, M.; Fichtner, M. Study of the structural,
thermodynamic and cyclic effects of vanadium and titanium substitution in laves-phase AB2 hydrogen
storage alloys. Int. J. Hydrogen Energy 2017, 42, 20103–20110. [CrossRef]
46. Macin, V.; Christ, H.J. Influence of hydride-induced microstructure modification on mechanical properties of
metastable beta titanium alloy Ti 10V-2Fe-3Al. Int. J. Hydrogen Energy 2015, 40, 16878–16891. [CrossRef]
47. Vizcaíno, P.; Vergara, I.L.; Banchik, A.D.; Abriata, J.P. Terminal solid solubility determinations in the H–Ti
system. Int. J. Hydrogen Energy 2015, 40, 16928–16937.
48. San-Martin, A.; Manchester, F.D. The H-Ti (Hydrogen-Titanium) system. Bull. Alloy Phase Diagr. 1987, 8,
30–42. [CrossRef]
49. Kudiiarov, V.N.; Babihina, M.N.; Gvozdyakov, D.V. The Influence of Gas-Phase Hydrogenation Parameters
on the Processes of Activation, Sorption and Accumulation of Hydrogen in the Powder of Pure Titanium.
MATEC Web Conf. 2016, 72, 01054. [CrossRef]
50. Kolthoff, I.M.; Stenger, V.A. Volumetric Analysis; Interscience Publishers, Inc.: Olney, UK, 1947.
51. Methodical Instructions to Laboratory Work on Analytical Chemistry “Gravimetric Methods of Analysis”; Comp.
T.N. Ermolaeva.-Lipetsk; LSTU: Lipetsk, Russia, 2004; p. 35. (In Russian)
52. Manakhova, S.V. Fundamentals of quantitative analysis: Textbook. In Allowance; Northern (Arctic) Federal
University: Arkhangelsk, Russia, 2010; p. 128. (In Russian)
53. Denisov, E.A.; Kompaniets, M.V.; Kompaniets, T.N.; Spitsyn, V.I. Surface-limited permeation regime in the
study of hydrogen interactions with metals. Measurement 2018, 117, 258–265. [CrossRef]
54. Nikitenkov, N.N.; Chernov, I.P.; Tyurin, Y.I.; Skirnevsky, A.V.; Garanin, G.V.; Lider, A.M.; Cherdantsev, Y.P.
Studies of hydrogen storage in a zirconium alloy by the method of thermally stimulated gas evolution.
Proc. Tomsk Polytech. Univ. 2006, 309, 52–55. (In Russian)
55. Woodruff, D.; Delchar, T. Modern Methods of Surface Investigation; Cambridge University Press: Cambridge,
UK, 1989; p. 564.
56. Hultquist, G.; Graham, M.J.; Smialek, J.L.; Jönsson, B. Hydrogen in metals studied by thermal desorption
spectroscopy (TDS). Corros. Sci. 2015, 93, 324–326. [CrossRef]Metals 2018, 8, 672 11 of 11
57. Ma, M.; Liang, L.; Tang, B.; Xiang, W.; Wang, Y.; Cheng, Y.; Tan, X. Decomposition kinetics study of zirconium
hydride by interrupted thermal desorption spectroscopy. J. Alloys Compd. 2015, 645, S217–S220. [CrossRef]
58. Ershova, O.G.; Dobrovolsky, V.D.; Solonin, Y.M.; Khyzhun, O.Y. Hydrogen-sorption and thermodynamic
characteristics of mechanically grinded TiH 1.9 as studied using thermal desorption spectroscopy.
J. Alloys Compd. 2011, 509, 128–133. [CrossRef]
© 2018 by the authors. Licensee MDPI, Basel, Switzerland. This article is an open access
article distributed under the terms and conditions of the Creative Commons Attribution
(CC BY) license (http://creativecommons.org/licenses/by/4.0/).You can also read