Efficacy of MinnFinn to Koi Fish at Predicted Therapeutic Doses
←
→
Page content transcription
If your browser does not render page correctly, please read the page content below
Aquaculture, Pond and Aquaria Consulting

Efficacy of MinnFinn to Koi Fish at Predicted
             Therapeutic Doses

Report also includes studies using the solution for algae
                        control

                    October, 2007

                    Paul A. Curtis

                                             AquaSolver
                                             Paul A. Curtis, M.Sc.
                                             2255 Seaquest Trail
                                             Escondido, CA 92029
                                             760-518-8170
                                             paultrout@aquasolver.com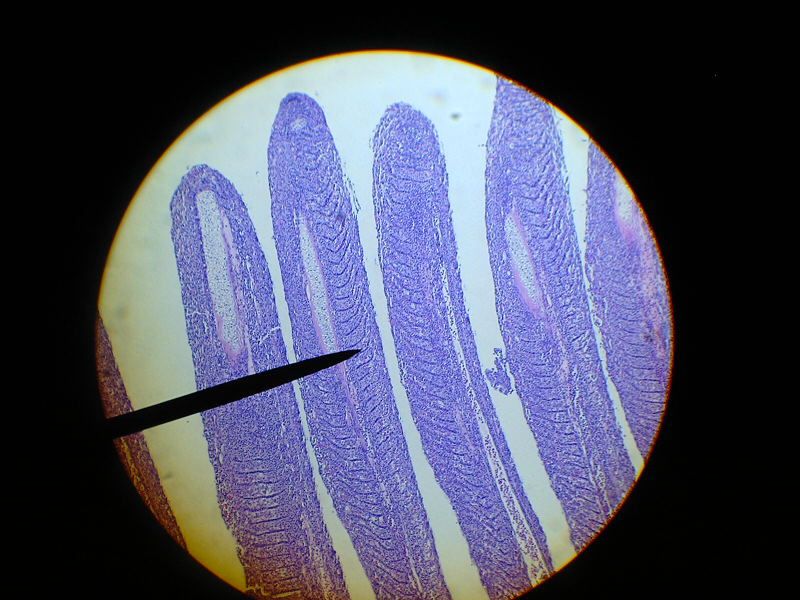
Efficacy of MinnFinn to Koi Fish at Predicted Therapeutic
Doses; Phase II
Paul A. Curtis, M.Sc.
AquaSolver
Introduction
The availability of effective medications is an important part of the aquarium and pond
fish hobby/industry. If a fish keeper is successful in the treatment of disease, he/she will
build confidence in their abilities and will continue to develop in the hobby thus helping
build the value of the hobby.

There are many medications available on the market today ranging from chemical
solutions to antibiotics. One of the major challenges that the industry may have to face is
the regulation of medications by the FDA. The aquaculture industry was regulated
approximately 15 years ago making it so there were very few licensed products for use,
leaving the industry with a huge deficit. The same may occur to the aquarium/pond
industry.

The product MinnFinn (Minntech Corp.) may be a valuable treatment compound for
external parasites and bacteria in aquarium fish. Hydrogen peroxide is an effective agent
and has been used a great deal in the aquaculture industry. The combination of peracetic
acid with hydrogen peroxide in MinnFinn has been well demonstrated as a disinfectant
against virus and bacteria. In review of its toxicity to a few fish species, it appeared that
freshwater fish are tolerant of the compound and it thus may be a good treatment tool for
the reduction or elimination of ecto-parasites and bacteria in tropical fish. With the
efficacy against viruses, it may also inhibit the spread of virus in an infected population.

Some preliminary research investigating the effectiveness of MinnFinn on a pathogenic
Vibrio sp.bacteria invitro showed MinnFinn to be efficient at killing the organism
suspended in sea water at or below doses required with hydrogen peroxide. Further
investigation is warranted, in both aquaculture and home aquarium systems.

The following provides the methods for the testing of efficacy of MinnFinn at the
determined safe levels from the experiment executed in Phase I on Koi. In that
experiment both the 25 ppm and 10 ppm doses had little impact on the fish after three
treatments with each treatment separated by one day. The fish tested were juvenile Koi
with an average size of ~8 grams.

If efficacious, MinnFinn will be marketed for the treatment of external parasites and
bacteria. In the treatment of parasites it would be used alone. In the treatment of a
bacterial infection however, it may best be done in conjunction with an injection type
antibiotic such as Oxytetracycline.
Another possible use for MinnFinn in the Koi industry is as a pond clarifier. Algal
blooms are a constant problem for many pond owners. Most of the compounds used to
eradicate algae have similar characteristics and medications. Once introduced to the
water they are persistent and to be removed a water change must be done or use low
enough doses so prolonged exposure does not affect the fish. Many of these compounds
are harmful to the environment as well as have a level of toxicity to fish with prolonged
exposure. MinnFinn may provide a simple and neutralizable method of eradicating an
algal bloom and in conjunction with a clumping agent may clear pond water quickly.

Methods and Materials

Test Fish
Testing will be performed on diseased Koi. As there are many retail Koi facilities and
commercial Koi farms in the Southern California area, contact will be made with these
facilities and attempts to obtain approval to conduct experiments tank side on fish during
a disease outbreak. Field testing will provide valuable data as to the efficacy of the
compound under every day conditions. Facilities will be contacted until the treatment
requirements for the trial can be fulfilled.

Koi are an important species as they are part of an ever increasing sector of the fish
keeping industry and it is therefore important to provide a new tool for the growing
ornamental pond sector. Fish of any size will be tested but fish numbers should be such
that they can provide adequate replicates. If numbers are inadequate for the total number
of replicates, testing would still provide good supportive data.

The Treatment System
Treatments will be done in 80 l plastic bins. The number of animals available for
treatment will dictate the number of possible replicates for treatment. A small battery
powered aerator will be installed on each bin to maintain adequate oxygenation during
the treatment. The system will be made portable for a rapid response to an outbreak.

Dosing and treatment levels
25ppm (5.01 ml in 60 l) and 10ppm (2.0 ml in 60 l) doses will be the doses used in the
field testing. All of these doses are considered at 100% active ingredient.

Testing
Prior to fish being stocked, the test bins will be filled with tank water to a total volume of
60l. Attempts will be made to randomly place five fish in each of the test bins. If fish are
available in enough numbers, there will be 2 replicates of each dose and two controls.
The treatments will be randomly assigned amongst the bins. Fish will be moved from the
tank containing the diseased animals to the test bins directly.

The treatments will be allowed to run for one hour, after which they will be neutralized
with a MinnFinn neutralizer. As it will be impossible to follow individual fish post
treatment or to repeat treatment, only one treatment will be applied and evaluated in the
preliminary trials. If deemed necessary, recommendations will be made on how to design
a setup for multiple treatments. On site resources at some facilities may allow for such a
design.

Efficacy will be evaluated through the use of skin scrapes. Once on site, skin scrapes
will be done on 6 fish from the infected tank or pond to verify the outbreak of disease and
to identify the infecting organism. Of the fish going into treatment, 50% will be scraped
prior to treatment and evaluated on the level of infection; mild, moderate or severe. The
level of infection will be based on the number of organisms upon scrape and the overall
appearance of the fish with regards to behavior and presence of lesions. Post treatment
100% of the fish will be evaluated. The fish examined prior to treatment will be marked,
so post treatment evaluation can be compared to prior.

The skin scrape used for determination of infection will be standardized on each fish.
Fish will first be anesthetized using MS222. Using a 22mm x 22mm cover slip, a scrape
will be done over a 2.5 cm long length of skin and the resulting sample placed on a slide
and covered with the cover slip. If a lesion is present, it will be scraped in the same
manner. If required, a small amount of fresh water will be used to flood under the cover
slip to ensure the sample does not dry up and to allow easier viewing.

Testing will be done on diseased fish which will be initially identified by the
owner/manager of the facility. Once the owner/manager has identified a problem, plan is
to have myself notified so a test treatment can be applied. Focus will be on primarily
parasitic infections, protozoa and flukes. Some of the most common infections are from
Costia (Ichthyobodo necatrix), Trichidina sp. And Gyrodactylus sp. Following
confirmation of infection, the set up of the equipment can commence for efficacy testing.

The number of full replicated on site efficacy tests will depend on the quality of the
outbreak, i.e. severity, and the number of fish involved. For confidence there should be a
total of 5 tests done over at least three facilities which have good replication and readably
identifiable disease process underway. Also within these tests would be a good range in
fish size. Most likely fish tested will be small as larger fish in large number is not
common place at many facilities.

Also included in this portion of the work is continued evaluation of the neutralizing
capacity of sodium bicarbonate to MinnFinn in various types of water and various doses.
The evaluation will be done through titration in water ranging from deionized to full
strength seawater.

Results and Discussion

Permission was obtained for testing at five facilities, 2 farms, one retail location and two
private ponds. The first site visited was Harrison Koi, (Riverside, CA). There were 4
tests done at this location. Two of the trials were in the experimental bins and the other
two in production tanks.

Trial 1, August 1, 2007 Harrison Koi Farm

The experiment was run in 6 green plastic 80 l bins filled with fresh ground water at
21.2ºC a ph of 8.2 and a DO of 7.3 ppm after 30 minutes of aeration. Each bin had a
battery operated aerator to remove nitrogen in the new water and maintain oxygen levels
during testing. The bins were also place in a constantly shaded area to avoid water
heating and temperature did not increase by more than one degree C over the treatment
period.

The protocol for scraping was changed as mentioned above to eliminate the anesthesia of
the fish. Fish were placed in a shallow plastic container with approximately 3 inches of
water. While one person held the fish upside down, a scrape was taken on the ventral
side between the pectoral and pelvic fins moving in the direction of head to tail.

The fish tested in this trial were in the same size range of 15.25 cm to 20.32 cm. In this
trial there were two replicates for each treatment and control. Again both 10 ppm and 25
ppm MinnFinn were tested. As with the first trial there were 5 fish randomly assigned to
each bin. In this trial each of the five fish from one of the replicates of each treatment
was scraped to give a pre treatment view of parasite loading. After the treatment, 3 fish
from each bin from those screened previously were randomly selected post treatment and
reexamined. Of the bins with fish not prescreened, each of the fish was scraped to
monitor for parasite loading after the treatment. Please refer to Table 4 for both Prior and
Post treatment parasite loading.

In this trial the fish in both replicates of the 25 ppm treatment started showing signs of
stress to the treatment only 20 minutes in. The treatment was immediately neutralized
and the fish’s behavior returned to normal. There were no mortalities the days following
the treatment. A 25 ppm dose appears to have a toxic effect and should not be
recommended for use.

There was a significant difference between treated and untreated fish (ANOVA, P≤0.05).
MinnFinn has shown to eliminate the parasite Trichodina from Koi effectively at both the
10 ppm and 25 ppm doses. The 25 ppm dose was only present for 20 minutes so the
effect was quite rapid. All treated fish had no live Trichodina found in skin scrapings.
Control fish did however have parasites present. There were also fewer Dactylogyrus on
the treated fish but starting numbers of the parasite were so low that no determination as
to the effectiveness MinnFinn can be made. A true fluke infestation is required to make
this determination.
Water pH and temperature were monitored through the treatment. The starting
parameters were pH 8.2 and Temp of 20.6 to 21.2. The average levels during treatment
were pH 8.55 and 20.8ºC for the controls, pH 8.45 and 20.8ºC for 10 ppm and pH 8.3 and
20.9ºC for the 25 ppm treatments. Again there was a much smaller change in pH when
compared to that of the water used in the Phase I experiment.

Trials 2 and 3, August 7 and 8, 2007 Harrison Koi Farm
With the results observed in the last trial, the owner of Harrison Koi, Terry Harrison
volunteered to have a production tanks of fish treated. For Trial 2 a single tank was
selected. The tank was the same origin tank of the fish used in trial 1. As these fish were
showing signs of a Trichodina infection, it was selected for testing first. If the treatment
proved effective and not harmful, the entire holding facility was to be treated.

Upon inspection of 6 fish from the tank to be treated, it became apparent that a
Trichodina infestation was occurring. In each scrape from the six fish there were more
than 25 organisms present. The tank was 1287 l and was treated with 10 ppm MinnFinn
(42.93 ml) for 1 hour. Prior to the start of the treatment the water was shut off and an air
stone was added to ensure adequate oxygen levels.

During treatment the fish acted somewhat agitated in the beginning but settled down to
normal behavior after approximately 10 minutes. This is normal when doing static bath
treatments with most any chemical. After the 1 hour treatment duration, the neutralizer
was added. Post treatment skin scrapes from 6 fish showed a complete elimination of
Trichodina from the fish.

The starting pH was 8.3 with a water temperature of 20ºC and a DO of 5.9. The pH
dropped to only 8.2 during treatment. The DO increased to 6.9 and was most likely due
to the hydrogen peroxide component of the MinnFinn. Even with the high buffering
capacity of the hard water and small change in pH, the effectiveness of MinnFinn does
not seem to be affected much.

With the success of Trial 2, Terry Harrison asked that the whole facility be treated.
Please see Table 5 for the scope of the treatments done, doses and neutralization. A total
of 21 tanks were treated.
Table 4: Parasite Loading of Fish Used for the Testing of MinnFinn Prior and Post
   Treatment in Trial 2

Prior to                                                 Post
Treatment                                                Treatment
Bin/Treatment    Fish #   Parasite Load                  Bin/Treatment    Fish #   Parasite Load
Bin 1/ Control   Fish 1   3 Trichodina                   Bin 1/ Control   Fish 1   3 Trichodina, 1 Dactylogyrus
                 Fish 2   9 Trichodina                                    Fish 2   6 Trichodina, 1 Dactylogyrus
                 Fish 3   8 Trichodina                                    Fish 3   3 Trichodina
                 Fish 4   3 Trichodina
                 Fish 5   4 Trichodina

Bin 2/ 10 ppm    Fish 1   14 Trichodina                  Bin 2/ 10 ppm    Fish 1   None
                 Fish 2   8 Trichodina                                    Fish 2   None
                 Fish 3   10 Trichodina                                   Fish 3   None
                 Fish 4   6 Trichodina
                 Fish 5   29 Trichodina

Bin 3/ 25 ppm    Fish 1   7 Trichodina, 1 Dactylogyrus   Bin 3/ 25 ppm    Fish 1   None
                 Fish 2   5 Trichodina                                    Fish 2   None
                 Fish 3   6 Trichodina                                    Fish 3   None
                 Fish 4   15 Trichodina
                 Fish 5   3 Trichodina
                                                         Bin 4/Control    Fish 1   3 Trichodina, 1 Dactylogyrus
                                                                          Fish 2   5 Trichodina
                                                                          Fish 3   4 Trichodina
                                                                          Fish 4   1 Trichodina
                                                                          Fish 5   3 Trichodina

                                                         Bin 5/10 ppm     Fish 1   None
                                                                          Fish 2   1 Dactylogyrus
                                                                          Fish 3   None
                                                                          Fish 4   None
                                                                          Fish 5   None

                                                         Bin 6/25 ppm     Fish 1   None
                                                                          Fish 2   1 Dead Trichodia
                                                                          Fish 3   None
                                                                          Fish 4   None
                                                                          Fish 5   None
Table 5: Tank Specifics for Volume, MinnFinn Dose, Neutralizer Amounts for
Complete Holding Facility Treatment at Harrison Koi August 8, 2007
Tank Type Volume Number MinnFinn Sodium Bicarb. Sodium Thio.
(l) of Tanks (ml)/Tank (g)/Tank (g)/Tank
Small Tanks 1287 8 42.93 138.99 10.68
Large Tanks 3520 8 116.25 380.18 29.34
Gutters 1287 2 42.93 138.99 10.68
Catch Basins 2650 2 88.39 286.16 22.08
Pond 30283 1 1010.17 3270.40 252.34
Sample scrapes from three fish were taken from each of the large and small tanks. The
large tanks contained larger fish from 20.32 cm to 45.72 cm. The small tanks contained
fish in the 15.25 cm to 20.32 cm size range. The layout had two rows of small tanks
along the outside and two rows of large tanks on the inside (Figure 1). Tanks that were
not treated were either empty or had recently been treated with another compound. Tank
numbering had the rows with a letter designation and the columns a number designation.
The fish in tanks D2 to D8 were all brought into the facility at the same time. These were
the fish that demonstrated the infestation of Trichodina. All other fish scraped had no to
very few Trichodina. As with most parasitic infections, they can run through the facility
fairly quickly once established in one section so Mr. Harrison asked that the entire
facility be treated.
Figure 1: Harrison Koi Sales Room Tank Layout
A
Catch
B Basin
Catch
C Basin
D
1 2 3 4 5 6 7 8
For experimental purposes, 4 tanks were examined post treatment to determine the
treatments effectiveness. Tanks D3, D4, D5 and D6 all had heavy infestations of
Trichodina prior to treatment and were selected for exam post treatment. Another factor
that was requested by Mr. Harrison was to leave the water flowing in two of the tanks and
determine if the treatment was still effective. The water in D5 and D6 was therefore left
on at approximately 3.75 lpm.
After one hour of treatment, the skin scrapes from all fish, 3 per each of the 4 tanks,
showed an elimination of the infestation. There was one live Trichodina found on one
fish. All of the fish showed no impact from the treatment. A report 7 days aftertreatment from Mr. Harrison stated there were no mortalities and the feeding response in the fish has been very good. He is anxious to add this tool to his treatment regime. Trial 4, August 15, 2007 Laguna Koi The retail location where testing was done was Laguna Koi in Laguna Beach California. Laguna Koi is an upscale retail establishment selling Koi and goldfish as well as supplies and feed. The owner Ben Plonski invited me to come and look at fish to see if there were any individuals that may make good candidates for testing. When shipments come from Japan, they often will have some parasite loading. Sampling was done using scraping as described in Trial 2. All equipment between tanks was sterilized in a bleach bath on site. Upon examination of Koi from two tanks, there were no parasites found. Three fish were inspected from a recent Japan shipment and two from a tank that was thought to have a problem with Costia. Two black moors were also examined as they were showing clinical signs of parasitic infection. The copepod Argulus was found on one fish which would definitely cause scratching but was in such low numbers that a test treatment would not give an indication of efficacy. Mr. Plonski noted two Koi showing severe signs of Dropsy in two different tanks. These animals were caught and examined. Both fish had severe ascities and hemorrhaging around the scales. Fish 1 (20.32 cm) had a much more distended abdomen and exophiala than Fish 2 while Fish 2 (25.40 cm) had more severe hemorrhaging and ulcerative lesions. They both also had severe Costia infestations. Fish 1 had a single Gyrodactylus in the initial scrape while Fish 2 had 5. Both fish were placed in an 80 l bin and treated in 60 l of water at 10 ppm. Repeated skin scrapes were done at 0.5 hr, 1 hr, 1.5 hr and 2 hr. These fish were to be euthanized due to the extent of disease so it was opportune to do an extended treatment and monitor the effects. Due to the extent of the disease in Fish 1, the stress of handling and treatment induced mortality. At 1.75 hrs into treatment Fish 1 was dead. At 0.5 hrs into the treatment, the level of Costia on both fish was reduced. Many were dead and far fewer live organisms. There were also no live Gyrodactylus in either fish’s sample. Fish 2 did have one dead Gyrodactylid in the sample. After 1 hr the majority of Costia were dead. In the sample from Fish 1 there was one section of the scrape where live Costia occurred. It was odd that the majority were dead. It was hypothesized that with the severe distension of the scales on these fish, organisms may have been harbored in the scale pocket within the mucus layer protecting them from the treatment. The action of scraping removed these and they show up live in the sample. The sample from Fish 2 had no live Costia. Both fish had no Gyrodactylus. After 1.5 hrs samples from both fish showed no live Costia. Fish 1 had one live very large Gyrodactylus. This was also the last scrape from this fish as it died shortly after the
last handling. At 2 hours Fish 2 was behaving normally and the last scrape sample
showed mostly dead Costia with a small patch of live organisms. These may have
originated from a protected area as described earlier. It appears that the extended
duration did not have any immediate affects on the fish.

Necropsies were done on both of the fish. Both had a very similar presentation with a
large amount of fluid in the peritoneum which looked to contain some blood. The major
organs looked pale and the kidneys were enlarged. It looked most like an infection of the
bacteria Aeromonas hydrophila. A common organism that can cause severe septicemia
with a presentation as noted in these animals. Mycobacteriosis can have similar gross
clinical signs but internally the presentation is much different.

Trial 5, August 31, 2007, California Koi

The fifth trial was executed at California Koi in Fallbrook California. The owner Takemi
Adachi had experienced an elevated mortality in one tank of approximately 500, 7.5 cm
to 10 cm koi juveniles. He allowed for an inspection of the fish and testing on a
subsample using MinnFinn. The infected tank was 6000 l with a flow rate of
approximately 7 to 15 l/min.

The fish were extremely fragile and in an advanced state of disease. Morbid fish were
dying due to the handling from the tank to the transport bucket and holding. The owner
recovered 30 fish for screening and testing. The initial sampling was through skin
scrapes and was carried out as described in other trials. At the sampling of the skin
scrape, it was noted that the mucus level on the fish was thick and it was thought that
there was a parasite load. Other clinical signs included lethargy with mild hemorrhagic
lesions on 2 of the 5 fish examined. 3 of the fish also had some mild abdominal swelling.

Upon initial screening of skin scrapes, no ectoparasites of any consequence were noted
on any of the fish examined. Only 2 had very mild levels of Costia and one with a single
dactylogyrid fluke. The owner agreed to terminal sampling so gill samples were taken
and examined.

The gill samples were taken from the right side on all of the animals from the first two
arches. A small portion of the gill tips was taken and placed on a slide. A cover slip was
then placed on the sample and water applied to the edge. Surface tension carried the
water under the cover slip to help suspend the sample and prevent rapid drying.

The gross examination of the gill clips revealed a severe infection of the gills most likely
bacterial in origin. There was a severe level of epithelial hyperplasia and fusion with
sloughing of cells and mucus. The impact on the fish was severe and was causing severe
mortality of about 3%-4% per day.

A test was set up using five of the test bins with 60 l of water. Two of the bins were used
as controls and three were treated at 10 ppm. Five fish were placed in each bin. The
treatment was run for one hour and all of the surviving fish were examined by skin
scrape. After the termination of the treatment there were 4 control fish alive and 11 test
treatment fish. The control fish again had very congested gills with significant cellular
and mucus debris. There also was a fair degree of epithelial proliferation on the gill.
The fish from the treated group still showed significant proliferation but much of the
debris had been eliminated and congestion was reduced. With this it was decided to
collect gill tissue from five more fish from the infected main tank for histology. The
histological sample was cut from the fish with the arch so the filaments would remain
attached and be better for sectioning. All samples were taken from the first two arches on
the right side of the fish.
In order to compare the animals after treatment, enough chemical was left for the owner
to do a single 10 ppm treatment and neutralization on the affected tank. Application was
as described in Trial 4. The treatment was conducted on September 1, 2007. Due to the
advanced state of disease in the tank, approximately 50% of the fish were lost at
treatment which is common with any treatment during an advanced state of disease. The
fish that survived the treatment however had no mortality the following 14 days. On
September 9, 2007, five fish were examined through a gill clip. The gills were in much
better condition with less congestion and more definition returning to the lamellar
architecture. The owner reported that he was amazed at how much better the fish were
doing and was pleased with the treatment.
From the fish sample for whole gill observation, samples of gill were also taken for
histology. Sampling was as described above except the sample was taken from the left
side, opposite from where the whole mount sample was taken.
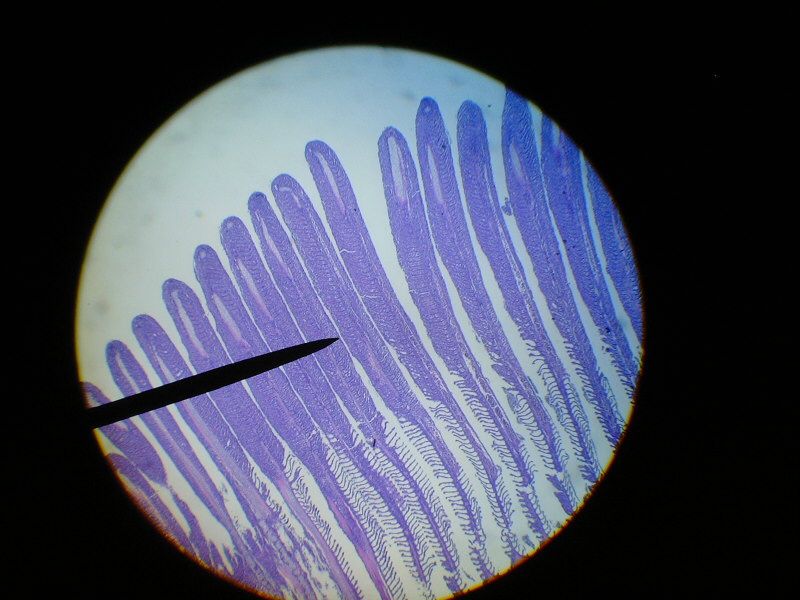
Pathology
The gills from the pre-treatment fish demonstrated extreme secondary lamellar fusion.
Samples were collected from six fish and all showed severe fusion. A presentation like
this is often due to bacterial and parasitic infections. In this case a bacterial infection is
most probable as no parasites were seen in whole mounts. See Figures 2 and 3 for
examples from these samples.
Figure 2: Pre-treatment gill sample Figure 3: Pre-treatment gill sample
displaying severe secondary displaying severe secondary
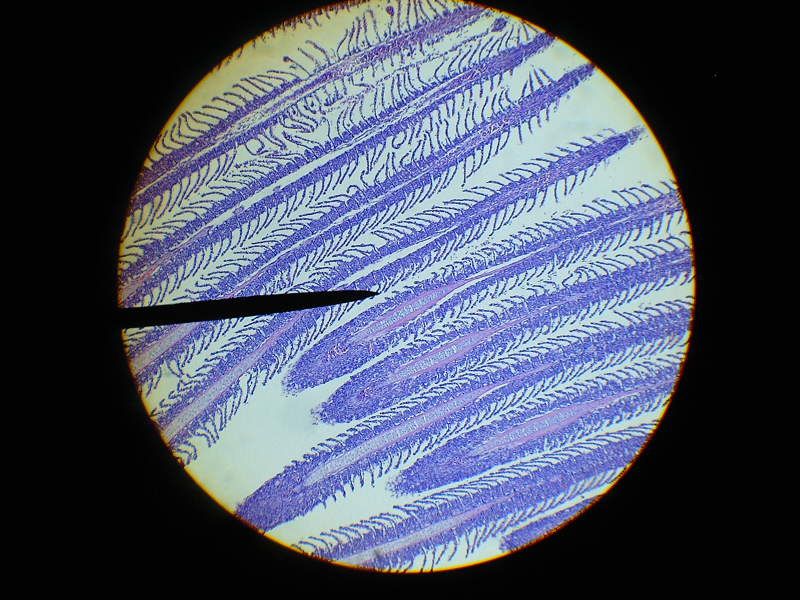
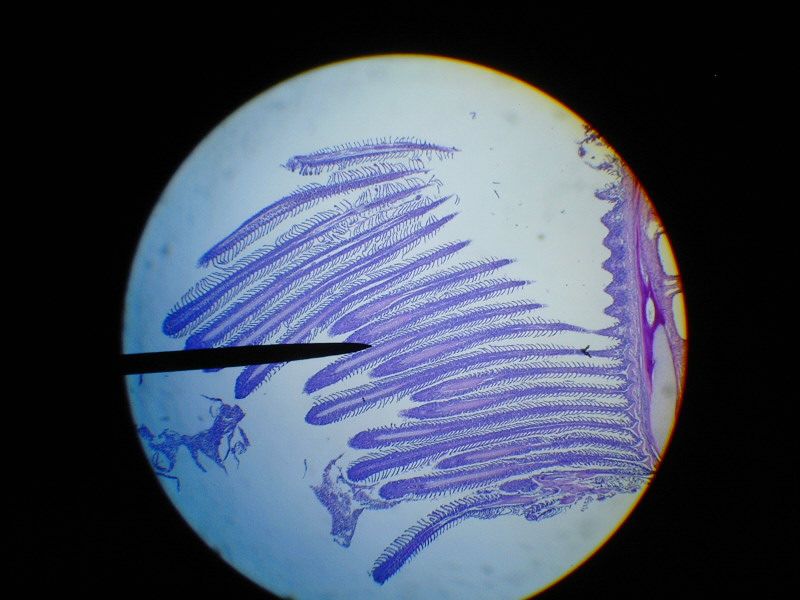
lamellar fusion 40x lamellar fusion 100xIn the six post-treatment fish sampled there appears to be a healing process occurring. In
each of the fish there was notable reestablishment of normal architecture with individual
secondary lamellae returning. One of the samples was almost normal in appearance. See
Figures 4 and 5 for examples of two of the samples.
Figure 4: Post-treatment gill sample Figure 5: Post-treatment gill sample
displaying improved secondary displaying improved secondary
lamellar fusion 40x lamellar fusion 100x
Trial 6 and 7, September 14 and 27, 2007, Tom Hawthorn
Mr. Hawthorn is a private pond owner with a 50,000 gal pond. He has very little
filtration with waterfowl living on the pond. The influx of nutrients induced a series of
algae blooms throughout the summer. Mr. Hawthorn allowed some water to be sampled
for MinnFinn testing. The water was very heavily loaded with algae and an estimated
secchi depth of 2 to 6 inches was made.
Two gallons of water was sampled from the pond in clean one gallon water bottles on
each September 14, 2007 and September 27, 2007. On both sample days the pond was in
full bloom with a suspended phytoplankton. The water was examined microscopically
using 400 x magnification. Each sample was made up from three 10 µl sample placed on
a slide and covered with a glass cover slip.
Upon examination of sample from both sample days a unicellular algae (a) was found to
be the most dominant. The identification is difficult. The organism appears to be
spherical with rigid spines on the outer surface (Figure 6). Another species found (b) was
believed to be the green algae Scenedesmus sp. (Figure 6). Also present in the sample
were several species of diatoms and some invertebrates including a rotifer species.
The following procedure was used for both test days unless otherwise stated. For testing
the sample water was measured into one liter subsamples in 6 1 liter beakers the same
day as collection. Two of the beakers were left untreated as controls. Two were treated
at a 5 ppm dose of MinnFinn and the last two treated at 10 ppm. The beakers were left in
the sun so photosynthetic activity could be observed with the formation of bubbles on the
side of the beaker due to oxygen production.
Trial 6After 30 minutes of treatment, the 5 ppm samples appeared to have little impact. Microscopic examination revealed mostly healthy cells with a few clear ones. The 10 ppm however had approximately 25% of the cells observed with contents starting to clear or cells completely clear. Forty minutes into the treatment, the beakers were observed for bubble coverage inside the beaker wall. The control beakers had approximately 80% of the wall covered while the 5 ppm beakers had 60% to 70% and 10 ppm 50% to Figure 6: Algal Cells in Suspension from a Water 60%. There appeared to be Sample Collected from the Pond of Mr. Tom Hawthorn decreased photosynthetic activity in treated samples. a After 1 hour of treatment the sample at 10 ppm was a showing a good effect with most of the cells clearing and appearing dead. The 5 ppm sample still showed b approximately 75% of the a cells looking normal. The beaker with the control sample had the same appearance prior to the start of the experiment, still with live protozoa. Both of the test beakers had no living protozoa in the microscope samples. The treatment was terminated 90 minutes after start by adding the sodium bicarbonate and sodium thiosulphate neutralizer. The control beakers were still as in the beginning and contained approximately 10% dead algal cells. The 5 ppm sample looked to have approximately 25% dead cells with no invertebrates and the 10 ppm beakers contained approximately 75% dead cells and again no invertebrates. The 10 ppm dose appeared to be quite effective. The beakers were left overnight to see what longer term impact may look like. After 20 hours the control beaker still looked as it did on treatment day with heavy bubble formation on the side of the beaker and a healthy green color. Some settling occurred and the sample was stirred prior to subsampling for microscopic exam. Microscopic inspection demonstrated many healthy cells. The sample treated at 5 ppm had somewhat less bubbles on the side of the beaker and was not as brilliant in color. The 10 ppm had no color and was only turbid with no bubble formation.
A dissolved oxygen and pH reading was taken from each beaker. The control had a
Dissolved Oxygen of 14.5 ppm which is 170% of saturation at the 26.4ºC temperature.
The photosynthetic activity producing oxygen super oxygenated the water. In the 5 ppm
treatment beaker the oxygen level was 11.7 ppm. Again this is above saturation at 142%
indicating that algal activity is still present. The Dissolved oxygen of the 10 ppm dose
was 6.9 ppm which is only 80% of saturation. With this level it is apparent that the algae
was deactivated and possibly rotting and consuming oxygen dropping levels below
100%.

The pH also reflected a similar trend as in water that contains highly photosynthetic
plants will be higher than other water. The control sample had a pH of 10.4, 20 hours
after the termination of treatment. The 5 ppm beaker was at 9.7 and the 10 ppm sample
at 9.4.

               Trial 7

The difference between trial 6 and trial 7 was that the termination of the treatment
occurred at 60 minutes. The cross section of the algae in the sample was the same as in
Trial 6. The pre-treatment dissolved oxygen levels were 14.6 ppm to 15.6 ppm in all of
the beakers and pH between 9.4 and 9.8.

The observations of bubble formation in the beakers were similar to the previous trial.
The appearance of the beakers also followed suit with the control sample being very
green, the 5 ppm slightly less so and the 10 ppm having no green color. The oxygen
levels post-treatment were 13.9 ppm for controls, 10.0 for 5 ppm and 6.1 ppm for 10
ppm. These results are similar to the previous trial.
 The microscopic examination was also similar to that of Trial 6. The pre-treatment
samples contained large numbers of live cells with few dead. After treatments were
completed, the control looked as the pre screen did, the 5 ppm treatment had a mild to
moderate increase in cells that appeared dead (~40%) and finally at 10 ppm the majority
of cells (>90%) appeared dead or dying.

Trial 8, September 17, 2007, Jim Migliaccio

Mr. Migliaccio is the owner of a 7570 l pond. He had called about a water clarity
problem. Upon arrival at the pond site it was apparent that an algal bloom was in
process. The bottom of the pond at q depth of 106.7 cm depth. The pond is a concrete in
ground pond with a neoprene paint painted liner. Mr. Migliaccio consented to a test
treatment to terminate the algal bloom.

A microscopic examination revealed a mild bloom with few very small cells. The algae
may be a nannocloropsis like organism due to its small size.

The temperature was 20.6ºC, dissolved oxygen 7.6 ppm and pH 8.4. A treatment of 10
ppm was prescribed giving a dose of 259.78 ml MinnFinn and for neutralization 837.93 g
of sodium bicarbonate and 64.56 g of sodium thiosulphate. The treatment was set for one
hour. The application of the treatment and neutralizer was done by first diluting in a 20 l bucket with 15 l of pond water and distributed across a large part of the pond surface. The following day Mr. Migliaccio reported a drastic improvement in water quality. It appeared that the treatment was effective. With the small size of the cells, it is difficult for the filter to remove the organisms. With this a clumping or clarifying agent was added to the water to assist with final clarification. It appears that MinnFinn is effective at deactivating phytoplankon in suspension. If MinnFinn is used for algal suppression, a clarifying agent should be recommended for final particulate removal.
You can also read