First-Order Groundwater Availability Assessment for the Lower Athabasca Region, Eastern Alberta - AER/AGS Open File Report 2020-05
←
→
Page content transcription
If your browser does not render page correctly, please read the page content below
AER/AGS Open File Report 2020-05

                          First-Order Groundwater
                          Availability Assessment for the
                          Lower Athabasca Region,
                          Eastern Alberta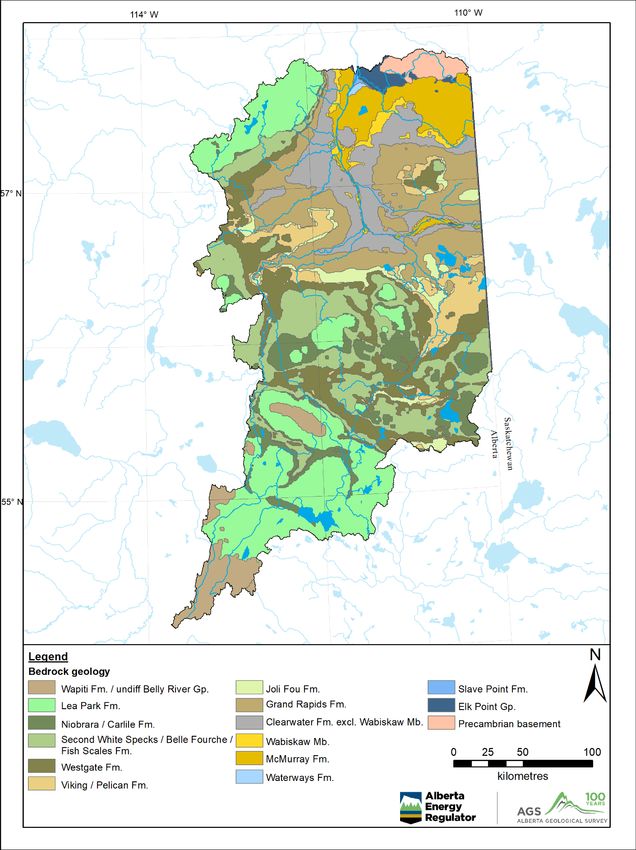
AER/AGS Open File Report 2020-05

First-Order Groundwater Availability
Assessment for the Lower Athabasca Region,
Eastern Alberta

J. Klassen

Alberta Energy Regulator
Alberta Geological Survey

March 2021
©Her Majesty the Queen in Right of Alberta, 2021
ISBN 978-1-4601-4926-3

The Alberta Energy Regulator / Alberta Geological Survey (AER/AGS), its employees and contractors
make no warranty, guarantee or representation, express or implied, or assume any legal liability regarding
the correctness, accuracy, completeness or reliability of this publication. Any references to proprietary
software and/or any use of proprietary data formats do not constitute endorsement by the AER/AGS of
any manufacturer’s product.

If you use information from this publication in other publications or presentations, please acknowledge
the AER/AGS. We recommend the following reference format:

Klassen, J. (2021): First-order groundwater availability assessment for the lower Athabasca region,
    eastern Alberta; Alberta Energy Regulator / Alberta Geological Survey, AER/AGS Open File Report
    2020-05, 19 p.

Publications in this series have undergone only limited review and are released essentially as submitted
by the author.

Published March 2021 by:
Alberta Energy Regulator
Alberta Geological Survey
4th Floor, Twin Atria Building
4999 – 98th Avenue
Edmonton, AB T6B 2X3
Canada

Tel:       780.638.4491
Fax:       780.422.1459
Email:     AGS-Info@aer.ca
Website:   www.ags.aer.ca

                                                                 AER/AGS Open File Report 2020-05     • iii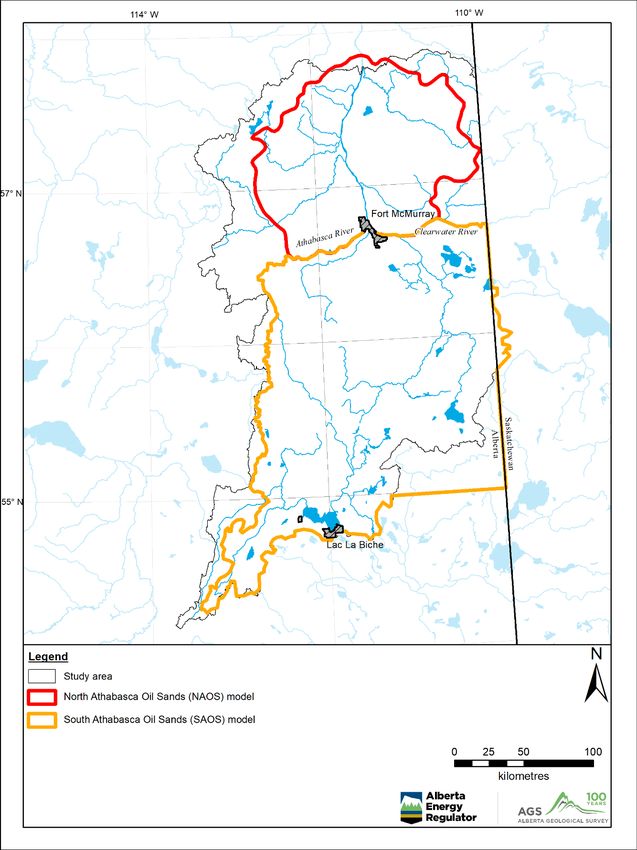
Contents
Acknowledgements ....................................................................................................................................... v
Abstract ........................................................................................................................................................ vi
1 Introduction.............................................................................................................................................. 1
2 Background .............................................................................................................................................. 1
  2.1 Study Area ....................................................................................................................................... 1
  2.2 Geology and Athabasca Oil Sands ................................................................................................... 3
  2.3 SAOS and NAOS Groundwater Models.......................................................................................... 5
  2.4 Yield Mapping ................................................................................................................................. 5
3 Aquifer Yield Mapping Methods............................................................................................................. 8
  3.1 Recharge .......................................................................................................................................... 8
        3.1.1 Model Approach.................................................................................................................... 8
                   3.1.1.1 SAOS Model............................................................................................................ 8
                   3.1.1.2 NAOS Model ........................................................................................................... 9
        3.1.2 Baseflow Approach ............................................................................................................... 9
  3.2 Discharge ....................................................................................................................................... 10
  3.3 Water Volume................................................................................................................................ 10
4 Results and Discussion .......................................................................................................................... 12
  4.1 Aquifer Yield Continuum .............................................................................................................. 12
  4.2 Limitations ..................................................................................................................................... 14
5 Summary ................................................................................................................................................ 14
6 References.............................................................................................................................................. 15
Appendix 1 – Aquifer Yield Continuum Classes........................................................................................ 18

Tables
Table 1. Equations used for calculating the yields for each aquifer yield class ............................................ 7
Table 2. Aquifer yield continuum classes for the lower Athabasca region of eastern Alberta ................... 19

Figures
Figure 1. The study area of the lower Athabasca region partially overlaps with the Lower Athabasca
           Land-use Framework Region ...................................................................................................... 2
Figure 2. Bedrock geology within the lower Athabasca region .................................................................... 4
Figure 3. Model boundaries for the South Athabasca Oil Sands and North Athabasca Oil Sands models .. 6
Figure 4. Aquifer yield classes...................................................................................................................... 8
Figure 5. a) Bedrock units in the study area to a depth of 150 m below ground surface. The Hydrologic
           Unit Code Watersheds of Alberta level 8 watersheds are overlain. b) Southwest-northeast
           cross-section identified by red line in a) ................................................................................... 11
Figure 6. Recharge estimates from the model approach and baseflow approach for Hydrologic Unit Code
           Watersheds of Alberta level 8 watersheds in lower Athabasca region ..................................... 12
Figure 7. a) Areal recharge and b) volumetric recharge for each Hydrologic Unit Code Watersheds of
           Alberta level 8 watershed in the lower Athabasca region, eastern Alberta ............................... 13
Figure 8. Hydrologic Unit Code Watersheds of Alberta level 8 watersheds .............................................. 18

                                                                                                    AER/AGS Open File Report 2020-05                         • iv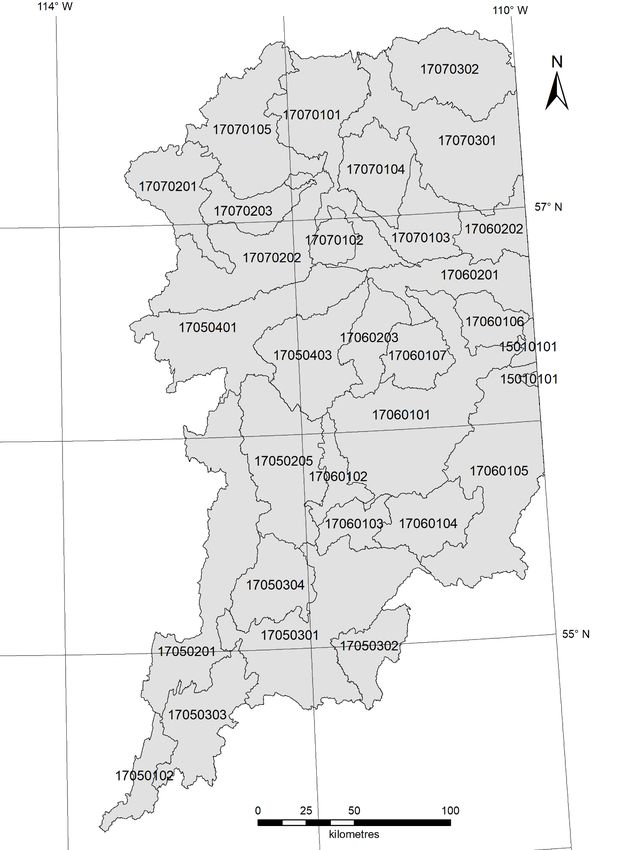
Acknowledgements
The author would like to thank Alberta Environment and Parks for allowing us to use the groundwater
models for the North and South Athabasca Oil Sands areas.
From within the Alberta Energy Regulator / Alberta Geological Survey, the author would like to thank
Amandeep Singh for working with the models from Alberta Environment and Parks and extracting
recharge surfaces; Laurence Jayawardane for extracting geological volumes from version 3 of the
Geological Framework of Alberta; and Ernst Kerkhoven for sharing the exceedance-flow calculation tool
that analyzes data from the Water Survey of Canada’s HYDAT database.

                                                               AER/AGS Open File Report 2020-05       • v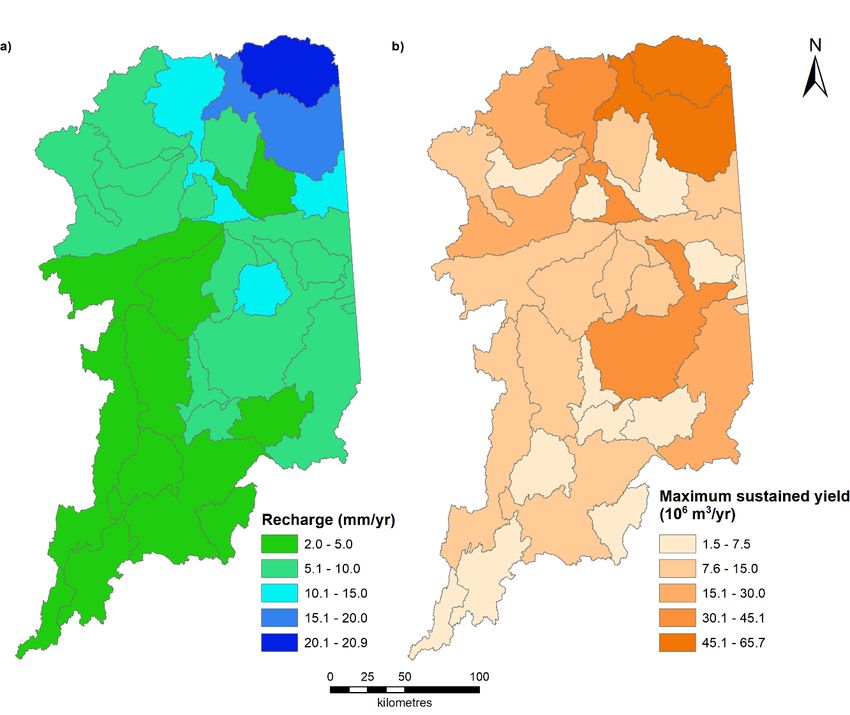
Abstract
Groundwater is an important resource in Alberta. In order to evaluate the impact of potential groundwater
withdrawals on groundwater availability, it is necessary to quantify the amount of available groundwater
and compare this to the total groundwater allocations. The Alberta Geological Survey has adopted an
approach to provide a regional first-order assessment of groundwater availability in Alberta based on an
aquifer yield continuum concept. Groundwater yield within 150 m below ground surface is quantified
along a spectrum of total groundwater availability and is bound by two extremes: nonuse and maximum
mining. The aquifer yield continuum depends on hydrogeological parameters such as recharge,
discharge, and water volume, and the method of quantifying each parameter may vary depending on
scale, data availability, hydrogeological regime, climate, and landscape characteristics of the study area.
Other governing factors such as environmental flow needs, and input from the community and local
stakeholders can be accounted for to manage the degree of impact of groundwater withdrawal on the
hydrogeological system.
This report documents the work completed in the lower Athabasca region, the fourth area in Alberta
mapped using the aquifer yield continuum approach. The aquifer yield continuum can be divided into five
classes: nonuse, permissive sustained yield, maximum sustained yield, permissive mining yield, and
maximum mining yield. The permissive sustained and permissive mining yields fall along the continuum
at some point between nonuse and maximum sustained yield, and maximum sustained yield and
maximum mining yield, respectively. The nonuse, maximum sustained yield, and maximum mining yield
are constrained by the physical hydrogeological system. This study focuses primarily on the maximum
sustained yield, which is equated to the natural rate of recharge. It is the maximum amount of
groundwater that is available in the hydrogeological system without mining groundwater. Previous
studies in Alberta used two different approaches, baseflow and a one-dimensional soil moisture model, to
quantify recharge. This report uses the recharge parameter from groundwater models created for the
North Athabasca Oil Sands and South Athabasca Oil Sands areas. Results show that average recharge is
7 mm/yr with a range from 2 to 21 mm/yr.
Groundwater yields are calculated on a watershed basis and results show that the maximum sustained
yield varies from 1.5 x 10⁶ to 65.7 x 10⁶ m3/yr. Groundwater abstraction equal to the maximum sustained
yield would have a significant impact on the hydrogeological system, including major impacts on surface
water bodies. The aquifer yield results of this study can be used to assess potential, order of magnitude,
regional groundwater yields, and to compare relative differences between watersheds. Additionally,
results can be used as a screening or risk assessment tool to identify watersheds of interest, after which
further groundwater assessments could be conducted considering local knowledge and specific scenarios.
The aquifer yield continuum methodology can be adapted and utilized to focus the assessment of aquifer
yield to the specific area of interest, incorporating local knowledge of the groundwater system and desires
of the community, stakeholders, and environment.

                                                                  AER/AGS Open File Report 2020-05    • vi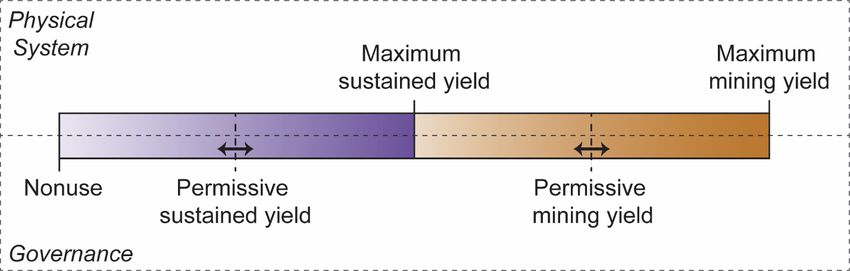
1 Introduction
Groundwater is an important resource in Alberta. In order to evaluate the impact of potential groundwater
withdrawals on groundwater availability, it is necessary to quantify the amount of available groundwater
and compare this to the total groundwater allocations. The Alberta Geological Survey (AGS) has
developed an approach for regional first-order assessment of groundwater availability in Alberta based on
an aquifer yield continuum (e.g., Pierce et al., 2013). Groundwater yield is quantified along a spectrum of
total groundwater availability and is bound by two extremes: nonuse and maximum mining. The aquifer
yield continuum is dependent on three hydrogeological parameters: recharge, discharge, and water
volume. Other governing factors such as environmental flow needs, and input from the community and
local stakeholders can be accounted for to manage the degree of impact of groundwater withdrawal on
the hydrogeological system.
The hydrogeological parameters (recharge, discharge, and water volume) can be quantified using several
different methods depending on data availability, hydrogeological regime, climate, and landscape
characteristics. For example, the AGS used different methods of assessing recharge in three previously
mapped areas of groundwater availability (central Alberta, southern Alberta, and the upper Peace region).
The aquifer yield continuum was first applied to map groundwater availability in central Alberta (Klassen
and Smerdon, 2018); where groundwater discharge to rivers (baseflow) was used to estimate recharge.
This method was chosen because the study area is characterized by near-surface bedrock aquifers with
thin overlying sediment, generally unregulated rivers with no significant water withdrawals, and abundant
river gauging data. The aquifer yield continuum concept was then applied to southern Alberta (Klassen et
al., 2018) where, when compared to central Alberta, the sediments are thicker, the climate is warmer and
dryer, agriculture is the dominant land-use type, rivers are often regulated, and hydrometric gauging data
are more variable. Depression-focused recharge is also the dominant recharge mechanism in the Canadian
Prairies of southern Alberta; therefore, a one-dimensional recharge modelling approach was used to
estimate recharge. In the upper Peace region (Klassen and Liggett, 2019), both baseflow and recharge
modelling approaches were used to estimate recharge.
The fourth and current study area is the lower Athabasca region, which is home to one of the largest
hydrocarbon resources in the world, with a complex geology that includes a combination of evaporites,
carbonates, sandstones, shales, oil sands, and thick Neogene–Quaternary deposits. There has been
extensive research and characterization of this region, which informed the development of two
groundwater models created by WorleyParsons Canada (2010, 2012). These models were used to
determine the recharge hydrogeological parameter, which is essential for the aquifer yield continuum.
2 Background
2.1 Study Area
The lower Athabasca region is approximately 58 000 km2 and located within the Athabasca River basin in
eastern Alberta, extending from Lac La Biche in the south to the confluence of the Athabasca and Firebag
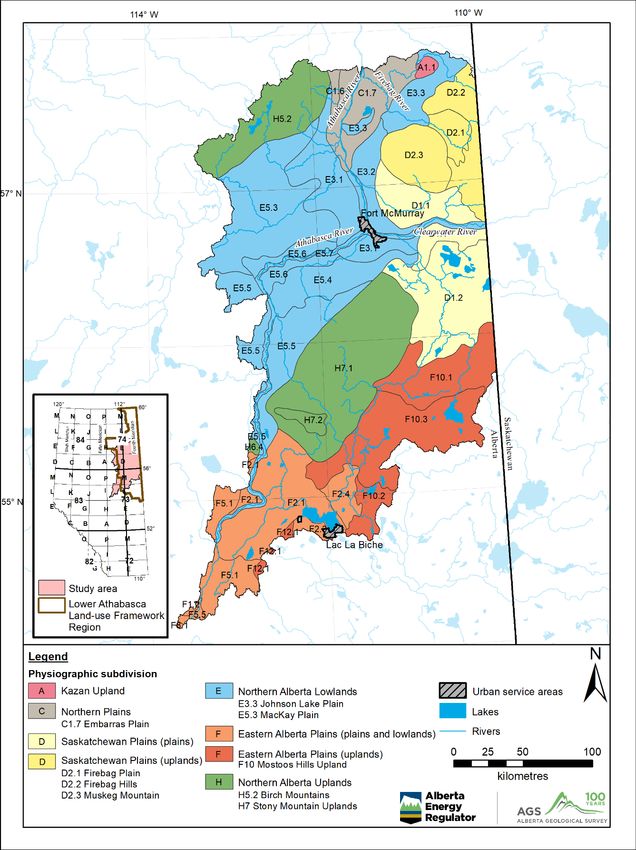
rivers in the north (Figure 1). The study area is located in the physiographic region of the Interior Plains
(Bostock, 1970) and is further divided into the physiographic subregions of the Kazan Upland, Northern
Plains, Saskatchewan Plains, Northern Alberta Lowlands, Eastern Alberta Plains, and Northern Alberta
Uplands (Figure 1; Pettapiece, 1986). Several smaller uplands include the Birch Mountains (850 m asl) in
the northwest, Muskeg Mountain (650 m asl) in the northeast, and Stony Mountain (750 m asl) south of
Fort McMurray (Figure 1; Pettapiece, 1986). The study area is within the Central Mixedwood Natural
Subregion of the Boreal Forest Natural Region (Natural Regions Committee, 2006). The uplands contain
forests and the lowlands are characterized by poorly drained wetlands. The natural drainage patterns of
the wetlands are modified in some areas due to mining (Andriashek and Atkinson, 2007; WorleyParsons
Canada, 2012).
AER/AGS Open File Report 2020-05 • 1
Figure 1. The study area of the lower Athabasca region partially overlaps with the Lower
Athabasca Land-use Framework Region (Alberta Environment and Parks, 2011). Physiographic
subdivisions (from Pettapiece, 1986) are divided into regions (e.g., A), sections (e.g., A1), and
districts (e.g., A1.1).

                                                              AER/AGS Open File Report 2020-05   • 2
The lower Athabasca region is characterized by long cold winters and short wet summers. Average
precipitation ranges from 376 mm/yr at the Aurora Climate Station to 456 mm/yr at the Fort McMurray
International Airport as calculated by WorleyParsons Canada (2010, 2012) from Environment and
Climate Change Canada climate data archives. Snowfall is between 23% and 28% of annual precipitation,
most occurs between November and March. Snowmelt occurs between March and May, resulting in
significant contributions of meltwater to springs and rivers during that time (WorleyParsons Canada,
2010). Groundwater recharge rates for sand- and till-covered settings in the Plains Region of North
America range from 1.5% to 17% of annual precipitation (Meyboom, 1967; Rehm et al., 1982; Fortin et
al., 1991; Smerdon, 2007; WorleyParsons Canada, 2010, 2012).
2.2 Geology and Athabasca Oil Sands
The Alberta oil sands are one of the largest hydrocarbon resources in the world and development related
to bitumen extraction has been occurring for over 40 years. Consequently, there has been extensive study
of the geology of the region; some examples include Hackbarth and Nastasa (1979), Andriashek and
Fenton (1989), Bachu et al. (1991, 1992, 1993), Andriashek (2003), Andriashek and Atkinson (2007), and
Utting and Andriashek (2020). From a hydrogeological perspective, Bachu et al. (1991) describes four
basic hydrostratigraphic types in the bedrock overlying the crystalline Precambrian basement:
1) evaporitic beds, which do not allow fluid movement (aquicludes), 2) shale aquitards, 3) carbonate
aquifers, and 4) sandstone aquifers, although the latter two lithologies may also act as aquitards where
bitumen is present (Bachu et al., 1991). The bedrock geology of the lower Athabasca region is shown in
Figure 2. Andriashek and Atkinson (2007) describe the buried channel systems that can act as aquifers in
the sediments above the bedrock.
There are generally two methods of bitumen extraction, each of which have different impacts on
groundwater and occur in different areas. Surface mining of the oil sands occurs in the north and
disturbances to the land surface associated with surface mining operations impact groundwater quantity at
a local to subregional scale; active mines must be dewatered, which could result in large areas of
drawdown and could impact groundwater quantity close to the surface (Alberta Environment and
Sustainable Resource Development, 2012). In the south, in situ oil sands developments recover bitumen
by injecting steam into reservoirs so that bitumen viscosity is reduced to a point where it can flow into a
well. In situ areas may experience physical and chemical effects from localized heating of subsurface
formations, and drilling could create new pathways for groundwater to travel (Alberta Environment and
Sustainable Resource Development, 2012).
In addition to bitumen extraction, there are a variety of other activities in the lower Athabasca region that
could impact the quality or quantity of groundwater, such as gas development, municipal development,
aggregate mining operations, forestry cut blocks or wood processing mills, agriculture, or natural
disturbances such as forest fires or climate variability (Alberta Environment and Sustainable Resource
Development, 2013a, b).
AER/AGS Open File Report 2020-05 • 3Figure 2. Bedrock geology within the lower Athabasca region, eastern Alberta (Alberta Geological
Survey, 2019). Abbreviations: excl., excluding; undiff, undifferentiated.
AER/AGS Open File Report 2020-05 • 42.3 SAOS and NAOS Groundwater Models
Two groundwater models were created by WorleyParsons Canada for Alberta Environment to assist in
regional groundwater management of the oil sands area (WorleyParsons Canada, 2010, 2012). The South
Athabasca Oil Sands (SAOS) model (WorleyParsons Canada, 2010) covers the area where bitumen is
extracted in situ, and the North Athabasca Oil Sands (NAOS) model (WorleyParsons Canada, 2012)
covers the area around the surface mineable bitumen. The extents of the SAOS and NAOS models are
shown in Figure 3. The purpose of the groundwater models was to 1) facilitate understanding of
cumulative effects of groundwater extraction, injection, and diversions on regional groundwater quantity
and quality; 2) assist in future environmental impact assessments (EIAs); 3) enhance understanding of
hydrogeology in natural and developed scenarios; 4) support a monitoring network (locations and
targets); 5) assist in management decisions regarding stress and risk to the groundwater system; and
6) support further development of the groundwater management framework for the region
(WorleyParsons Canada, 2010, 2012). The groundwater models are meant for regional-scale, not site-
specific decisions, therefore, they are not meant for groundwater allocation purposes, to identify local-
scale groundwater pathways, or to aid in land-use decisions (WorleyParsons Canada, 2010, 2012).
The groundwater models were created in DHI-WASY Gmbh’s FEFLOW (Finite Element subsurface
FLOW system) versions 5.4 (SAOS) and 6.0 (NAOS). They were calibrated using a parameter estimate
tool (PEST), and the water balance error was 1% and 0.004% for the SAOS and NAOS models,
respectively, which represents well-converged models (WorleyParsons Canada, 2010, 2012). Calibrated
recharge values from the models were used to determine groundwater availability in the lower Athabasca
region. The recharge parameter was initially based on previous studies for similar geographic locations
(till-covered setting in the Plains Region of North America), where groundwater recharge rates range
from 1.5% to 9% of annual precipitation for till-covered settings and 5% to 17% of annual precipitation
for sand-covered settings (Meyboom, 1967; Rehm et al., 1982; Fortin et al., 1991; Smerdon, 2007), and
calibrated along with other model parameters using hydrogeological data provided by industry that span
over 40 years. Calibrated recharge was within acceptable ranges as was simulated discharge to the
Athabasca River compared to measured baseflow.
2.4 Yield Mapping
Groundwater yield in Alberta was determined by the Alberta Research Council (ARC) from 1968–1983
and the resultant maps were digitized by the AGS in 2009 (Lemay and Guha, 2009). The maps show
estimated rates of groundwater abstraction based on geology, available pumping or aquifer test
information, and the concept of a 20-year safe yield for a well (Maathius and van der Kamp, 2006; Lemay
and Guha, 2009). These maps are useful for estimating groundwater abstraction rates throughout the
province, but were not intended for regional groundwater inventory or management purposes because
they are limited to a specific time and provide a single estimate of yield for a single well (Lemay and
Guha, 2009). The AGS adapted an approach to mapping groundwater yield based on an aquifer yield
continuum concept (Kalf and Woolley, 2005; Pierce et al., 2013), which considers the total amount of
groundwater available in the system and a range of possible yield values. This approach has been applied
in central Alberta (Klassen and Smerdon, 2018), southern Alberta (Klassen et al., 2018), and the upper
Peace region (Klassen and Liggett, 2019). Klassen et al. (2018) provides more background on the
development of the aquifer yield continuum concept.
AER/AGS Open File Report 2020-05 • 5Figure 3. Model boundaries for the South Athabasca Oil Sands (SAOS) and North Athabasca Oil
Sands (NAOS) models created by WorleyParsons Canada (2010, 2012), eastern Alberta.
AER/AGS Open File Report 2020-05 • 6The AGS approach modifies the aquifer yield continuum by Pierce et al. (2013) to incorporate other
definitions of groundwater yield (e.g., Bredehoeft, 2002; Devlin and Sophocleous, 2005; Kalf and
Woolley, 2005; Zhou, 2009). Five classes of aquifer yield are defined:
1) Nonuse (NU): no human-induced groundwater abstraction from the hydrogeological system.
2) Permissive sustained yield (PSY): can be quantified as any value between nonuse and maximum
sustained yield. Use of groundwater resource is limited, permitting discharge to surface water bodies
albeit at a reduced rate. The desired PSY is a social and environmental boundary rather than a
physical system boundary.
3) Maximum sustained yield (MSY): pumping is balanced by the maximum amount of capture, which
includes induced recharge of streamflow and zero discharge. Surface water bodies will be seriously
affected. Pumping above this value means water is continuously removed from storage and
significant impacts to the hydrogeological system will occur. In this study, MSY is equal to natural
recharge as a proxy for maximum capture, which excludes induced recharge of streamflow.
4) Permissive mining yield (PMY): includes a maximum amount of capture plus partial mining of the
aquifer, without fully depleting the theoretically recoverable volume of stored water over a planned
time horizon. The amount of aquifer mining permitted is governed as a social boundary.
5) Maximum mining yield (MMY): represents the maximum amount of capture plus all theoretically
available water stored within the aquifer over a planned time horizon. It is unlikely that this yield
would ever be reached, as not all water in an aquifer is technically recoverable, and would result in
significant alterations to the hydrogeological system.
The continuum is applied at a regional scale; therefore, a water balance approach was used to determine
the aquifer yield classes. The hydrogeological system is simplified by assuming maximum sustained yield
is equivalent to the natural state of recharge instead of including capture (discussed in Klassen et al.,
2018). Table 1 summarizes the equations used for calculating the yields for each aquifer yield class.
There is a single value for MSY and MMY and they are limited by the hydrogeological system. The PSY
and PMY are variable and can range from NU to MSY, and MSY to MMY, respectively (Figure 4). The
PSY and PMY will vary depending on aquifer management decisions, including social, environmental,
and economic aspects. Current groundwater use and desired future use can be compared to values along
the continuum to provide first-order evaluation of the degree of groundwater development.
Table 1. Equations used for calculating the yields for each aquifer yield class.
Permissive Maximum Permissive Maximum
Nonuse
Sustained Yield Sustained Yield Mining Yield Mining Yield
PPMY =
PNU = 0 PPSY = R – Dx PMSY = R PMMY = R + V0
R + (V0 – Vx)
P = groundwater withdrawal (pumping)
R = inflow into the groundwater system (i.e., recharge)
Dx = desired discharge from the groundwater system (other than pumping)
V0 = initial volume of water-saturated aquifer prior to the planning horizon
Vx = desired volume of water to remain in storage at the end of the planning horizon
AER/AGS Open File Report 2020-05 • 7Figure 4. Aquifer yield classes, modified after Kalf and Woolley (2005) and Pierce et al. (2013).
3 Aquifer Yield Mapping Methods
The aquifer yield continuum was applied at a watershed level. Watersheds are reflective of the
Hydrologic Unit Code (HUC) Watersheds of Alberta system of classification; all are at a level 8 (HUC8;
Alberta Environment and Parks, 2017) for this study. Values for the four aquifer yield classes greater than
NU are calculated for 30 watersheds within the study area, and two calculations for PSY are included to
illustrate possible PSY values.
The three hydrological parameters used to determine aquifer yield for each class are recharge (R),
discharge (Dx), and volume of groundwater in storage (V0, Vx). In this study, the SAOS and NAOS models
provided the recharge values. Discharge is based on the assumption of a closed, steady-state system
where recharge eventually makes its way out of the system as discharge. Water volumes were obtained
using data from version 3 of the Geological Framework of Alberta (GFA v3; Alberta Geological Survey,
in progress, 2021). Detailed methods on determining each of the hydrogeological parameters are
described in the following sections.
3.1 Recharge
Recharge was estimated using the calibrated recharge parameter from the SAOS and NAOS models. The
spatially distributed recharge (in mm/yr) from the SAOS and NAOS models were brought into Esri’s
ArcMap as raster surfaces. Recharge was aggregated to the HUC8 level using the Zonal Statistics tool in
ArcMap.
For comparison, modelled recharge was also compared to estimates using the baseflow approach,
described in more detail by Klassen and Smerdon (2018) and Klassen and Liggett (2019). The following
two sections outline how these two approaches were used in the lower Athabasca region. The baseflow
approach was used to see if the range of recharge values from the SAOS and NAOS models were
consistent with values from previous methods used in the province. There are some limitations to the
baseflow approach, especially in the lower Athabasca region where thick Neogene–Quaternary sediments
and poorly draining wetlands characterize the land surface. Therefore, not all of the water within HUC8
watersheds may discharge to gauged rivers and streams.
3.1.1 Model Approach
This section will discuss how the recharge parameter in the SAOS and NAOS models was determined.
3.1.1.1 SAOS Model
Groundwater recharge was applied to the top of the model domain (layer 1). For the initial steady-state
calibration, recharge was distributed based on surficial deposits. After hydraulic conductivity values were
finalized in the model, PEST was applied to optimize recharge distribution. The optimized recharge
AER/AGS Open File Report 2020-05 • 8distribution was based on topography, surficial deposits, and the calibrated hydraulic conductivity
(WorleyParsons Canada, 2010). Sandy morainal deposits of the Mostoos Hills Upland (F10, Figure 1)
were determined to have the highest recharge rate of 55 mm/yr. A recharge rate of 26 mm/yr was
determined for the Stony Mountain Upland (H7, Figure 1). Elsewhere in the model, morainal,
glaciolacustrine, and till deposits were assigned a recharge rate of 6 mm/yr. On average, recharge within
the SAOS model was 2.3% of annual precipitation or 10.3 mm/yr (WorleyParsons Canada, 2010).
3.1.1.2 NAOS Model
Groundwater recharge was applied to the top of the model domain (layer 1). The model was calibrated to
match regional, predevelopment, groundwater flow patterns (static groundwater flow) from the
conceptual model. For the steady-state calibration, recharge distribution was based on modified
DRASTIC scores, surficial geology, and estimates from previous modelling studies (WorleyParsons
Canada, 2010). Recharge distribution was optimized following calibration, both manually and using
PEST. The highest recharge rate of 28.6 mm/yr was determined for Firebag Hills (D2.2, Figure 1) and
Fort Hills (in the Northern Plains, C, Figure 1). Embarras Plain (C1.7, Figure 1), Johnson Lake Plain
(E3.3, Figure 1), Firebag Plain (D2.1, Figure 1), and the eastern area of Muskeg Mountain (D2.3;
Figure 1) were determined to have a recharge rate of 18.2 mm/yr. A recharge rate of 8.1 mm/yr was
determined for Birch Mountains (H5.2, Figure 1) and MacKay Plain (E5.3, Figure 1). The ground
moraine region of Muskeg Mountain was determined to have a recharge rate of 4.0 mm/yr. The remaining
parts of the model were expected to have lower rates and were assigned a recharge rate of 1.1 mm/yr.
Average recharge in the NAOS model was 2.4% of annual precipitation or 10.0 mm/yr (WorleyParsons
Canada, 2012).
3.1.2 Baseflow Approach
The recharge values from the NAOS and SAOS models were compared to recharge values determined by
the baseflow approach used in Klassen and Smerdon (2018) and Klassen and Liggett (2019). The
baseflow approach assumes a long-term steady-state water balance within a watershed, where recharge
and discharge are equal, written as:
R + Gin = D + P + Gout
where R is recharge, D is natural discharge to surface water, P is pumping, and Gin and Gout are
groundwater flow from neighbouring watersheds. The equation is simplified by assuming that Gin and
Gout are the same and the amount of pumping is negligible compared to the amount of water in the
aquifer. The result is that recharge is equal to discharge or ‘baseflow’, assuming that all groundwater
discharge occurs to rivers. The volume of baseflow can be divided by the surface area of the watershed to
give an average [length/time], which is equated to areal recharge.
Data for the baseflow approach is collected at hydrometric gauging stations along streams and rivers.
These data are catalogued by the Water Survey of Canada, and reviewed and published by Environment
and Climate Change Canada in a digital database called HYDAT (Environment and Climate Change
Canada, 2018). The Agriculture and Agri-Food Canada (AAFC) Watersheds Project (Agriculture and
Agri-Food Canada, 2013) delineated incremental drainage areas, which can be defined as a particular
hydrometric station’s drainage basin with its boundary between its gauging station and the next upstream
station(s).
Data from the hydrometric gauging stations within the study area were aggregated to average monthly
flows and monthly percent exceedance curves were calculated. The lowest monthly Q95 value (i.e., 95%
of the average monthly flows are higher than this value) between October and March was chosen to
represent baseflow for each station within the study area. This low flow value provides a conservative
approach to estimating groundwater discharge. A limitation of this method is that when stations have very
low flows or only record seasonally, data is not sufficient to determine a Q95 value for that month. To
AER/AGS Open File Report 2020-05 • 9overcome this limitation, the lowest average monthly streamflow value was used as an alternative (see
Klassen and Smerdon, 2018).
The Q95 value determined for each hydrometric station is not representative of the baseflow within each
incremental drainage basin, rather it is an accumulation of baseflow up until that point along the river,
which may include baseflow from other incremental drainage basins upstream. To obtain the baseflow for
a particular incremental drainage area, the Q95 value(s) of the hydrometric station(s) immediately
upstream of a given station were subtracted from that station’s value. In some cases, this resulted in a
negative Q95, which could indicate that this particular section is a losing stream, where river water enters
the groundwater system rather than groundwater entering the river. Baseflow is measured in m3/yr and
was divided by the surface area of the incremental drainage basin in order to get a recharge value in
mm/yr. The incremental drainage areas are not the same as HUC8 watersheds, therefore a spatial average
of recharge (mm/yr) was aggregated to HUC8 watersheds from incremental drainage basins. This
recharge value for each HUC8 watershed was compared with the recharge values from the NAOS and
SAOS models.
3.2 Discharge
The discharge hydrogeological parameter is used to quantify the PSY class, where Dx is the residual
discharge not captured by pumping (Table 1). The Dx is equal to recharge during nonpumping steady-
state conditions (NU class) and decreases to zero when fully captured (MSY class). The actual desired
value for discharge would result from a management decision process and, therefore, was not available
for this study. Residual discharge values were assumed to show how discharge can be incorporated into
the aquifer yield continuum. Values can be modified to be site specific, depending on hydrogeological
system, environmental flow needs, and desires of the community.
To be consistent with previous work (Klassen and Smerdon, 2018; Klassen et al., 2018; Klassen and
Liggett, 2019), two PSY values were calculated to illustrate how PSY will fall on the continuum. In the
first scenario, Dx is equal to 90% of natural discharge; this is described by Gleeson and Richter (2018) to
be a presumptive standard for ecological protection in the absence of a more detailed assessment. The
second scenario falls in the middle of the PSY range, where 50% of natural discharge is desired for Dx.
These two scenarios are equivalent to assuming pumping (P) represents 10% and 50% of simulated
recharge for the PSY class (Table 1).
3.3 Water Volume
Volume of water within the subsurface is the hydrogeological parameter used to quantify the PMY and
MMY classes. To be consistent with Klassen et al. (2018) and Klassen and Liggett (2019), the initial
volume of a water-saturated aquifer (V0) was considered to a depth of 150 m below ground surface (bgs).
Region-wide detailed analysis of permeable geobodies within formations that could be used as aquifers is
unavailable for this region, therefore, water volumes were determined on a formation-by-formation basis
using the GFA v3. In the future, volumetric assessment could be refined in areas where more detailed
aquifer mapping exists.
The GFA v3 is a province-wide multilayer model of the stratigraphy of Alberta and is divided into zones
representing geological members, formations, groups, or mixes of these entities depending on data
availability. The lower Athabasca region covers 25 individual model zones within 150 m of the surface,
with the youngest bedrock unit being the Wapiti Formation and the oldest bedrock unit being the
Precambrian basement. Generally, the bedrock units dip to the south-southwest, and the youngest units
subcrop in the southwest and the oldest units subcrop in the northeast below Neogene–Quaternary
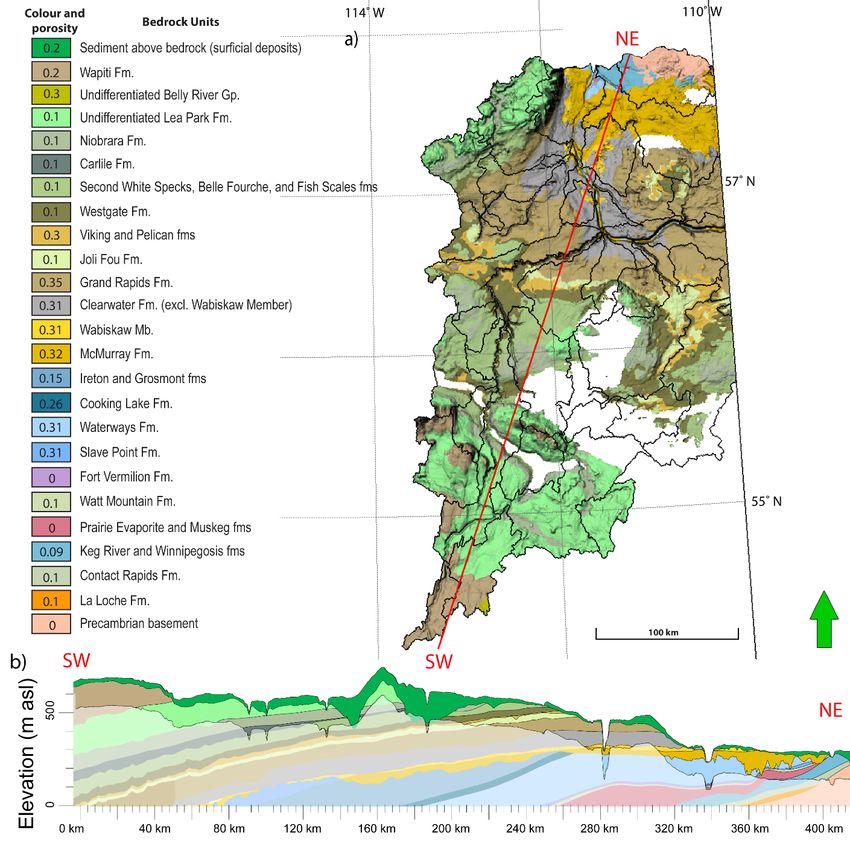
sediments. Figure 5 shows the bedrock geology of the study area, along with a cross-section.
AER/AGS Open File Report 2020-05 • 10Figure 5. a) Bedrock units in the study area (eastern Alberta; from version 3 of the Geological
Framework of Alberta, Alberta Geological Survey, in progress, 2021) to a depth of 150 m below
ground surface. The Hydrologic Unit Code Watersheds of Alberta level 8 (HUC8) watersheds
(black lines; Alberta Environment and Parks, 2017) are overlain. Bedrock units not shown
(transparent areas) are overlain by Neogene–Quaternary sediments exceeding 150 m in thickness.
b) Southwest (SW)-northeast (NE) cross-section identified by red line in a).
AER/AGS Open File Report 2020-05 • 11The volume for each geological zone within 150 m bgs was determined in Schlumberger’s Petrel 2015
software. Water volumes for each zone were determined by assuming effective porosity based on general
geological characteristics (consistent with previous reports) or from Bachu et al. (1993) where
hydrostratigraphic units had regional-scale porosity measurements obtained from core analyses
(Figure 5). For zones that did not have porosity based on core analyses, aquitards were assigned a
porosity of 0.1, aquifers assigned a porosity of 0.3, and formations that were a mixture of sandstone,
siltstone, mudstone, and shale were assigned a porosity of 0.2 (Figure 5). Overlying Neogene–Quaternary
sediments were assigned a porosity of 0.2.
4 Results and Discussion
4.1 Aquifer Yield Continuum
Recharge was determined for 30 HUC8 watersheds within the study area. Recharge results determined
from the SAOS and NAOS models range from 2 to 21 mm/yr with an average recharge of 7 mm/yr. For
comparison, recharge from the baseflow approach ranged from 0.3 to 71 mm/yr, with an average of
15 mm/yr. A comparison between the two methods is shown in Figure 6. The majority of recharge values
from the model approach is between 2 and 10 mm/yr whereas values from the baseflow approach are
typically between 1 and 30 mm/yr, with values in several watersheds up to 70 mm/yr.
Figure 6. Recharge estimates from the model approach and baseflow approach for Hydrologic
Unit Code Watersheds of Alberta level 8 (HUC8) watersheds (Alberta Environment and Parks,
2017) in lower Athabasca region, eastern Alberta.
AER/AGS Open File Report 2020-05 • 12There are limitations to the baseflow approach in this part of the province, which is why the model
approach was used to determine recharge. For example, the baseflow approach assumes all groundwater
discharge occurs to streams and rivers, where it is measured; however, there are many wetlands in this
area that may receive discharge that is unaccounted for by measuring the baseflow. Data collected from
the hydrometric gauging stations were quite variable; although data collected spanned from 1913 to 2018,
they were not consistently collected and some stations only collected data seasonally. There was not a
period of time when data were collected consistently, which could skew the results when flow at one
station is subtracted from the flow at another station to determine flow within a watershed. Because most
stations only collected data seasonally (not through the winter months), the data were skewed towards
wetter seasons, which could be the reason why the baseflow approach produced recharge results that are
quite higher than those from the model approach.
Figure 7a shows the recharge results from the model approach in mm/yr and Figure 7b shows the
recharge results in m3/yr, which is equivalent to the MSY class from the aquifer yield continuum. The
results for the remaining classes of the yield continuum can be found in Appendix 1.
Figure 7. a) Areal recharge and b) volumetric recharge for each Hydrologic Unit Code Watersheds
of Alberta level 8 (HUC8) watershed (Alberta Environment and Parks, 2017) in the lower Athabasca
region, eastern Alberta. Volumetric recharge is equivalent to the maximum sustained yield in this
study.
AER/AGS Open File Report 2020-05 • 134.2 Limitations
There are several limitations to the model approach for estimating recharge and to presenting groundwater
availability at a watershed scale. Limitations to this method include:
1) The recharge parameter from the SAOS and NAOS models is an input parameter and, therefore, was
assigned rather than being a model result. The recharge parameter from the models was used because
it was consistent with previous work in similar geographic areas and was optimized during
calibration. It did take into consideration precipitation within the area as well as the type of surficial
deposits (sand versus till) and topography (uplands versus lowlands). Unfortunately, because the area
is heavily forested, the one-dimensional (1D) soil moisture model used in Klassen et al. (2018) and
Klassen and Liggett (2019) is not applicable.
2) The results are limited to near-surface aquifers. The yield continuum, specifically for the mining
classes (MSY and MMY), assesses groundwater volume within 150 m bgs. In this region, industry
requires groundwater data for much deeper units that may not be recharged from surface but rather
recharged through cross-formational flows or regional-scale flow. Future work in this area could
include assessments of groundwater availability on a formation-by-formation basis.
3) Groundwater recharge results are at the HUC8 watershed level and do not provide site-specific
groundwater availability. These results would not be useful for site-specific groundwater allocation
but rather for providing estimates of how much groundwater is available per watershed.
4) The aquifer yield continuum assumes that the groundwater system reaches a new steady state and the
PMY and MMY classes represent the volume of water that can be extracted in either one year or over
20 years. It is important to consider that groundwater extraction rates change over the lifetime of
industry projects. The spatial distribution of groundwater extraction also changes over time as mines
develop or are affected by nearby operations.
5 Summary
The aquifer yield continuum is one approach for estimating groundwater yield throughout Alberta and is
easily modified by finding different methods to quantify the hydrogeological parameters (recharge,
discharge, water volume). For the lower Athabasca region, recharge was estimated from FEFLOW
groundwater models; regional-scale geology and geological zone volumes were determined using
version 3 of the Alberta Geological Survey’s Geological Framework of Alberta. Average recharge was
estimated to be 7 mm/yr and ranges from 2 to 21 mm/yr throughout the study area. Recharge was
multiplied by the area of the watersheds to determine groundwater yields on a watershed basis and the
maximum sustained yield varied from 1.5 x 10 6 to 65.7 x 10⁶ m3/yr. Results from this study can be used
as a screening or risk assessment tool to identify watersheds of interest, after which more local-scale
groundwater yield assessments could be conducted.
AER/AGS Open File Report 2020-05 • 146 References
Agriculture and Agri-Food Canada (2013): AAFC Watersheds Project – 2013; Agriculture and Agri-Food
Canada, watershed related datasets, URL [March 2020].
Alberta Environment and Parks (2011): AB LUF Regional Boundaries Shapefiles 2011-04; URL
[March 2020].
Alberta Environment and Parks (2017): Hydrologic Unit Code (HUC) Watersheds of Alberta;
Government of Alberta, URL [March 2020].
Alberta Environment and Sustainable Resource Development (2012): Lower Athabasca Region
groundwater management framework; Alberta Environment and Sustainable Resource Development,
52 p., URL [March 2020].
Alberta Environment and Sustainable Resource Development (2013a): Lower Athabasca Region
groundwater management framework, supporting documents for the North Athabasca Oil Sands
(NAOS) area; Alberta Environment and Sustainable Resource Development, 97 p., URL
[April 2020].
Alberta Environment and Sustainable Resource Development (2013b): Lower Athabasca Region
groundwater management framework, supporting documents for the South Athabasca Oil Sands
(SAOS) area; Alberta Environment and Sustainable Resource Development, 96 p., URL
[April 2020].
Alberta Geological Survey (2019): 3D Provincial Geological Framework Model of Alberta, version 2;
Alberta Energy Regulator / Alberta Geological Survey, AER/AGS Model 2018-02, URL
[January 2021].
Andriashek, L.D. (2003): Quaternary geological setting of the Athabasca Oil Sands (in situ) Area,
northeast Alberta; Alberta Energy and Utilities Board, EUB/AGS Earth Sciences Report 2002-03,
295 p., URL [March 2020].
Andriashek, L.D. and Atkinson, N. (2007): Buried channels and glacial-drift aquifers in the Fort
McMurray region, northeast Alberta; Alberta Energy and Utilities Board, EUB/AGS Earth Sciences
Report 2007-01, 170 p., URL [August 2020].
Andriashek, L.D. and Fenton, M.M. (1989): Quaternary stratigraphy and surficial geology of the Sand
River area, 73L; Alberta Research Council, Alberta Geological Survey, Bulletin 57, 165 p., URL
[March 2020].
Bachu, S., Underschultz, J.R., McPhee, D. and Cotterill, D.K. (1991): Regional geology and
hydrostratigraphy in northeast Alberta; Alberta Research Council, Alberta Geological Survey, Open
File Report 1996-16, 168 p., URL [March
2020].
Bachu, S., Underschultz, J.R. and Hitchon, B. (1992): Regional subsurface hydrogeology in northeast
Alberta; Alberta Research Council, Alberta Geological Survey, Open File Report 1996-14, 149 p.,
URL [March 2020].
Bachu, S., Underschultz, J.R., Hitchon, B. and Cotterill, D.K. (1993): Regional-scale subsurface
hydrogeology in northeast Alberta; Alberta Research Council, Alberta Geological Survey, Bulletin
61, 49 p., URL [March 2020].
Bostock, H.S. (1970): Physiographic regions of Canada; Geological Survey of Canada, Map 1254A, scale
1:5 000 000, doi:10.4095/108980
AER/AGS Open File Report 2020-05 • 15Bredehoeft, J.D. (2002): The water budget myth revisited: why hydrogeologists model; Groundwater,
v. 40, no. 4, p. 340–345, doi:10.1111/j.1745-6584.2002.tb02511.x
Devlin, J.F. and Sophocleous, M. (2005): The persistence of the water budget myth and its relationship to
sustainability; Hydrogeology Journal, v. 13, p. 549–554, doi:10.1007/s10040-004-0354-0
Environment and Climate Change Canada (2018): HYDAT database; Environment and Climate Change
Canada, URL [March 2020].
Fortin, G., van der Kamp, G. and Cherry, J.A. (1991): Hydrogeology and hydrochemistry of an aquifer-
aquitard system within glacial deposits, Saskatchewan, Canada; Journal of Hydrology, v. 126, no. 3–
4, p. 265–292, doi:10.1016/0022-1694(91)90260-J
Gleeson, T. and Richter, B. (2018): How much groundwater can we pump and protect environmental
flows through time? Presumptive standards for conjunctive management of aquifers and rivers; River
Research and Applications, v. 34, p. 83–92, doi:10.1002/rra.3185
Hackbarth, D.A. and Nastasa, N. (1979): The hydrogeology of the Athabasca Oil Sands Area, Alberta;
Alberta Research Council, Alberta Geological Survey, Bulletin 38, 64 p., URL
[March 2020].
Kalf, F.R.P. and Woolley, D.R. (2005): Applicability and methodology of determining sustainable yield
in groundwater systems; Hydrogeology Journal, v. 13, no. 1, p. 295–312, doi:10.1007/s10040-004-
0401-x
Klassen, J. and Liggett, J.E. (2019): First-order groundwater availability assessment for the upper Peace
region; Alberta Energy Regulator / Alberta Geological Survey, AER/AGS Open File Report 2019-
10, 28 p., URL [March 2020].
Klassen, J. and Smerdon, B.D. (2018): First-order groundwater availability assessment for central
Alberta; Alberta Energy Regulator, AER/AGS Open File Report 2017-07, 28 p., URL
[March 2020].
Klassen, J., Liggett, J.E., Pavlovskii, I. and Abdrakhimova, P. (2018): First-order groundwater availability
assessment for southern Alberta; Alberta Energy Regulator / Alberta Geological Survey, AER/AGS
Open File Report 2018-09, 37 p., URL [March
2020].
Lemay, T.G. and Guha, S. (2009): Compilation of Alberta groundwater information from existing maps
and data sources; Energy Resources Conservation Board, ERCB/AGS Open File Report 2009-02,
43 p., URL [March 2020].
Maathius, H. and van der Kamp, G. (2006): The Q20 concept: sustainable well yield and sustainable
aquifer yield; Saskatchewan Research Council, Publication No. 10417-4E06, 110 p., URL
[March 2020].
Meyboom, P. (1967): Estimates of groundwater recharge on the Canadian Prairies; Water Resources of
Canada, Royal Society of Canada Symposium, p. 129–153.
Natural Regions Committee (2006): Natural regions and subregions of Alberta; D.J. Downing and W.W.
Pettapiece (comp.), Government of Alberta, Publication No. T/852, 254 p., URL
[March 2020].
AER/AGS Open File Report 2020-05 • 16Pettapiece, W.W. (1986): Physiographic subdivisions of Alberta; Agriculture Canada, Research Branch,
Land Resource Research Centre, URL [August 2020].
Pierce, S.A., Sharp, J.M., Guillaume, J.H.A., Robert, E.M. and Eaton, D.J. (2013): Aquifer-yield
continuum as a guide and typology for science-based groundwater management; Hydrogeology
Journal, v. 21, no. 2, p. 331–340, doi:10.1007/s10040-012-0910-y
Rehm, B.W., Moran, S.R. and Groenewold, G.H. (1982): Natural groundwater recharge in an upland area
of central North Dakota, U.S.A.; Journal of Hydrology, v. 59, p. 293–314, doi:10.1016/0022-
1694(82)90093-2
Smerdon, B.D. (2007): The influence of climate on water cycling and lake-groundwater interaction in an
outwash landscape on the Boreal Plains of Canada; Ph.D. thesis, University of Alberta, 152 p.
Utting, D.J. and Andriashek, L.D. (2020): Revised bedrock topography and characterization of
Quaternary sediments in the Fort McMurray region, northeastern Alberta; Alberta Energy Regulator
/ Alberta Geological Survey, AER/AGS Report 101, 171 p.
WorleyParsons Canada (2010): Groundwater flow model for the Athabasca Oil Sands (in situ) area, south
of Fort McMurray, Phase 2; prepared for Alberta Environment.
WorleyParsons Canada (2012): Groundwater flow model for the Athabasca Oil Sands, north of Fort
McMurray, Phase 1 conceptual and numerical model development; prepared for Alberta
Environment.
Zhou, Y. (2009): A critical review of groundwater budget myth, safe yield and sustainability; Journal of
Hydrology, v. 370, no. 1–4, p. 207–213, doi:10.1016/j.hydrol.2009.03.009
AER/AGS Open File Report 2020-05 • 17Appendix 1 – Aquifer Yield Continuum Classes
Figure 8. Hydrologic Unit Code Watersheds of Alberta level 8 (HUC8) watersheds (Alberta
Environment and Parks, 2017), eastern Alberta, labelled with HUC8 ID used in Table 2.
AER/AGS Open File Report 2020-05 • 18Table 2. Aquifer yield continuum classes for the lower Athabasca region of eastern Alberta. The PPSY(10%) and PPSY(50%) use 10% and 50%
of natural discharge for pumping, respectively. The PPMY(1yr) and PMMY(1yr) and PPMY(20yr) and PMMY(20yr) assume water is removed from
storage over 1 and 20 years, respectively. Abbreviations: HUC8, Hydrologic Unit Code Watersheds of Alberta level 8 watershed (Alberta
Environment and Parks, 2017); MMY, maximum mining yield; MSY, maximum sustained yield; P, groundwater withdrawal (pumping);
PMY, permissive mining yield; PSY, permissive sustained yield.
HUC8 PPSY(10%) PPSY(50%) PMSY PPMY(1 yr) PMMY(1 yr) PPMY(20 yr) PMMY (20 yr)
ID 3
(m /yr)
3
(m /yr)
3
(m /yr)
3
(m /yr)
3
(m /yr)
3
(m /yr)
3
(m /yr)
15010101 2.19E+05 1.09E+06 2.19E+06 1.11E+08 1.09E+10 7.61E+06 5.45E+08
17050102 1.49E+05 7.46E+05 1.49E+06 2.11E+08 2.10E+10 1.20E+07 1.05E+09
17050201 8.68E+05 4.34E+06 8.68E+06 8.62E+08 8.53E+10 5.13E+07 4.27E+09
17050205 1.13E+06 5.67E+07 1.13E+07 7.72E+08 7.61E+10 4.94E+07 3.81E+09
17050301 1.50E+06 7.49E+06 1.50E+07 1.04E+09 1.02E+11 6.61E+07 5.13E+09
17050302 2.44E+05 1.22E+06 2.44E+06 2.40E+08 2.37E+10 1.43E+07 1.19E+09
17050303 3.76E+05 1.88E+06 3.76E+06 4.10E+08 4.06E+10 2.41E+07 2.03E+09
17050304 3.79E+05 1.90E+06 3.79E+06 3.63E+08 3.59E+10 2.18E+07 1.80E+09
17050401 1.34E+06 6.72E+06 1.34E+07 1.30E+09 1.28E+11 7.76E+07 6.43E+09
17050403 9.11E+05 4.55E+06 9.11E+06 8.35E+08 8.26E+10 5.04E+07 4.14E+09
17060101 3.73E+06 1.87E+07 3.73E+07 1.58E+09 1.54E+11 1.15E+08 7.76E+09
17060102 3.57E+05 1.78E+06 3.57E+06 2.00E+08 1.96E+10 1.34E+07 9.84E+08
17060103 5.13E+05 2.56E+06 5.13E+06 2.24E+08 2.19E+10 1.61E+07 1.10E+09
17060104 7.10E+05 3.55E+06 7.10E+06 4.27E+08 4.20E+10 2.81E+07 2.11E+09
17060105 2.37E+06 1.19E+07 2.37E+07 1.32E+09 1.29E+11 8.84E+07 6.49E+09
17060106 7.20E+05 3.60E+06 7.20E+06 3.73E+08 3.66E+10 2.55E+07 1.84E+09
17060107 1.36E+06 6.81E+06 1.36E+07 3.94E+08 3.81E+10 3.27E+07 1.92E+09
17060201 1.26E+06 6.32E+06 1.26E+07 7.17E+08 7.04E+10 4.78E+07 3.53E+09
17060202 1.15E+06 5.73E+06 1.15E+07 4.40E+08 4.28E+10 3.29E+07 2.15E+09
17060203 9.31E+05 4.66E+06 9.31E+06 4.25E+08 4.16E+10 3.01E+07 2.09E+09
17070101 3.14E+06 1.57E+07 3.14E+07 1.06E+09 1.03E+11 8.29E+07 5.19E+09
17070102 3.27E+05 1.64E+06 3.27E+06 2.38E+08 2.35E+10 1.50E+07 1.18E+09
17070103 4.60E+05 2.30E+06 4.60E+06 5.63E+08 5.59E+10 3.25E+07 2.80E+09
17070104 1.24E+06 6.18E+06 1.24E+07 6.01E+08 5.89E+10 4.18E+07 2.96E+09
17070105 1.89E+06 9.44E+06 1.89E+07 8.12E+08 7.93E+10 5.85E+07 3.98E+09
17070201 1.30E+06 6.51E+06 1.30E+07 5.04E+08 4.91E+10 3.76E+07 2.47E+09
17070202 2.04E+06 1.02E+07 2.04E+07 1.33E+09 1.31E+11 8.61E+07 6.59E+09
17070203 6.47E+05 3.24E+06 6.47E+06 4.49E+08 4.42E+10 2.86E+07 2.22E+09
17070301 6.57E+06 3.28E+07 6.57E+07 1.20E+09 1.13E+11 1.22E+08 5.73E+09
17070302 4.74E+06 2.37E+07 4.74E+07 3.11E+08 2.64E+10 6.06E+07 1.36E+09
AER/AGS Open File Report 2020-05 • 19You can also read