Daytime E-Region Irregularities During the 22 July 2009 Solar Eclipse over Chung-Li (24.9 N, 121.2 E), a Moderate Mid-Latitude Station
←
→
Page content transcription
If your browser does not render page correctly, please read the page content below
Terr. Atmos. Ocean. Sci., Vol. 24, No. 6, 1021-1032, December 2013                                              doi: 10.3319/TAO.2013.07.08.01(AA)

       Daytime E-Region Irregularities During the 22 July 2009 Solar Eclipse over
             Chung-Li (24.9°N, 121.2°E), a Moderate Mid-Latitude Station
                     Potula Sree Brahmanandam *, Yen Hsyang Chu, Ching-Lun Su, and Ting-Han Lin

                                   Institute of Space Science, National Central University, Chung-Li, Taiwan

                                                    Received 9 May 2013, accepted 8 July 2013

ABSTRACT

      The 22 July 2009 solar eclipse with an obscuration of > 83% at Chung-Li (24.9°N, 121.2°E, Dip 35°N) in Taiwan during
noon hours has provided a unique opportunity for us to examine its impact on E-region irregularities which were observed
simultaneously by the 52 MHz coherent radar and a co-located ionosonde. Significant observations revealed that the daytime
E-region strong backscatter echoes at multiple heights and a sudden intensification of the weak sporadic E-layer during the 22
July 2009 solar eclipse. These results follow the research findings of Patra et al. (2009). As the incident solar radiation sud-
denly blocked by intruding Moon during solar eclipse events that would generally create night-like ionospheric conditions, it
is surmised that the E-region irregularities were indeed induced by the eclipse associated effects. The induced effects resulted
in faster recombination of molecular ions, generation of gravity waves and electric fields that could have created a conducive
environment to excite plasma irregularities through a gradient-drift instability mechanism. The vertical shears of radar Dop-
pler velocity and the peak radar backscatter at the node of Doppler velocity shear, as resolved by the coherent scatter radar
with interferometer technique, were possibly due to the upward propagating gravity waves and wave-induced polarization
electric fields. The present observational results should not only be highly useful to ascertain plausible mechanisms respon-
sible for nighttime E-region irregularities, but also provided evidence that a solar eclipse could generate E-region plasma
irregularities over temperate mid-latitudes for the first time.

Key words: Solar eclipse, Ionospheric irregularities, Mid-latitude ionosphere, Wave propagation
Citation: Brahmanandam, P. S., Y. H. Chu, C. L. Su, and T. H. Lin, 2013: Daytime E-region irregularities during the 22 July 2009 solar eclipse over Chung-
Li (24.9oN, 121.2oE), a moderate mid-latitude station. Terr. Atmos. Ocean. Sci., 24, 1021-1032, doi: 10.3319/TAO.2013.07.08.01(AA)

1. INTRODUCTION
      Observing a solar eclipse provides a unique opportu-                      dence that a solar eclipse can induce/enhance plasma ir-
nity to study various atmospheric processes as it temporarily                   regularities in the E-region (Sridharan et al. 2002; Patra et
cuts off solar radiation which is responsible for almost all                    al. 2009; Thampi et al. 2010). For example, Sridharan et
the physical mechanisms occurring within the Earth’s atmo-                      al. (2002) used both HF and VHF radar observations from
sphere. During an eclipse epoch, usual processes of produc-                     Trivandrum (8.5°N, 77°E, Dip 0.5°N ), a typical equatorial
tion and ionospheric loss are disturbed locally for a brief pe-                 station in India, to investigate the exact effects of electro-
riod (for example, Van Zandt et al. 1960; West et al. 2008).                    dynamics on the equatorial E and F-regions during a partial
Because the formation mechanisms of lower ionospheric                           solar eclipse that passed over Trivandrum during pre-sunset
layers (E and F1) are dictated predominantly by the amount                      hours on 11 August 1999; a few unique features were ob-
of solar radiation, which is otherwise absent during solar                      served including the sudden intensification of a weak blan-
eclipses, a substantial decay in the plasma densities of E and                  keting sporadic E-layer (Es layer) and the associated large
F1 layers is inevitable (for example, Van Zandt et al. 1960;                    enhancement of the VHF backscattered returns, significant
Davies et al. 1964; Tsai and Liu 1997; Le et al. 2008).                         increase in h’F (base height of F layer) and distinctly dif-
      In addition, a few recent studies have provided evi-                      ferent spatial and temporal structures in spread-F irregular-
                                                                                ity drift velocities. Though Sridharan et al. (2002) merely
                                                                                linked the phenomenon of sudden intensification of a weak
* Corresponding author                                                          blanketing Es layer to the solar eclipse induced effects, they
  E-mail: anandp@jupiter.ss.ncu.edu.tw
1022 Brahmanandam et al.
interpreted the significant height rise in h’F in terms of a lo- acoustic gravity waves, in total electron content (TEC) mea-
cal enhancement in the F-region electric field resulting from sured using a dense ground-based GPS receiver network
a plasma density reduction in the low latitude E-region that over Taiwan during the passage of Moon’s shadow boat
is electrodynamically connected to the equatorial F-region (the cooling region). Liu et al. (2011) research has provided
through geomagnetic field lines. evidence on the presence of gravity waves during the pres-
Away from equatorial regions, Patra et al. (2009) and ent solar eclipse epoch over Taiwan and that a gravity wave
Thampi et al. (2010) used VHF radars located at Gadanki could have helped in the formation of a Es layer (Hines
(13.5°N, 79.2°E, Dip 12.5°N), a low-latitude station in India, 1960; Datta 1972).
and at Shigaraki (35.85°N, 136.1°E, Dip 48°N), a mid-lati- We operated the 52 MHz Chung-Li VHF radar along
tude station in Japan, to investigate local E-region responses with a co-located ionosonde radar to study the E-region ir-
to solar eclipses; both stations have observed E-region plas- regularities during the partial solar eclipse which occurred
ma density irregularities during partial solar eclipses which on 22 July 2009. Most importantly, for the first time the mea-
occurred on 11 August 1999 and 22 July 2009, respectively. surements of vertical shear of 3-m FAI Doppler velocity in
Both Patra et al. (2009) and Thampi et al. (2010) hypoth- moderate middle latitude Es regions have been made by co-
esized that a solar eclipse could provide ‘night-like’ condi- herent radar with the interferometer technique during a solar
tions which allow the excitation of plasma instability and eclipse. Several important features were observed includ-
the generation of plasma irregularities. Further, they conjec- ing quasi-periodic (QP) type echoes for about 45 minutes
tured that the irregularities could grow on density gradients from 0935 to 1020 LT (LT = UT + 0800 hours) and for
formed by the metallic ion layers when molecular ions were about 55 minutes from 1040 to 1135 LT when a sudden and
recombined during solar eclipse events, although they did intensified Es layer appeared during above periods. In addi-
not mention the causative mechanism responsible for the tion, multiple layers were observed, albeit for a short time,
formation of metallic ion layers. Also, recently Patra et al. by both VHF and ionosonde radars during the peak time of
(2011) found 150 km daytime irregularities, so-called valley solar eclipse. Daytime QP echoes were observed over this
region irregularities using the Gadanki VHF radar during location for the first time during a solar eclipse event. With
15 January 2010 solar eclipse. In this context, to ascertain this concrete observational evidence, it may be reasonable
that the E-region irregularities were indeed induced by a to conclude that the solar eclipses are able to induce plasma
solar eclipse and not a chance occurrence or had occurred irregularities in the E-region over low and mid-latitudes
due to the availability of other free energy sources respon- during daytime hours.
sible for daytime irregularities as reported by Patra et al. This article is organized as follows: section 2 contains
(2009), observational studies on these rare and unique natu- typical observational results. Discussion on the possible
ral events along the path of eclipse are very much needed, generation mechanism of E-region irregularities during day-
and these aspects ignite us to carry-out the present research. time when the longest solar eclipse passing with supersonic
Further, it would be most interesting to investigate whether speeds over the Taiwan region is given in section 3 and fi-
daytime E-region irregularities are observed (or not) during nally, a summary and conclusion are provided in section 4.
the longest solar eclipse which occurred on 22 July 2009
over a typical equatorial ionization anomaly crest zone sta-
2. OBSERVATIONS
tion such as Chung-Li (Geographic Lat. 24.9°N, Geograph-
ic Long. 121.2°E, Dip 35°N) which is located at temperate The longest total solar eclipse over the next hundred
mid-latitudes exactly in between the Gadanki and Shigaraki years occurred on 22 July 2009 and swept over the East
latitudes and where the nighttime backscatter echoes using Asian region during a noontime period. Figure 1 depicts the
the 52 MHz radar have been long reported (Chu et al. 1996; path of the eclipse, which is provided courtesy of F. Espenak
Chu and Wang 1997). By doing so, it may be possible to of NASA (http://eclipse.gsfc.nasa.gov/SEplot/SEplot2001/
certify whether a solar eclipse could really induce plasma SE2009Jul22T.GIF). This is the standard format for eclipse
irregularities in the E-region over low and mid-latitudes or plots on the NASA site and contains ephemeris and geocentric
such irregularities belong to the category of mere daytime libration (West et al. 2008). As it is evident from Fig. 1, the
E-region irregularities observed over Gadanki (Patra et al. path of the lunar umbra shadow commenced initially in India
2004, 2006). In addition, the present observations should be and crossed over Nepal, Bangladesh, Bhutan, Myanmar, and
useful to know the exact mechanisms responsible for night- China. The point of greatest eclipse occurred over the west-
time E-region irregularities over moderate mid latitudes. ern Pacific Ocean region, which is about 100 km south of the
Further, the recent studies associated with the 22 July Bonin Islands located near the south east of Japan.
2009 solar eclipse have reported clear evidence on eclipse The 22 July 2009 solar eclipse was a partial solar eclipse
induced effects on both the lower (Chen et al. 2010) and over the Taiwan region and over the present radar beam loca-
upper ionosphere (Liu et al. 2011). Importantly, Liu et al. tion an 83% obscuration occurred. The event occurred within
(2011) found bow and stern waves, which are formed by the interval of 0823 - 1105 LT (LT = UT + 0800 hours) withSolar Eclipse Induced Day-Time E-Region Irregularities 1023 Fig. 1. Extent of the total solar eclipse of 22 July 2009, showing the complete path as well as lines of percentage occultation of the solar disk and declination of the leading edge of the eclipse (Courtesy of F. Espenak of NASA, 2004).
1024                                                        Brahmanandam et al.

maximum obscuration at 0940 LT. The pertinent times of                     the radar. Figure 3 shows the RTI map, Doppler velocities
initial, maximum, and ending phases of this solar eclipse are              and spectral widths of backscatter echoes observed on 22
indicated by vertical lines in green in Figs. 2, 3 and 4. Both             July 2009. The RTI plots display echoes from the E-region
VHF radar and ionosonde were operated one week before                      field-aligned irregularities (FAIs), with the presence of typi-
and after the eclipse event day to study the effect of solar               cal morning time “continuous echoes” up to ~0835 LT. These
eclipse on E-region plasma processes. Nevertheless, we show                continuous echoes occur not only during whole night and also
here only the observations results during 21 (pre-eclipse day)             during post-sunrise periods (Choudhary and Mahajan 1999;
and 22 July 2009 (during eclipse day). The 52 MHz radar ob-                Ogawa et al. 2002). The echoes re-appeared around 0935 LT,
servations were performed in interferometry mode (Chu and                  around 60 minutes after the commencement of the eclipse.
Wang 1997) and the true heights of backscatter echoes in this              These echoes displayed discrete and nearly coherent patterns
present study were determined with interferometry analysis,                in RTI maps, which are similar to the “QP type” observed
not with the conventional method (i.e., h = r × sin(θ), where              usually during the post-sunset period over low and mid lati-
‘r’ is the range and θ is the direction of perpendicularity to             tudes. These QP type echoes lasted for around 45 minutes at
the magnetic field lines) with which only apparent or ap-                  around the 126 km range, with ~7 - 9 minute and ~3 - 5 minute
proximate height can be determined (Wang and Chu 2001).                    periodicities. In addition, one additional region of echoes was
On the other hand, the ionosonde was used cyclically at                    also observed at higher altitude at around the 133 km range at
5 minute intervals to provide ionograms. The configuration                 0938 LT, however only for a short while, and that was trig-
of radar experiment along with important parameters used for               gered in close coincidence with the peak time of the eclipse.
the present study is given in Table 1.                                     Further, after a short gap (for about 20 minutes), a strong echo
      The top, middle and lower panels in Fig. 2 show the                  pattern was observed between 1040 and 1135 LT at around
Range-Time-Intensity (RTI) map along with Doppler veloci-                  130 km range and these echoes also showed QP type features.
ties and spectral widths of the echoes observed on 21 July                 It should be noted that the large vertical extensions of these
2009. As is shown, no predominant backscatter echoes were                  echoes were caused by range sidelobe which occurred primar-
present, although strong backscatter echoes were present dur-              ily due to the fact that the Barker codes were employed to the
ing post-sunset hours (not shown). The middle panel in Fig. 2              transmitted pulses. It is worth mentioning here that the prin-
shows the Doppler velocities for the radar data taken in the               ciple disadvantage of Barker codes is larger sidelobe response
above period, in which the positive (negative) Doppler veloc-              (Farley 1983). Interestingly, the Doppler velocities (middle
ity represents the target moving away (approaching toward)                 panel in Fig. 3) of QP type echoes observed in both time

                                                                                                                           SNR(dB)
                                       186
                                                                                                                                 40
                                       162
            Range(km)

                                                                                                                                 30
                                       138
                                                                                                                                 20

                                       114                                                                                       10

                                       90                                                                                        0
                                       150
            Doppler velocity(m s-1)

                                       100
                                        50
                                         0
                                      −50
                                      −100
                                      −150
                                      100
            Spectral width(m s-1)

                                       80

                                       60

                                       40

                                       20

                                        0
                                        07:30   08:30      09:30               10:30               11:30               12:30
                                                               Local Time, Hrs
Fig. 2. Range-Time-Intensity map (top panel), Doppler Velocity (middle Panel), and spectral width plots (lower panel) obtained from the Chung-Li
52 MHz radar observations on 21 July 2009.
Solar Eclipse Induced Day-Time E-Region Irregularities 1025
162 SNR(dB)
40
138
Range(km)
30
20
114
10
90
150
Doppler velocity(m s-1)
100
50
0
−5 0
−100
−150
100
Spectral width(m s-1)
80
60
40
20
0
07:30 08:30 09:30 10:30 11:30 12:30
Local Time, Hrs
Fig. 3. Range-Time-Intensity map (top panel), Doppler Velocity (middle panel), and spectral width plots (lower panel) obtained from the Chung-Li
52 MHz radar observations on 22 July 2009.
130
120
Height(km)
110
100
90
80
20
W−E(km)
0
−20
−40
120
N−S(km)
100
80
60
07:30 08:30 09:30 10:30 11:30 12:30
Local Time, Hrs
Fig. 4. Time sequences of the interferometer-resolved spatial distributions of Es echoes projected on the vertical (top panel) and horizontal (mid and
bottom panels) planes. Note that the presence of short-lived additional layer is shown with red color lines.1026 Brahmanandam et al.
Table 1. Radar specifications along with important parameters used for the experiment.
S. No. Parameter Values
1. Location Chung-Li (24.9°N, 121.2°E, Dip 35°N)
2. Center frequency 52 MHz
3. Peak transmitter power 120 kW
4. Beam direction 17° West of geographic North
5. Zenith angle 41°
6. Receiving Channels 3
7. Interpulse period 2.0 ms
8. Pulse width 28 ms with 7 bits Barker code
9. Coherent integration time 0.4 ms
10. Range bins 60
slots showed a upward/northward direction with magnitudes tional layer is shown with red colored lines. It is important
around 45 - 50 m s-1 and often have reached to greater than to mention here that the presence of a short-lived additional
55 m s-1 when strong backscatter echoes were observed. Al- layer was also noticed during the peak time of eclipse in the
though echoes observed during pre-eclipse day are showing ionogram and those observational results will be presented
a upward/northward direction, only for less than 30 minutes, in later sections. The spatial distribution of echoes projected
the Doppler velocities associated with these echoes have on a zonal plane, which was shown in the middle panel of
magnitudes of around 40 - 50 m s-1. The upward/northward Fig. 4, indicates clearly that the QP echoes were moving
velocities during pre-eclipse, eclipse and post-eclipse on 22 toward westerly direction with the progression of time. It is
July are consistent with what is normally expected from the clear from these figures that both continuous and QP echoes
daytime eastward electric field. The bottom panel in Fig. 3 de- were associated with different morphological features.
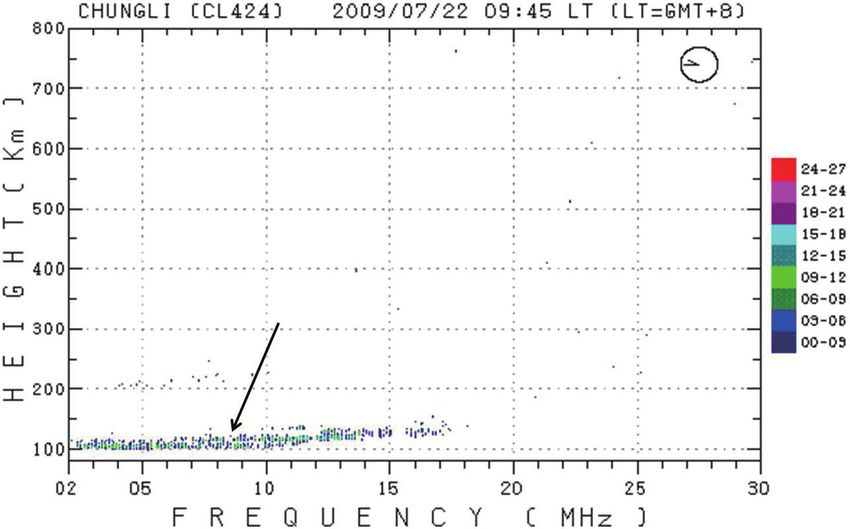
picts the corresponding spectral widths of continuous echoes Figure 5 shows a typical ionogram recorded at 0945 LT
which show relatively narrow widths (around 45 - 50 m s-1), on 22 July 2009. It is clear that an intensified range spread
while the QP echoes which show between 60 and 80 m s-1 and Es trace was present and the range spread Es trace is charac-
often reaching to magnitudes of 90 m s-1 particularly during terized by a relatively flat and sharp bottom edge and irregu-
the incidents of strong backscatter echoes. lar top edges. Note that an intensified range spread Es trace
With interferometry measurements, three-dimensional witnessed between 0930 and 1025 LT and between 1040
spatial structures of the 3-meter FAIs in the echo region can and 1130 LT and the results are presented in the following
be reconstructed (Chu and Wang 1997; Chu et al. 2011). section. Further, a clear look at the ionogram depicts an ad-
Figure 4 shows the time sequence of echo patterns on 22 ditional layer (shown with a black colored arrow symbol) is
July 2009 projected on the vertical (top panel) and horizontal located at around the 123 - 124 km range. The multiple Es
planes (middle and lower panels). Note that here we did not layers observed in the ionogram, therefore, bears a close re-
present the spatial components of echoes on 21 July 2009 as semblance with additional backscatter echoes observed us-
there were no significant echoes observed during that day. ing VHF radar at the peak time of the eclipse. In addition, the
The spatial components on 22 July were obtained by operat- concurrent measurements of the 52 MHz radar backscatter
ing the 52 MHz radar in interferometry mode by which the and ionosonde range spread Es echoes strongly indicate that
angular position and true height of the radar returns from the electron density irregularities at various scale sizes from
Es irregularities in the echoing region could be determined a meter to kilo-meter scale existed simultaneously in the Es
unambiguously (Chu and Wang 1997). As can be seen from layer in the same lines with the Chu et al. (2011) study.
the Fig. 4, both continuous and QP echoes observed on 22 Figure 6 shows the temporal variation of the top fre-
July 2009 were found to be located below 100 km, while QP quency of the reflecting/scattering of Es layer (ftEs) during
echoes appeared between 1040 and 1135 LT were located 21 (red line), 22 (blue line), and 23 (black line) July 2009,
above 100 km. Another important observation is that the in which initial, peak and final phases of the eclipse over
significant appearance of an additional layer at around 107 Chung-Li radar location is shown with vertical arrow lines.
- 108 km when maximum obscuration of the sun took place It is very clear from this figure that a considerable increase
over the radar beam location and the presence of an addi- in ftEs is evident on 22 July 2009 compared to other daysSolar Eclipse Induced Day-Time E-Region Irregularities 1027
and that a considerable increase was found to be highest drift (middle panel in Fig. 4) and, it is therefore reasonable
during peak time (around 21.9 MHz) followed by during the to conclude that the gradient-drift instability mechanism has
final phase (21.4 MHz) of solar eclipse. Further, a thorough been excited initially and then the meter-scale irregularities
examination of temporal variations of ftEs during July 2009 would have been generated from them through a non-linear
has revealed that the top frequency of Es often varies be- turbulence cascade process (Farley 1985) so as to produce
tween 9 - 12 MHz at around 0800 - 0900 LT, which clearly the backscatter echoes at 3-meter scale.
indicating the relatively strong Es activity (12.9 MHz) at Having accounted for the observational evidence on
around 0825 LT on 22 July 2009 belongs to mere day-to-day upward/northward pointed electric fields, a natural ques-
variability only. In addition, it can also be understood that tion immediately arises that what are the plausible physi-
the solar eclipse induced effects might not have worked by cal mechanisms responsible for the generation of these
that too early time (~0820 - 0825 LT and ~0830 - 0845 LT electric fields? It is generally thought that the neutral wind
on 22 July 2009) as the Chung-Li radar also did not record shear plays an essential role in the formation of the mid-
any strong back scatter echoes by that time. On the other latitude Es layer (Whitehead 1989). One of the most com-
hand, Fig. 7 depicts the temporal variation of the blanketing mon and efficient ways to produce neutral wind shear in
frequency of Es (fbEs) during 21, 22, and 23 July 2009. It is the Mesosphere and Lower Thermosphere (MLT) regions
clear from this figure that fbEs was found to be present from is the upward propagating tidal and gravity waves (Chu et
1130 LT onwards on 22 July 2009 with maximum values al. 2011). According to Chimonas and Hines (1970) and Liu
(6.6 MHz) between 1145 and 1155 LT, while fbEs on 23 et al. (2011) as the lunar shadow boat sweeps at supersonic
July 2009 found to appear as patchy in character and it was speed across the Earth, the cooling spot acts as a continuous
completely absent on 21 July 2009. source of gravity waves that build up into a bow wave. In
this context, it turns out that there is sufficient observational
evidence that points to the generation of gravity waves in
3. DISCUSSION
the low latitude ionosphere during the 22 July 2009 solar
At the outset, from relatively smaller Doppler veloci- eclipse (Chen et al. 2010; Liu et al. 2011). The presence
ties and broad spectral widths (middle and lower panels of gravity waves is, therefore, pretty sure during this solar
of Fig. 3), it can be concluded that the targets responsible eclipse. Such wave activities would have been responsible
for the Doppler spectra were type-2 plasma irregularities. for the sudden enhancement in Es activity (through wind
It is generally believed that the mechanism involved in the shear mechanism) and the polarization electric fields in
generation of type-2 meter scale plasma irregularities in the plasma structures of Es layer. It has been shown theoretical-
Es layer is gradient drift instability through the non-linear ly and experimentally that gravity wave-associated neutral
cascade process (Fejer et al. 1984). According to the linear wind may generate polarization electric field inside Es layer
growth rate, Y , of gradient drift instability, which has the owing to differential collisions between neutral-ion and
following vector form (Woodman et al. 1991) neutral-electron pairs (Gelinas et al. 2002; Chu et al. 2011).
Chu et al. (2011) have shown schematically how polariza-
1 k $ V ( k $ DNxB ) tion electric field could generate in an Es plasma structure by
Y a
1+ } D
a gravity-wave induced neutral wind (Fig. 11 in their paper).
(1)
oo X2
where } = e i (1 + e2 sin 2 z) According to Chu et al. (2011) a wave-induced polarization
X e Xi oe electric field will give rise to the drift of ions and electrons
in the Es layer through the E × B effect. In order to fulfill the
where k is the wavenumber of the plasma waves (or irregu- convergence requirement of the plasma for the Es layer for-
larities), ∆N is the vertical gradient of electron density, B is mation in northern hemisphere, the wave-associated zonal
the magnetic field, and oi and oe are, respectively, the ion- neutral wind in the upper (lower) portion of the Es layer
neutral and electron-neutral collision frequencies, Xi and should be in the west (east) direction (Whitehead 1970). In
Xe are, respectively, the ion and electron gyro-frequencies, the lower E-region below about 130 km, Hall conductivity
VD is the relative electron-ion drift velocity that is driven by is appreciably larger than Pedersen conductivity (Rishbeth
E × B drift effect, z is magnetic aspect angle with respect and Garriott 1969). In that environment, because ion-neutral
to perpendicularity to the magnetic field line. Therefore, for collision frequency is comparable to ion-gyrofrequency and
the plasma irregularities of the Es layer, the excitation of electron-neutral collision frequency is much smaller than
the gradient drift instability requires a upward/northward electron-gyrofrequency (Kelley 1989), one might expect
pointed electric field and westward drift of the irregularities that the westward (eastward) neutral wind will be respon-
along with vertical plasma density gradients. The present sible for eastward (westward) polarization electric field. In
observational results made with the 52 MHz radar have pro- the presence of meter-scale FAIs, VHF coherent scatter ra-
vided clear evidence of the presence of upward/northward dar will detect echoes from the upper (lower) Es layer which
pointed electric field (middle panel in Fig. 3) and westward will have mean Doppler velocity away (toward) from the1028 Brahmanandam et al.
Fig. 5. Typical example of digital ionogram recorded at Chung-Li at 0945 LT on 22 July 2009. Note that the color code represents echo strength in
unit dB.
24
21 July
22 July
23 July
20
16
ftEs (MHz)
12
8
4
08:00 08:30 09:00 09:30 10:00 10:30 11:00 11:30 12:00 12:30 13:00
Local Time
Fig. 6. Ionosonde observations of ftEs from Chung-Li during 21, 22 and 23 July 2009. Note that the initial, peak and final phases of solar eclipse
over the Chung-Li radar location are shown with vertical arrow lines.Solar Eclipse Induced Day-Time E-Region Irregularities 1029
8
21 July
22 July
23 July
7
fbEs
6
5
4
08:00 08:30 09:00 09:30 10:00 10:30 11:00 11:30 12:00 12:30 13:00
Local Time
Fig. 7. Ionosonde observations of fbEs from Chung-Li on 21, 22 and 23 July 2009. Note that the initial, peak and final phases of solar eclipse over
the Chung-Li radar location are shown with vertical arrow lines.
radar. Coincidently, the observational results of the present riving Eq. (3), which is generally valid in Es region (Kelley
study corroborate the notion proposed by Chu et al. (2011) 1989). According to Eq. (3) wherein the Doppler velocity
(see the middle panel of Fig. 3). The induced polarization shear (2W 2z) of FAIs is proportional to the neutral wind
electric field by the neutral wind of the gravity wave with shear (2U 2z) that determines the plasma density in the Es
a short period Es layer has been studied by Gelinas et al. layer formed through (wind) convergence process.
(2002) and according to Gelinas et al. (2002). In order to verify the exact relation between the Dop-
pler velocity shear and plasma densities, we present in Fig. 8
m& vH BDU the spatial distributions of back scatter echoes (first panels),
DEP = (2) echo power (middle panels), and Doppler velocities (last
m= vO vP - m& vP
panels) during the peak of this solar eclipse i.e., at 0935 LT
(in Fig. 8a) and 0940 LT (in Fig. 8b) on 22 July 2009. As
where ∆U and ∆EP are, respectively, amplitudes of zonal
shown, a one-to-one correspondence between the peaks in
wind velocity of the gravity wave and wave-induced po-
Doppler velocity shear and the radar backscatter is found to
larization electric field, m& and m= are, respectively, verti-
be prevalent. In order to verify whether such correspondence
cal and horizontal wavelength of the gravity wave, B is the
is prevalent or not during other times, particularly between
magnetic field flux, vO , vP and vH are, respectively, par-
1050 and 1130 LT, we have made a direct comparison be-
allel, Pedersen, and Hall conductivities. From Eq. (2), the
tween the Doppler velocity shear (2W 2z) and radar peak
relation between E × B drift velocity shear and the gravity
echo power. Figure 9 shows the direct comparison between
wave-induced neutral wind shear can be written as follows:
Doppler velocity shear (red color solid line) and radar peak
echo power (blue color solid line) between 0825 and 1150
2W = m& vH 2U (3)
LT on 22 July 2009. It is interesting to note that there is a
2z L & vP 2z great coherency between those two parameters during ini-
tial, peak and concluding phases of the solar eclipse which
where W (= ∆EP / B) is E × B drift velocity, L & [= mT (vO vP) 2 ] occurred on 22 July 2009 clearly indicating that the peak
1
is the mapping distance of the electric field with zonal di- radar backscatter from the field-aligned irregularities of Es
mension mT along magnetic field line (Farley 1959). Note layer occurred at the node of the Doppler velocity shear.
that the assumption of (vO vP) 2 >> 1 has been made in de- It is also evident from Eq. (3) that the Doppler velocity
11030 Brahmanandam et al.
(a) 09:35 LT July 22, 2009
140
True height(km)
110
120
100
80 105
60 80 100 120
S−N distance(km)
True height(km)
140
True height(km)
100
120
100
80
−20 0 20 95
120
S−N distance(km)
100
90
80
60
−20 0 20 0 20 40 0 10 20 30 40 50 60
W−E distance(km) Echo Power SNR(dB) Doppler Velocity (m s-1)
(b) 09:40 LT July 22, 2009
140
True height(km)
120
110
100
80
60 80 100 120 105
S−N distance(km)
True height(km)
140
True height(km)
100
120
100
80 95
−20 0 20
120
S−N distance(km)
100 90
80
60
−20 0 20 0 20 40 0 10 20 30 40 50 60
W−E distance(km) Echo Power SNR(dB) Doppler Velocity (m s-1)
Fig. 8. Interferometer-resolved spatial distributions of Es echoes projected on different planes (both vertical and horizontal), echo power, and Doppler
velocities measured using the Chung-Li radar during 0935 LT (a) and 0940 LT (b) on 22 July 2009.Solar Eclipse Induced Day-Time E-Region Irregularities 1031
22 July 2009
50
45
40
Doppler Velocity Shear (m s-1 km-1)
35
Radarpeakecho Power (dB)
30
25
20
15
10
5
0
08:25 08:55 09:25 09:55 10:25 10:55 11:25 11:50
Local Time
Fig. 9. Comparison between Doppler velocity shear (m s-1 km-1) and radar peak echo power (dB) on 22 July 2009, wherein a one-to-one correspondence
between them is clear.
shear is proportional to the vertical wavelength mT of the National Central University is supported by the National
gravity wave. It follows from our observations that the grav- Science Council (NSC) of the Republic of China under the
ity wave with vertical wavelengths of around 6 - 8 km could grants NSC-101-2811-M-008-012.
have existed during the peak time of this solar eclipse and
that it could have helped in the formation of another layer
at an altitude of ~107 km (see Figs. 3, 4 and 5 for about 6 REFERENCES
- 8 km separation between the lower and upper Es layers).
Chen, G., Z. Zhao, G. Yang, C. Zhou, M. Yao, T. Li, S.
However, it is not possible to ascertain directly from this
Huang, and N. Li, 2010: Enhancement and HF Dop-
study at this time whether or not the solar eclipse could gen-
pler observations of sporadic-E during the solar eclipse
erate gravity waves with 6 - 8 km vertical wavelength.
of 22 July 2009. J. Geophys. Res., 115, A09325, doi:
10.1029/2010JA015530. [Link]
4. SUMMARY AND CONCLUSION Chimonas, G. and C. O. Hines, 1970: Atmospheric gravity
waves induced by a solar eclipse. J. Geophys. Res., 75,
The occurrence of a solar eclipse on 22 July 2009 en-
875, doi: 10.1029/JA075i004p00875. [Link]
abled us to observe the ionospheric E-region irregularities
Choudhary, R. K. and K. K. Mahajan, 1999: Tropical E region
over Chung-Li using the 52 MHz radar, for the first time
field aligned irregularities: Simultaneous observations
during daytime. It is believed that these E-region irregulari-
of continuous and quasiperiodic echoes. J. Geophys.
ties were indeed induced by the eclipse effects. The signifi-
Res., 104, 2613-2619, doi: 10.1029/1998JA900012.
cant observations during this rare natural event are: (1) ap-
[Link]
pearance of QP type echoes along with an additional echo at
Chu, Y. H. and C. Y. Wang, 1997: Interferometry observa-
higher altitudes with a short duration of time; (2) an abrupt
tions of three-dimensional spatial structures of sporadic
intensification in the weak Es layer with an additional layer
E irregularities using the Chung-Li VHF radar. Radio
at higher range, and (3) the presence of vertical shears of
Sci., 32, 817- 832, doi: 10.1029/96RS03578. [Link]
the radar Doppler velocity in the Es layer that is believed
Chu, Y. H., S. R. Kuo, C. Y. Wang,and H. C. Huang, 1996:
to be caused by the upward propagating gravity waves and
Spectral behavior of VHF backscatter from ionospheric
the peak radar backscatter echo at the node of the Doppler
sporadic E irregularities in the equatorial anomaly crest
velocity shear.
zone. Terr. Atmos. Ocean. Sci., 7, 361-373.
Acknowledgements Dr. P. S. Brahmanandam (Anand), Chu, Y. H., P. S. Brahmanandam, C. Y. Wang, C. L. Su,
Postdoctoral Research Fellow, Institute of Space Science, and R. M. Kuong, 2011: Coordinated sporadic E layer1032 Brahmanandam et al.
observations made with Chung-Li 30 MHz radar, doi: 10.1016/j.jastp.2004.07.032. [Link]
ionosonde and FORMOSAT-3/COSMIC satellites. J. Patra, A. K., S. Sripathi, P. B. Rao, and R. K. Choud-
Atmos. Sol.-Terr. Phys., 73, 883-894, doi: 10.1016/j. hary, 2006: Gadanki radar observations of daytime
jastp.2010.10.004. [Link] E region echoes and structures extending down to 87
Datta, R. N., 1972: Solar-eclipse effect on sporadic-E ion- km. Ann. Geophys., 24, 1861-1869, doi: 10.5194/an-
ization. J. Geophys. Res., 77, 260-262, doi: 10.1029/ geo-24-1861-2006. [Link]
JA077i001p00260. [Link] Patra, A. K., R. K. Choudhary, and J.-P. St.-Maurice, 2009:
Davis, J. R., W. C. Headrick, and J. L. Ahearn, 1964: A HF Solar eclipse-induced E-region plasma irregularities
backscatter study of solar eclipse effects upon the iono- observed by the Gadanki radar. Geophys. Res. Lett.,
sphere. J. Geophys. Res., 69, 190-193, doi: 10.1029/ 36, L13105, doi: 10.1029/2009GL038669. [Link]
JZ069i001p00190. [Link] Patra, A. K., P. Pavan Chaitanya, and D. Tiwari, 2011:
Farley, D. T., 1959: A theory of electrostatic fields in a Characteristics of 150 km echoes linked with so-
horizontally stratified ionosphere subject to a vertical lar eclipse and their implications to the echoing
magnetic field. J. Geophys. Res., 64, 1225-1233, doi: phenomenon. J. Geophys. Res., 116, A05319, doi:
10.1029/JZ064i009p01225. [Link] 10.1029/2010JA016258. [Link]
Farley, D. T., 1983: Pulse compression using binary phase Rishbeth, H. and O. K. Garriott, 1969: Introduction to Iono-
codes. Intern. Council Sci. Unions Middle Atmosphere spheric Physics, Academic Press, San Diego, California.
Program, 9, 410-414. Sridharan, R., C. V. Devasia, N. Jyoti, D. Tiwari, K. S.
Farley, D. T., 1985: Theory of equatorial electrojet plas- Viswanathan, and K. S. V. Subbarao, 2002: Effects
ma waves: new developments and current status. J. of solar eclipse on the electrodynamical processes
Atmos. Terr. Phys., 47, 729-744, doi: 10.1016/0021- of the equatorial ionosphere: A case study during 11
9169(85)90050-9. [Link] August 1999 dusk time total solar eclipse over In-
Fejer, B. G., J. Providakes, and D. T. Farley, 1984: Theory dia. Ann. Geophys., 20, 1977-1985, doi: 10.5194/an-
of plasma waves in the auroral E region. J. Geophys. geo-20-1977-2002. [Link]
Res., 89, 7487-7494, doi: 10.1029/JA089iA09p07487. Thampi, S. V., M. Yamamoto, H. Liu, S. Saito, Y. Otsuka,
[Link] and A. K. Patra, 2010: Nighttime-like quasi periodic
Gelinas, L. J., M. C. Kelley, and M. F. Larsen, 2002: Large- echoes induced by a partial solar eclipse. Geophys. Res.
scale E-region electric field structure due to gravity Lett., 37, L09107, doi: 10.1029/2010GL042855. [Link]
wave winds. J. Atmos. Sol.-Terr. Phys., 64, 1465-1469, Tsai, L. C. and J. Y. Liu, 1997: Ionospheric observations of
doi: 10.1016/S1364-6826(02)00110-4. [Link] the solar eclipse on Oct. 24, 1995 at Chung-Li. Terr.
Hines, C. O., 1960: Internal atmospheric gravity waves at Atmos. Ocean. Sci., 8, 221-231.
ionospheric heights. Can. J. Phys., 38, 1441-1481, doi: Van Zandt, T. E., R. B. Norton, and G. H. Stonehocker,
10.1139/p60-150. [Link] 1960: Photochemical rates in the equatorial F2 region
Kelley, M. C., 1989: The Earth’s Ionosphere: Plasma Phys- from the 1958 eclipse. J. Geophys. Res., 65, 2003-
ics and Electrodynamics, Academic Press, San Diego, 2009, doi: 10.1029/JZ065i007p02003. [Link]
California, 487 pp. Wang, C. Y. and Y. H. Chu, 2001: Interferometry investiga-
Le, H., L. Liu, X. Yue, and W. Wan, 2008: The ionospheric tions of blob-like sporadic E plasma irregularity using
responses to the 11 August 1999 solar eclipse: Obser- the Chung-Li VHF radar. J. Atmos. Sol.-Terr. Phys., 63,
vations and modeling. Ann. Geophys., 26, 107-116, 123-133, doi: 10.1016/S1364-6826(00)00141-3. [Link]
doi: 10.5194/angeo-26-107-2008. [Link] West, K. H., G. Goldsmith, D. Campbell, and S. Zandstra,
Liu, J. Y., Y. Y. Sun, Y. Kakinami, C. H. Chen, C. H. Lin, 2008: Effects of the 16 February 1980 solar eclipse
and H. F. Tsai, 2011: Bow and stern waves triggered on the composition of the low-latitude ionosphere as
by the Moon’s shadow boat. Geophys. Res. Lett., 38, seen by Atmosphere Explorer E. J. Geophys. Res., 113,
L17109, doi: 10.1029/2011GL048805. [Link] A12308, doi: 10.1029/2007JA012997. [Link]
Ogawa, T., O. Takahashi, Y. Otsuka, K. Nozaki, M. Ya- Whitehead, J. D., 1970: Production and prediction of spo-
mamoto, and K. Kita, 2002: Simultaneous middle and radic E. Rev. Geophys., 8, 65-144, doi: 10.1029/
upper atmosphere radar and ionospheric sounder ob- RG008i001p00065. [Link]
servations of midlatitude E region irregularities and Whitehead, J. D., 1989: Recent work on mid-latitude and
sporadic E layer. J. Geophys. Res., 107, 1275, doi: equatorial sporadic-E. J. Atmos. Terr. Phys., 51, 401-
10.1029/2001JA900176. [Link] 424, doi: 10.1016/0021-9169(89)90122-0. [Link]
Patra, A. K., S. Sripathi, V. Sivakumar, and P. B. Rao, 2004: Woodman, R. F., M. Yamamoto, and S. Fukao, 1991: Grav-
Statistical characteristics of VHF radar observations of ity wave modulation of gradient drift instabilities in
low latitude E-region field-aligned irregularities over mid-latitude sporadic E irregularities. Geophys. Res.
Gadanki. J. Atmos. Sol.-Terr. Phys., 66, 1615-1626, Lett., 18, 1197-1200, doi: 10.1029/91GL01159. [Link]You can also read