Vermont Annual Air Monitoring Network Plan 2018 - Vermont Department of Environmental Conservation Air Quality & Climate Division July 1, 2018 ...
←
→
Page content transcription
If your browser does not render page correctly, please read the page content below
Vermont Annual Air Monitoring Network Plan 2018
                                                                 Revision 1, July 1, 2018
                                                                             Page 1 of 45

Vermont Annual Air Monitoring Network Plan
                   2018

   Vermont Department of Environmental Conservation
            Air Quality & Climate Division
                     July 1, 2018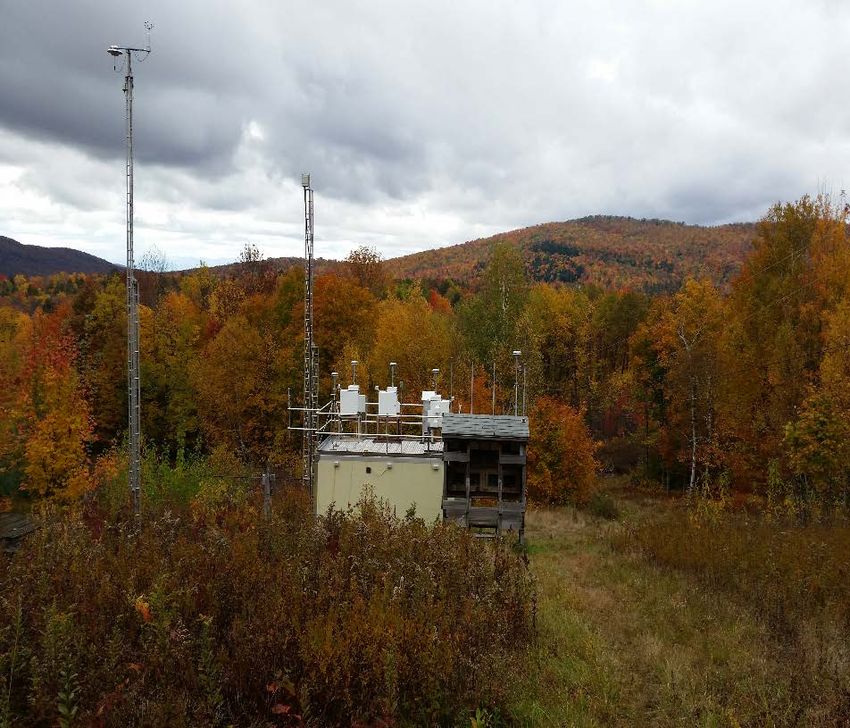
Vermont Annual Air Monitoring Network Plan 2018
                                                                                                                                  Revision 1, July 1, 2018
                                                                                                                                              Page 2 of 45

                                                                 Table of Contents

Section                                                                                                                       Page Number
List of Figures ................................................................................................................................. 3
List of Tables .................................................................................................................................. 4
Acronyms and Abbreviations ......................................................................................................... 5
Introduction ..................................................................................................................................... 6
Vermont Air Monitoring Network Plan Overview ......................................................................... 7
VT AQCD Air Monitoring Program Overview .............................................................................. 8
The Federal EPA National Ambient Air Quality Standards ........................................................... 9
Changes July 2017 to June 2018 Air Monitoring Network .......................................................... 11
Proposed Changes July 2018 to June 2019 Air Monitoring Network .......................................... 12
Network Pollutant Monitoring Descriptions ................................................................................. 14
− PM2.5 Monitoring Network ...................................................................................................... 14
− PM2.5 Speciation Monitoring Network .................................................................................... 16
− Black Carbon ............................................................................................................................ 17
− Ozone Monitoring Network ..................................................................................................... 18
− Enhanced Monitoring Plan ....................................................................................................... 19
− Ambient Air Toxics Monitoring Network ............................................................................... 20
− PM10 Monitoring Network ....................................................................................................... 21
− Oxides of Nitrogen (NO/NO2/NOx) and Total Reactive Oxides of Nitrogen (NOy) Monitoring
    Network................................................................................................................................... 22
− Nitrogen Dioxide Design Value (2017) ................................................................................... 23
− Carbon Monoxide Monitoring Network .................................................................................. 24
− Sulfur Dioxide Monitoring Network ........................................................................................ 25
Monitoring Site Parameter Information ........................................................................................ 26
− Site Description: Burlington – 150 South Winooski Ave. ....................................................... 27
− Site Description: Burlington – 108 Cherry Street. ................................................................... 29
− Site Description: Lye Brook – West Dover – Mount Snow..................................................... 31
− Site Description: Bennington – Airport Road .......................................................................... 33
− Site Description: Underhill – 58 Harvey Road ........................................................................ 35
− Site Description: Rutland – 96 State Street .............................................................................. 37
Appendix A. List of Analytes for Analytical Methods ............................................................. 39
Appendix B. CSN Analytes/MDLs (EPA, 2017) .................................................................... 42
Appendix C. National Ambient Air Quality Standards ............................................................ 44
References ..................................................................................................................................... 45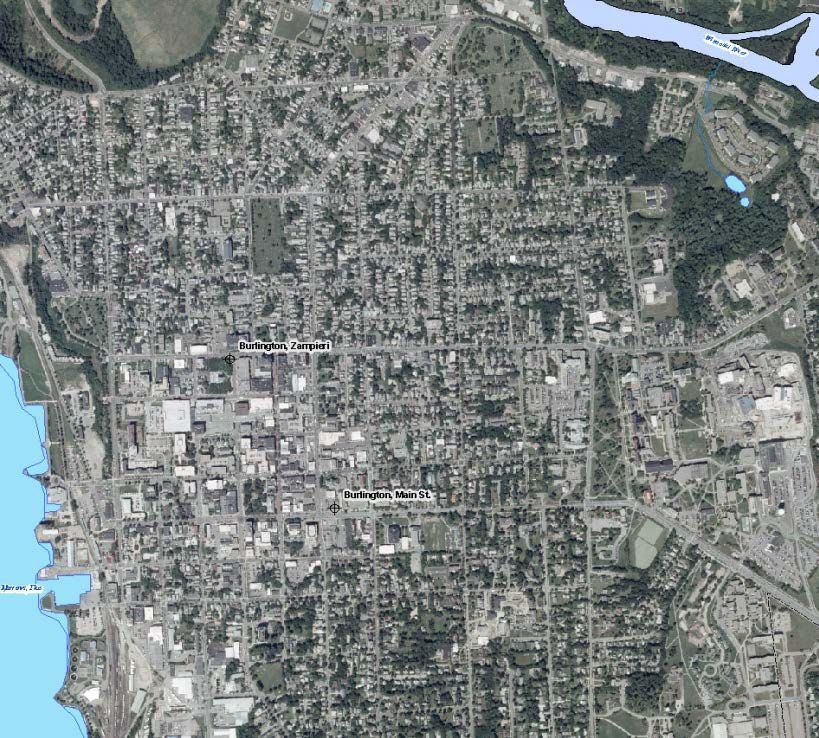
Vermont Annual Air Monitoring Network Plan 2018
Revision 1, July 1, 2018
Page 3 of 45
List of Figures
Figure ID Page Number
Figure 1 – Vermont Air Monitoring Network Plan Map .......................................................................... 13
Figure 2– Burlington Aerial Photo ........................................................................................................... 28
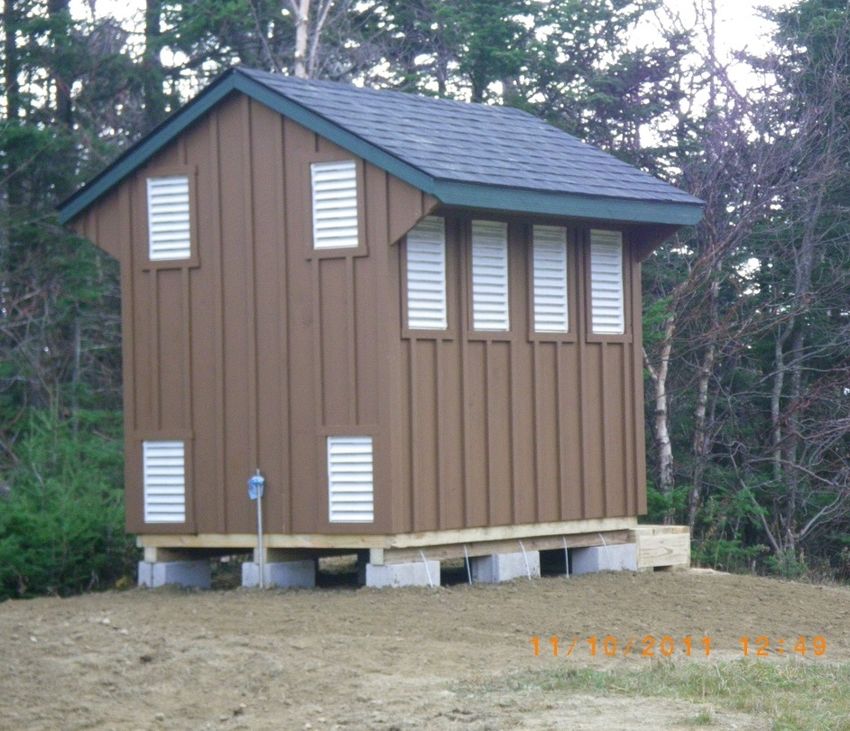
Figure 3– Burlington Monitoring Shelter ................................................................................................. 28
Figure 4 – Burlington Aerial Photo .......................................................................................................... 30
Figure 5 – Zampieri Building Sampling Platform .................................................................................... 30
Figure 6 – Aerial View Mount Snow ..................................................................................................... 32
Figure 7 – View of Monitor Location ....................................................................................................... 32
Figure 8 – Aerial View Bennington ....................................................................................................... 34
Figure 9 – Bennington Trailer................................................................................................................... 34
Figure 10 – Aerial View Underhill ........................................................................................................ 36
Figure 11 – Underhill IMROVE Shelter & Trailer ................................................................................... 36
Figure 12 – Aerial View Rutland ........................................................................................................... 38
Figure 13 – Rutland Trailer....................................................................................................................... 38
Vermont Annual Air Monitoring Network Plan 2018
                                                                                                                             Revision 1, July 1, 2018
                                                                                                                                         Page 4 of 45

                                                                 List of Tables

Table ID                                                                                                              Page Number
Table 1 – PM2.5 Sample/Analysis Method ................................................................................................ 14
Table 2 – PM2.5 Methods .......................................................................................................................... 15
Table 3 – PM2.5 2017 Annual Design Value ............................................................................................. 15
Table 4 – PM2.5 2017 24-Hour Design Value ........................................................................................... 15
Table 5 – Speciation Sample/Analysis Method ........................................................................................ 16
Table 6 – Black Carbon Monitoring Method ............................................................................................ 17
Table 7 – Ozone Monitoring Method ....................................................................................................... 18
Table 8 – Ozone 8-Hour 2017 Design Values .......................................................................................... 18
Table 9 – Vermont AQCD EMP ............................................................................................................... 19
Table 10 – Ambient Air Toxic Sampling/Analysis Methods ................................................................... 20
Table 11 – PM10 Sample/Analysis Method .............................................................................................. 21
Table 12 – Nitrogen Dioxide and Total Reactive Nitrogen Monitoring Method ..................................... 22
Table 13 – Nitrogen Dioxide 2017 1-Hour Design Values ...................................................................... 23
Table 14 – Nitrogen Dioxide 2017 Annual Average ................................................................................ 23
Table 15 – Carbon Monoxide Monitoring Method................................................................................... 24
Table 16 – Carbon Monoxide Design Value 2017 (Preliminary-based on 2nd max 1-hour and 8-hour
               averages) ........................................................................................................................... 24
Table 17 – Sulfur Dioxide Monitoring Method ........................................................................................ 25
Table 18 – Sulfur Dioxide Design Values 2017 ....................................................................................... 25
Table 19 – Network Ambient Air Pollutant Monitoring By Location...................................................... 26
Table 20 – Elemental Metals Analytes for PM10 (VAEL 2018, 47 mm Teflon) .................................... 39
Table 21 – List of Carbonyl Analytes (VAEL, 2018) .............................................................................. 39
Table 22 – Analyte List for VOC Analysis (VAEL, 2017) ...................................................................... 40
Table 23 – Analyte List for PAH Analysis (ERG, 2018) ......................................................................... 41
Vermont Annual Air Monitoring Network Plan 2018
                                                                                                          Revision 1, July 1, 2018
                                                                                                                      Page 5 of 45

                                          Acronyms and Abbreviations

AMTIC – Ambient Monitoring Technical Information Center
AQCD – (Vermont) Air Quality & Climate Division
AQI – Air Quality Index
BTEX – Benzene, Toluene, Ethylbenzene, Xylene
CAA – Clean Air Act
CARB – California Air Resources Board
CBSA – Core Based Statistical Area
CFR – Code of Federal Regulations
CO – Carbon Monoxide
CSA – Combined Statistical Area
CT DEEP – Connecticut Department of Energy & Environmental Protection
EPA – Environmental Protection Agency
FEMC – Forest Ecosystem Monitoring Cooperative
FEM – Federal Equivalent Method
FRM – Federal Reference Method
GIS – Geographical Information Systems
HAAS – Hazardous Ambient Air Standard
HAP – Hazardous Air Pollutants
IO – Inorganic
LC – Local Conditions of Temperature and Pressure
MDL – Method Detection Limit
MQO – Measurement Quality Objectives
NAAQS – National Ambient Air Quality Standards
NAMS – National Air Monitoring Station
NATTS – National Air Toxic Trends Stations Network
NCore – National Core Monitoring Sites
NECMSA – New England County Metropolitan Statistical Area
NO2 – Nitrogen Dioxide
NOx – Oxides of Nitrogen
NOy – Reactive Nitrogen Compounds
O3 – Ozone
OAQPS – Office of Air Quality Planning and Standards
PAH – Polycyclic Aromatic Hydrocarbon
PM10 – Particulate ≤10 micron aerodynamic particle size
PM2.5 – Particulate ≤2.5 micron aerodynamic particle size
PMc – Coarse Particulate between 10 and 2.5 micron aerodynamic particle size (PM10-2.5)
PMSA – Primary Metropolitan Statistical Area
QA/QC – Quality Assurance/Quality Control
QAPP – Quality Assurance Project Plan
SLAMS – State and Local Monitoring Stations
SO2 – Sulfur Dioxide
SOP – Standard Operating Procedure
SPMS – Special Purpose Monitoring Stations
STP – Standard Temperature and Pressure
TAPI – Teledyne API (Advanced Pollution Instruments)
TEI – Thermo Environmental Instruments
TL – Trace Level
TOR – Total Organic Reduction
TSP – Total Suspended Particulate
TSS – Technical Services Section (Monitoring Section) of the AQCD
VAEL– Vermont Agriculture and Environmental Lab
VOC – Volatile Organic Compound
XRF – X-Ray Fluorescence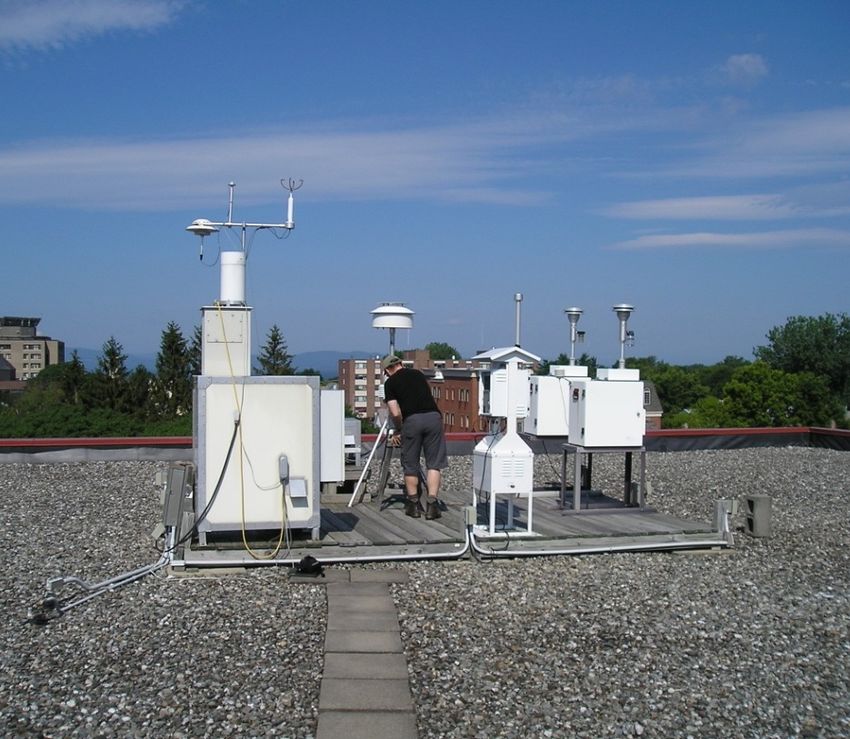
Vermont Annual Air Monitoring Network Plan 2018
                                                                                             Revision 1, July 1, 2018
                                                                                                         Page 6 of 45

                                            Introduction

In accordance with adopted federal EPA regulation, 40 CFR Part 58, Subpart B §58.10(1), the Vermont
Air Quality & Climate Division is required to submit to EPA by July 1, 2018 an air monitoring network
plan for the State of Vermont. The regulation requires that the network plan be posted on the AQCD
website or other form of notification for public comment 30 days prior to submission to the EPA Region
1 Office.

The current air monitoring network plan is available for public review on the AQCD website,
http://dec.vermont.gov/air-quality/monitoring, for the 30-day comment period prior to submittal to EPA.

Please send all comments regarding Vermont Air Monitoring Network Plan:

                                          Robert Lacaillade
                                      State of Vermont AQCD
                                      Davis Building 2nd Floor
                                      One National Life Drive
                                     Montpelier, VT 05620-3802

                                E-mail: robert.lacaillade@vermont.gov

The 2018 Network Plan was posted on the “public notice” section of the AQCD website listed above
from 5/25/18 through 6/26/18. During this period, the VT AQCD received no public comments. VT
AQCD did receive comments from EPA-New England in a letter dated 6/15/18, which is included at the
end of this document. VT AQCD revised the report as necessary to address EPA’s comments.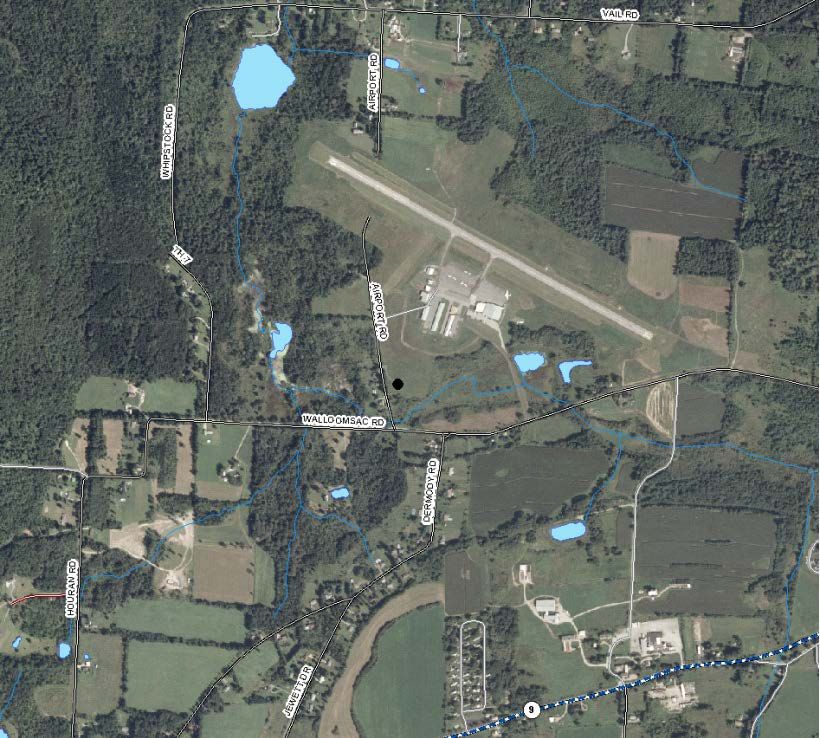
Vermont Annual Air Monitoring Network Plan 2018
                                                                                              Revision 1, July 1, 2018
                                                                                                          Page 7 of 45

                         Vermont Air Monitoring Network Plan Overview

The Vermont AQCD is a division within the Vermont Department of Environmental Conservation
(DEC), which is one of three departments in the Vermont Agency of Natural Resources. The mission of
the AQCD is to implement the Clean Air Act and Vermont State Statutes related to air quality. The
AQCD regulates air quality to protect public health and the environment. As part of that effort, air
monitoring data is required to be collected by federal regulations as put forth in the federal Clean Air
Act, 40 CFR Parts 50, 53, 58, and the Vermont Statutes Title 10, Part 1, Chapter 23, § 575. The
collected data is utilized to determine compliance with the Environmental Protection Agency’s (EPA)
National Ambient Air Quality Standards (NAAQS)(2), and Vermont’s Hazardous Ambient Air Standards
(HAAS)(3). Other important uses of the of air monitoring data includes production of a daily Air Quality
Index (AQI) report, daily air quality forecast report, support of short and long-term health risk
assessments, and tracking long-term environmental trends in air quality.

This document provides general information and overview of the Vermont Air Quality & Climate
Division’s air monitoring operational network. It also provides a brief annual summary of the Vermont
“NAAQS Design Values” where applicable, and some of the major activities and changes scheduled for
the upcoming year.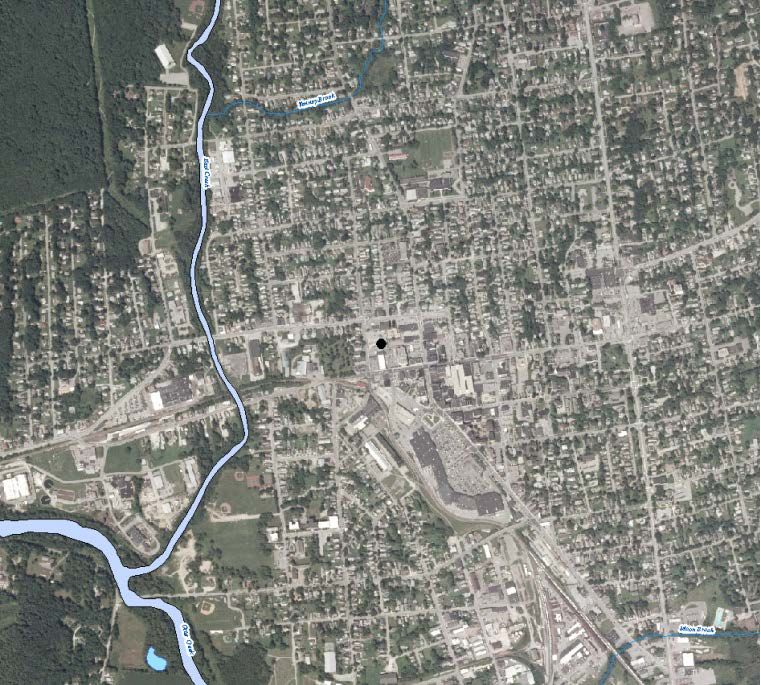
Vermont Annual Air Monitoring Network Plan 2018
                                                                                                Revision 1, July 1, 2018
                                                                                                            Page 8 of 45

                            VT AQCD Air Monitoring Program Overview

Air pollution is created by many anthropogenic sources such as cars, trucks, buses, factories, and power
plants, as well as natural sources such as forest fires, volcanoes, and wind storms. The air pollution
emanating from these sources can be local or transported from great distances. The amount of particulate
matter, carbon monoxide (CO), sulfur dioxide (SO2), and nitrogen dioxide (NO2) emitted into the
ambient air has been greatly reduced by control strategies and equipment applied to industrial sources.
The phase-out of leaded gasoline produced reductions in ambient air lead concentrations. New
automobiles are now equipped with emission controls and catalytic converters which greatly reduced
ambient air concentrations of NO2, CO and volatile organic compounds (VOCs). Through other
regional, national, and global control strategies, pollutants such as ozone and particulate matter
concentrations in Vermont are continuing to be reduced. New air pollution control technologies and
strategies on various emission sources are expected to provide further reductions of air pollutants in the
future.

Ambient air monitoring is valuable service, which is essential for state and federal environmental
planning, enforcement efforts, air pollutant trends analysis, and more recently providing timely air
quality health advisories. Air monitoring began in Vermont in the 1960’s, with a focus on total
suspended particulate (TSP). During the 1970’s, monitoring methods improved to allow for better
quality particulate sampling and continuous monitoring of gaseous criteria pollutants such as CO, SO2,
NO2, and ozone (O3). During the late 70’s and early 80’s rapid development of computerized data
acquisition systems allowed for collection of air quality data on a near real-time basis. Also during the
1980’s, monitoring methods and analytical techniques were developed to assay classes of toxic
compounds such as VOC’s, PCB’s, PAH’s, Carbonyls, and Metals. As technology improves, so does the
ability to identify and quantify pollutants in both a spatial and temporal manner. Some of the newer
technologies allow for real-time monitoring of toxic compounds.

The Vermont AQCD currently operates and maintains five permanent air monitoring stations and will be
evaluating potential sites during 2018 for relocation of the Burlington Main Street shelter, as requested
by the Burlington Department of Planning and Zoning. Vermont established a monitoring network for
criteria pollutants in the 1970’s and a network for toxic air pollutants in 1985. Currently, the AQCD
monitors for six criteria air pollutants and 96 air toxic pollutants (see Appendix A) as well as 53 separate
PM2.5 mass and chemical speciation parameters at the CSN/IMPROVE sites (see Appendix B). The
operation of all the SLAMS, NCore and CSN air monitors in the network meets the requirements in 40
CFR Part 58, Appendices A, C, D and E. The criteria pollutant monitoring methods utilized by the VT
AQCD are EPA federal reference method (FRM) or equivalent method (FEM) designated instruments.

All EPA CAA §105 & §103 grant agreements with VT AQCD require a Quality Assurance Project Plan
(QAPP), an annual Work Plan, and Standard Operating Procedures (SOPs). These are reviewed annually
and a summary update report is submitted to EPA annually by November 1st. The AQCD QAPPs and
most associated SOPs for the Criteria Gases, Particulate Matter, Air Toxics and National Air Toxics
Trend Sites (NATTS) have received EPA approval. The annual update for the Air Toxics and NATTS
QAPP was submitted in December, 2017. The QAPP for the Criteria Gas & Particulate Matter Pollutant
Monitoring, Revision 1 was originally approved by EPA on 10/14/16 and the annual update identified as
Revision 2 was completed on 10/1/17 and submitted to EPA on 12/14/17. The Meteorological QAPP is
pending and is scheduled to be finalized and submitted to EPA in 2018.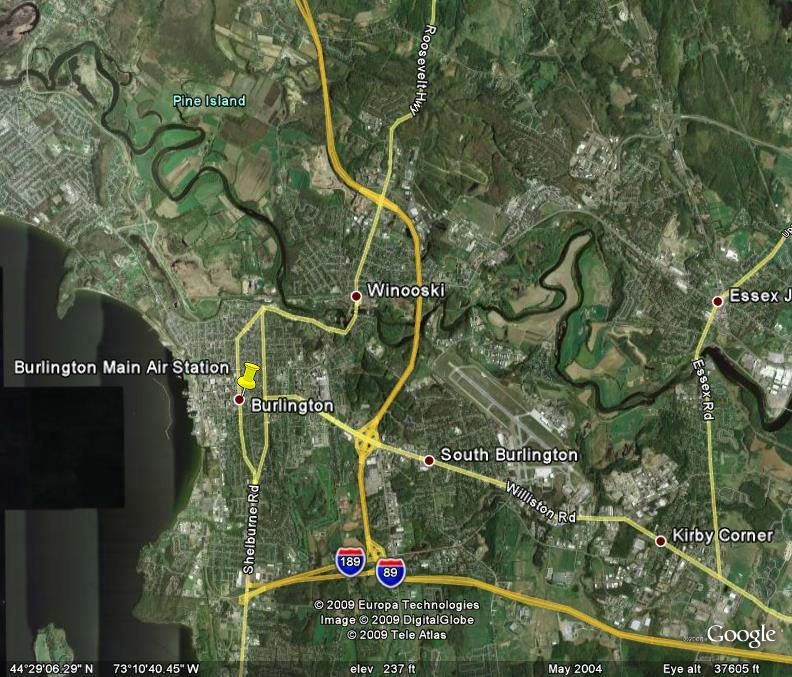
Vermont Annual Air Monitoring Network Plan 2018
                                                                                                Revision 1, July 1, 2018
                                                                                                            Page 9 of 45

                     The Federal EPA National Ambient Air Quality Standards

The Clean Air Act of 1990 requires EPA to set NAAQS’s (40 CFR part 50) for pollutants that are
deemed harmful to public health and the environment. The Clean Air Act presents two types of
NAAQS’s: primary standards provide public health protection, including protecting the health of
"sensitive" populations such as asthmatics, children, and the elderly; secondary standards provide public
welfare protection, including protection against decreased visibility and damage to animals, crops,
vegetation, and buildings.

EPA identified NAAQS’s for six principal pollutants, which are called "criteria" pollutants. They are
listed in Appendix B of this document. Units of measure for the standards are parts per million (ppm) by
volume, parts per billion (ppb) by volume, or micrograms per cubic meter of air (µg/m3).

On December 16, 2006, the EPA reduced the daily PM2.5 NAAQS from 65 µg/m3 to 35 µg/m3. The
annual PM2.5 NAAQS remained 15µg/m3. Vermont operates a small network of FRM filter based
samplers as well as FEM for continuous PM2.5 to assess air quality for PM2.5.

On December 16, 2006, a regulation update addressed the creation of a multi-pollutant National Core
(NCore) site network throughout the country. EPA’s Office of Air Quality Planning and Standards
(OAQPS) approved Vermont’s NCore station at Underhill, VT on October 30, 2009. The Underhill site
is one of 20 rural sites within the NCore network. The upgrades to the existing site required the addition
of “trace level” monitoring for carbon monoxide, nitrogen oxides, and sulfur dioxide.

On November 12, 2008, the NAAQS for lead was strengthened to 0.15 micrograms per cubic meter for
both the primary and secondary standard. In April 2012, the EPA issued the final NAAQS lead
monitoring requirements for the required monitoring sites. Vermont was not required to set up any
NAAQS lead monitors at that time. The reason for this designation is that the State of Vermont does not
meet the regulation requirements with regard to population thresholds for the Core Based Statistical
Area (CBSA). Vermont airports do not meet “take off” & “landing” thresholds, and stationary emission
source “tons per year” do not meet required thresholds. The 2009 Vermont lead (Pb) NAAQS
Monitoring Plan provided the current plan and approach that was pursued by the State of Vermont with
regard to the ambient air lead monitoring network prior to the 2010-2012 monitoring requirement
updates. As of January 2010, VT AQCD, as part of the National Air Toxics Trends Site (NATTS) in
Underhill, has conducted low-volume PM10 sampling with subsequent multi-metals analysis (Pb
included). Beginning in 2017 and 2018, low-volume PM10 sampling with subsequent multi-metals
analysis (Pb included) is being performed at Rutland and Burlington Main Street sites, accordingly. On
December 19, 2014, the EPA reviewed the standard requirements and opted to retain the existing
standards.

The final rule for NO2 NAAQS was adopted on January 22, 2010. The new 1-hour average NO2
NAAQS is based on the 3-year average of the 98th percentile of the 1-hour daily maximum. The 1-hour
NAAQS value was set at 100 ppb. EPA, in cooperation with States/Local/Tribal agencies, will set up 40
NO2 monitors nationwide to help protect communities that are susceptible to NO2 health effects.
Vermont is not currently required by EPA under this rule to set up any additional NO2 monitors or
require consideration of a “near roadway” site in the network other than what is currently being operated
in Burlington and Rutland or elsewhere in the state of Vermont.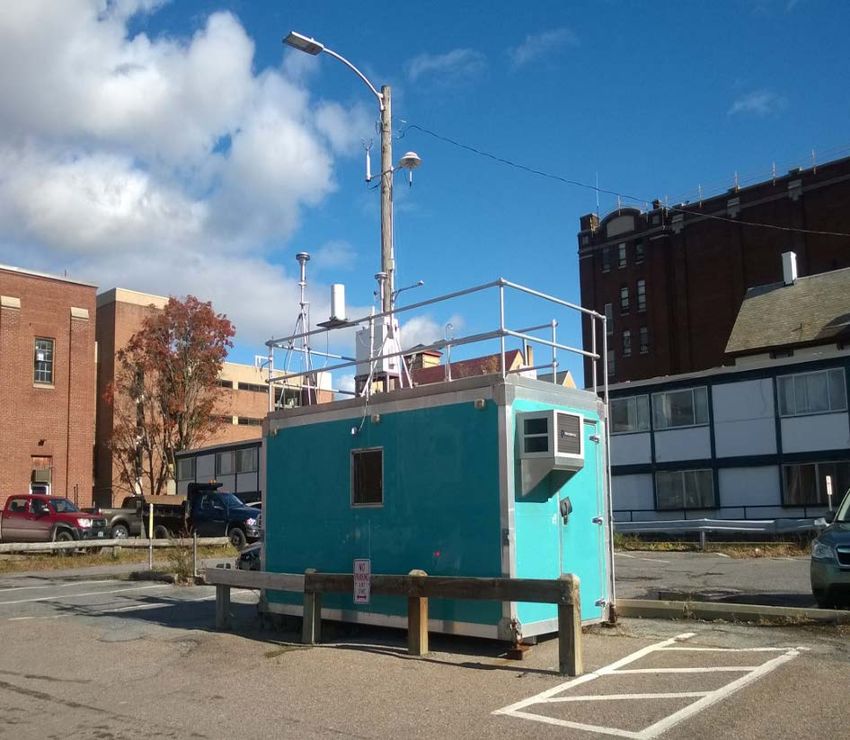
Vermont Annual Air Monitoring Network Plan 2018
                                                                                              Revision 1, July 1, 2018
                                                                                                        Page 10 of 45

A new 1-Hour SO2 NAAQS was adopted on June 2, 2010. EPA strengthened the primary NAAQS for
SO2 by establishing a 1-hour standard level of 0.075 ppm. The new design value is a three-year average
of the 99th percentile of the annual distribution of the daily maximum 1-hour average concentration for
that year. The rule revokes the previous 24-hour standard (140 ppb) and annual standard (30 ppb). The
Vermont recommended design value uses 2015, 2016, and 2017 SO2 summary data. Vermont is not
currently required under the new rule to set up additional SO2 monitors in the network, beyond what is
currently in Rutland. EPA finalized its Data Requirements Rule for the 1-hour Sulfur Dioxide Primary
NAAQS on August 21, 2015 (80 FR 51052), and provided detailed monitoring and modeling guidance
for implementing the SO2 standard.

On January 15, 2013, EPA adopted an updated PM2.5 primary annual PM2.5 standard of 12 ug/m3 and
the secondary standard of 15 ug/m3. This annual PM2.5 average will be computed as the average of the
last three years. As an example: The average for 2012 would be the annual averages from 2010, 2011
and 2012. In addition, EPA established that all continuous PM2.5 FEM monitors operating for more than
24 months be used for comparison to the NAAQS unless the state specifically requests that the data be
excluded as is provided under 40 CFR Part 58.11(e).

The ozone primary and secondary NAAQS for 8-hour average of 0.070 ppm was adopted on December
28, 2015. At this time, Vermont is in compliance with the current NAAQS ozone standard.
Vermont Annual Air Monitoring Network Plan 2018
Revision 1, July 1, 2018
Page 11 of 45
Changes July 2017 to June 2018 Air Monitoring Network
The Vermont AQCD network changes, additions, and deletions that were performed during the 12-
month period between July 2017-June 2018 were:
1. Between 8/22/17 and 4/14/18 the Burlington Main Street TEI 2000i FRM was temporarily
configured from PM10 to PM2.5 to provide comparison data for new TAPI T640 FEM.
2. Temporary Rutland PM changes during this period included increasing the TEI 2025i FRM
sampling schedule from 1-in-6 day to 1-in-3 day from 10/7/17 through 4/8/18 and reconfiguring
the TEI 2000i FRM from PM10 to PM2.5 from 1/3/18-3/28/18, to provide collocated FRM
measurements during evaluation of the new TAPI T640 FEM.
3. On 3/7/18 , a new TAPI T703 ozone calibrator was installed at the Bennington site as the new
station ozone standard calibrator, rather than being installed as the new primary standard at the
Berlin Field Operation Center, as was proposed in the previous 2017 Annual Plan.
4. On 7/27/17, new TAPI T640 continuous PM2.5 FEM monitors were installed at the Bennington
and Rutland site replacing a TEI TEOM and MetOne BAM, respectively. Rutland is now the
designated network collocated site for the T640 FEM.
5. On 8/22/17, new TAPI T640 continuous PM2.5 FEM monitors were installed at Burlington Main
Street and Underhill Sites, replacing TEI TEOM monitors at both sites.
6. On 12/31/17, meteorological parameter monitoring was discontinued at Burlington Cherry St.
Site (Zampieri Building).
7. Beginning with the 1/1/17 sample, Rutland PM10 filters were submitted for subsequent metals
analyses on a 1-in-12 day schedule.
8. A new TAPI T400E Ozone analyzer was installed at the Underhill NCore Site on 10/27/17.
9. A new Agilaire 8872 datalogger was installed at the Underhill Ncore Site on 6/1/17.
10. A new Magee AE33 Aethalometer was received on 5/7/18 and is scheduled for installation at the
Rutland site during the summer of 2018.
11. The Agilaire AgileWeb module was installed on the AQCD’s website and went live on 3/23/18,
providing real time public access to current and historic AQCD criteria air monitoring data and
meteorological parameters.Vermont Annual Air Monitoring Network Plan 2018
Revision 1, July 1, 2018
Page 12 of 45
Proposed Changes July 2018 to June 2019 Air Monitoring Network
The Vermont AQCD network changes, additions and deletions that are planned for the next 12 months
of July 2018-June 2019 are:
1. Procure a reactive nitrogen compounds analyzer (trace-NOy), dynamic dilution calibrator and
zero air system for the Underhill NCore site. Purchase requisitions are scheduled to be submitted
during the Summer/Fall of 2018.
2. Install the recently procured Magee AE33 Aethalometer (Black Carbon-EC/OC-7 channels) at
the Rutland site which is scheduled for a date TBD, sometime during the Summer of 2018. The
AE33 will replace the legacy AE22 Aethalometer currently operated at that site.
3. Begin submitting Burlington PM10 filters for subsequent metals analyses on a 1-in-12 day
schedule.
4. Continue working with the Burlington Planning Department and others on developing a plan for
the relocation of the Burlington Main Street monitoring site. The Burlington Planning
Department has indicated that the redevelopment project for the current monitoring site location
is in transition with no firm schedule and suggests that site relocation planning should
nonetheless proceed proactively as city plans for this block renovation are continuing to be
developed.Vermont Annual Air Monitoring Network Plan 2018
Revision 1, July 1, 2018
Page 13 of 45
Figure 1 – Vermont Air Monitoring Network Plan Map
2018 Vermont Ambient Air Monitoring NetworkVermont Annual Air Monitoring Network Plan 2018
Revision 1, July 1, 2018
Page 14 of 45
Network Pollutant Monitoring Descriptions
Below is the list of network pollutant monitoring descriptions with number of sites, the sampling
frequency, and specific network information.
PM2.5 Monitoring Network
Continuous: The Vermont AQCD operates four (4) continuous PM2.5 monitoring sites in the air
monitoring network, at the Burlington Main Street, Underhill, Rutland and Bennington sites (see Table
1). The TAPI T640 continuous PM2.5 monitor is operated at all four sites and has Federal Equivalency
Method (FEM) designation from EPA (EQPM-0516-236). All T640 PM2.5 monitors are operated year-
around and the T640 at the Rutland site is collocated with a PM2.5 TEI 2025i FRM sampler on a 1-in-6
day schedule, for official determination of network precision, QA assessment and comparative analysis
for this method. The T640 at the Underhill site is also collocated with a TEI 2025i FRM on a 1-in-3 day
schedule for NCore requirements and provides unofficial method precision for informational purposes.
The TAPI T640 continuous PM2.5 monitor design is a direct ambient air measurement method (no in-
line filter) using optical broadband spectrometry which converts 90o scattered polychromatic LED light
from suspended aerosol particles into a mass concentration in µg/m3. Continuous PM2.5 µg/m3 data is
reported as 1-hour averages. The T640 FEMs at all four VT sites are designated in AQS as the primary
monitor for PM2.5 LC (AQS code: 88101). The network primary and collocated monitors are deemed
suitable for the applicable NAAQS comparison. Vermont AQCD is not requesting that any site’s
continuous PM2.5 FEM be excluded from comparison to the NAAQS. As of 2014, all continuous PM2.5
FEM monitoring data from VT sites have been reported as PM2.5 LC (88101).
FRM: The Vermont AQCD currently operates two (2) PM2.5 TEI 2025i FRM samplers (see Table 1) in
the air monitoring network, at the Rutland and Underhill sites. The Underhill NCore sampler operates on
a 1-in-3 day sampling schedule, while the Rutland sampler operates on a 1-in-6 day sampling schedule
as the designated network collocated sampling site for assessing precision for T640 FEM.
The EPA approved FRM sampling method collects an integrated 24-hour particulate sample on a 47mm
Teflon® filter disc (SeeTable 2). The particulate collected on the filter has an aerodynamic particle size
of ≤ 2.5 microns. The filter and associated sampling data are post processed using gravimetric
assessment (by CT DEEP) to determine the mass concentration for the 24-hour sampling period.
Table 1 – PM2.5 Sample/Analysis Method
Continuous FEM FRM Collection Collocated Precision
Site FRM
(Primary) frequency Site
Teledyne API 1-in-3 day NCore/Informational
Underhill TEI 2025i
T640
Teledyne API
Rutland TEI 2025i 1-in-6 day Yes (network)
T640
Teledyne API
Burlington Main Street N/A N/A N/A
T640
Teledyne API
Bennington N/A N/A N/A
T640Vermont Annual Air Monitoring Network Plan 2018
Revision 1, July 1, 2018
Page 15 of 45
Table 2 – PM2.5 Methods
Reported Data Interval
Sampler Collection Analytical Method
TEI 2025i
Low Volume 47 mm Teflon® Gravimetric/
Manual Equivalent Method: 24-houir
Filter - 24 Hour CT DEEP
EQPM–0202–145
TAPI T640 Continuous.Broadband
Direct Measurement 1-Hour
EQPM–0516–236 Spectroscopy
“Design values” for PM2.5 must be calculated every year for operational sites operating FRM or FEM
PM2.5 monitors/samplers. The site must meet the design value statistical definition in order for a design
value to be calculated. See below for further information.
PM2.5 Annual Design Value (2017)
PM2.5 annual design values are presented in Table 3 below and are calculated using the 3-year average of
the respective annual averages from 2015-2017. The current annual PM2.5 NAAQS is 12µg/m3.
Currently, all Vermont monitors are in attainment of the annual PM2.5 NAAQS.
Table 3 – PM2.5 2017 Annual Design Value
Design Value (µg/m3)
Site
Years 2015-2017
Bennington 5.5
Burlington Main St 5.6
Rutland 7.5
Underhill 3.2
Source: EPA AQS AMP480.
PM2.5 24-Hour Design Value (2017)
The PM2.5 24-Hour design values are presented in Table 4 below and are calculated using the 3-year
average of the annual 98th percentile 24-hour averages from 2015-2017. The 24-hour average PM2.5
NAAQS is 35 µg/m3. Currently, all Vermont monitors are in attainment for the daily PM2.5 NAAQS.
Table 4 – PM2.5 2017 24-Hour Design Value
Design Value (µg/m3)
Site
Years 2015-2017
Bennington 14
Burlington Main Street 14
Rutland 22
Underhill 10
Source: EPA AQS AMP480.Vermont Annual Air Monitoring Network Plan 2018
Revision 1, July 1, 2018
Page 16 of 45
PM2.5 Speciation Monitoring Network
The Vermont AQCD operates two (2) PM2.5 speciation sites in the air monitoring network at the
Burlington-Cherry Street (Zampieri) and Underhill sites (See Table 5). The samplers operate on a 1-in-3
day schedule and produce a 24-hour integrated filter based sample. A third Vermont site not officially
part of the AQCD network, which is operated and maintained by the U.S. Forest Service (USFS), is
located at Dover, VT. Both the Underhill and Dover, VT (Mt. Snow-Lye Brook) are part of the
IMPROVE (Interagency Monitoring of Protected Visual Environments) network. The Burlington Cherry
Street site is part of the EPA Speciation Trends Network (STN).
The analysis of the filters generates µg/m3 concentration results for 53 parameters on chemical makeup of
PM2.5 (see Appendix B). The parameters include levels of sulfate, nitrate, ammonium, and trace
elements including metals, elemental carbon, and organic carbon. The STN is designed to complement
the PM FEM/FRM network. The IMPROVE network monitors are mostly located in rural areas, and
provide measurements of regional and background levels of PM2.5 concentrations on a 1-in-3 day
sampling schedule. The same chemical components are measured by IMPROVE as are measured by the
STN, although differences exist between the methods employed to collect and analyze the collected
sample.
In 2009, the STN network deployed the new URG carbon sampler to enhance the carbon speciation
measurement. The sampler operates on the 1-in-3 day schedule and is collocated with the current Met
One SUPERSASS sampler.
Table 5 – Speciation Sample/Analysis Method
Pollutant Sampler Collection Analytical Analytes /Lab
Method
Low Volume Multi See
PM Speciation (STN) Met One - SUPERSASS Filter sequential STN Appendix B/UCDavis &
24 Hour DRI
Low Volume Multi Carbon See
PM Carbon (STN) URG 3000-N Filter Analysis Appendix B/ UCDavis &
24 Hour DRI
Low Volume Multi See
PM Speciation UCDavis – IMPROVE
Filter - IMPROVE Appendix B/ UCDavis &
(IMPROVE) Sampler
24 Hour DRIVermont Annual Air Monitoring Network Plan 2018
Revision 1, July 1, 2018
Page 17 of 45
Black Carbon
The AQCD currently operates a Magee AE22 Aethalometer at the Rutland site which measures the
optical absorption of carbon particles at two wavelengths: 880 nm (IR), quantitative for the mass of
‘black’ or elemental carbon; and 370 nm (UV). With data processing aromatic organic compounds such
as are found in wood smoke, biomass-burning smoke, and tobacco smoke may be identified. Utilizing
dual wavelength measurement allows for the determination of the sources of airborne black carbon
particles (ie. diesel exhaust vs. wood smoke combustion). Data is store at 1 hour intervals.
The AQCD recently received a new Magee AE33 Aethalometer (7 wavelength measurement channels)
which is scheduled to be installed at the Rutland site during the summer of 2018, replacing the legacy
AE22 instrument.
Table 6 – Black Carbon Monitoring Method
Analytical Reported Data
Pollutant Sampler Collection
Method Interval
Magee AE22 (current) Continuous
Quartz Filter
Black Carbon Magee AE33 (summer Optical 1 Hour
Tape
of 2018) MeasurementVermont Annual Air Monitoring Network Plan 2018
Revision 1, July 1, 2018
Page 18 of 45
Ozone Monitoring Network
The Vermont AQCD operates three (3) ozone sites in the air monitoring network, Bennington, Underhill
and Rutland. Currently, all ozone analyzers are operated year-round. Data is collected continuously and
recorded as 1-hour averages. Ozone measurements are utilized to determine compliance with the 1-hour
and 8-hour NAAQS, atmospheric transport modeling, and ozone precursor studies. Data is transferred
hourly to the EPA AIRNOW website for AQI mapping and air quality forecasting. The AQCD operates
TAPI Model T400 ozone analyzers at all sites (seeTable 7).
“Design values” for ozone must be calculated every year for sites operating FEM instruments. The site
must meet the design value statistical definition in order for a design value to be calculated. See below
for further information.
Table 7 – Ozone Monitoring Method
Analytical Reported Data
Pollutant Sampler Collection
Method Interval
TAPI T400
Automated Equivalent Ultraviolet
Ozone Continuous 1 Hour
Method: Photometry
EQOA-0992-087
Ozone Design Value (2017)
Below are the current design values for ozone determined from data for 2015-2017 (See Table 8). Ozone
design values are calculated by taking the 3-year average of the annual 4th maximum daily maximum 8-
hour ozone averages. The applicable NAAQS 8-hour ozone standard is 0.070 ppm (effective 12/28/15).
Currently, all Vermont monitors are in attainment for ozone NAAQS.
Table 8 – Ozone 8-Hour 2017 Design Values
Design Value (PPM)
Site
Years 2015-2017
Bennington 0.065
Underhill 0.062
Rutland 0.063*
Source: EPA AQS AMP480.*: Ozone monitoring began 4/1/16, design value criteria not met: value reported is
average 4th max for only 2016 and 2017.Vermont Annual Air Monitoring Network Plan 2018
Revision 1, July 1, 2018
Page 19 of 45
Enhanced Monitoring Plan
Vermont is located in the Ozone Transport Region (OTR) as defined in 40 CFR 51.900 making it
subject to developing an Enhanced Monitoring Plan (EMP) detailing enhanced ozone and ozone
precursor monitoring per 40 CFR Part 58, Appendix D, 5. (h). For OTR states, the EMP must be
submitted to the EPA Regional Administrator no later than 10/1/19. Vermont AQCD’s EMP is being
submitted as part of the 2018 Annual Air Monitoring Network Plan as required by 40CFR 58.10.
Vermont AQCD understands that EPA has encouraged OTR states to work towards a comprehensive
effort to understanding and eventually solving the ozone problem in this Region. Vermont is designated
by EPA as Attainment/Unclassifiable and the Underhill NCore is not in a Core-Based Statitiscal Area
(CSBA) with a population of 1,000,000 or more. Consequently, the AQCD is not, nor has ever been,
required to operate a PAMS site and does not receive any EPA PAMS funding. Consequently,Vermont
AQCD’s ability to contribute to the OTR ozone issue is limited and based on available resources.
Nevertheless,Vermont AQCD has determined its EMP includes additional monitoring activities it
performs that exceed EPA requirements in Sections 4.1 and 4.3 of 40 CFR Part 58, Appendix D, which
are listed in Table 9 – Vermont AQCD EMP. These activities along with existing continuous NO2 and
NOy monitoring at AQCD network sites, can be considered important in helping to understand the ozone
problem in Vermont, the northeast and the OTR.
The EMP activities include the operation of an additional network ozone monitor at the Rutland site
which is operated year round, operating the existing Bennington SLAMS site ozone monitor year round
and the 24-hr sample collection and analysis of a subset of the PAMS target list compounds, including
carbonyls and speciated VOCs, at three (3) AQCD network sites (including 2 of 3 network ozone
monitoring sites) on a 1-in 6 day or 1-in-12 day schedule.
Table 9 – Vermont AQCD EMP
Site (see Table Measurement EMP
Parameter 18/descriptions for Comments
details) Frequency/Avg./Units Qualification
Additional Site
exceeds Part 58
Ozone Rutland Continuous/1-hr avg./ppm App. D SLAMS
4.1/operated
year-around
Operated year-
Ozone Bennington Continuous/1-hr avg./ppm SLAMS
around
Underhill (NATTS) 1-in-6/24 hr avg./µg/m3 Non-PAMS formaldehyde
Carbonyl Burlington Main St. 1-in-12/24 hr avg./µg/m3 TO-11A acetaldehyde
Rutland 1-in-12/24 hr avg./µg/m3 monitoring acetone
styrene, 1,3-butadiene,
Underhill (NATTS) 1-in-6/24 hr avg./ppb Non-PAMS benzene, toluene,
ethylbenzene, m/p/o-
VOCs Burlington Main St. 1-in-12/24 hr avg./ppb TO-15 xylene, octane, 1,2,4-
Rutland 1-in-12/24hr avg./ppb monitoring trimethylbenzene, 1,3,5-
trimethylbenzeneVermont Annual Air Monitoring Network Plan 2018
Revision 1, July 1, 2018
Page 20 of 45
Ambient Air Toxics Monitoring Network
The Vermont AQCD operates three (3) ambient air toxics monitoring sites in the air monitoring
network, located at the Burlington Main Street, Rutland and Underhill sites. The Underhill site is part of
the EPA NATTS network and the Burlington and Rutland air toxics monitoring sites are part of the
Vermont AQCD Air Toxics Monitoring Network.
The air toxic sample collection and analysis program includes volatile organic compounds (VOC),
carbonyl compounds and PM10 metals at all sites (PM10 metals were added at Burlington Main Street site
in 2018). VOC and carbonyl compound samples are collected with a combined VOC/carbonyl air
toxics sampler and the PM10 metals samples are collected on 47 mm Teflon® filters using FRM
samplers operated for the PM10 network (see Table 11 – PM10 Sample/Analysis Methodbelow). VOC,
carbonyl and metals samples are collected on a 1-in-12 day schedule at the Burlington Main Street and
Rutland sites and a 1-in-6 day schedule at the Underhill site. The Underhill site also includes sampling
and analysis of polyaromatic hydrocarbons (PAH) compounds on a 1-in-6 day schedule to meet NATTS
requirements.
In addition to the VOC samples collected at all 3 sites, a Synspec GC955 semi-continuous analyzer
using gas chromatography with photo ionization detector (GC/PID) is operated at the Burlington Main
Street site to determine 15-minute average concentrations of benzene, toluene, ethylbenzene and xylenes
(BTEX). Please note that the GC955 analyzer was out of service for 2017 due to a malfunction and is
currently being serviced at the manufacturer’s representative’s facility and is expected to be back in
service sometime during the summer of 2018. See Table 10 below for the list of sampling methods and
analytical methods. The list of target analytes and associated MDLs for the all analytical air toxics
methods are listed in Appendix A.
Table 10 – Ambient Air Toxic Sampling/Analysis Methods
Analytical
Pollutant Sampler Collection Analytes/Lab
Method
6 Liter Silco-coated SS
ATEC 2200 TO-15 55 VOC Compounds
VOC Canister-
(combined sampler) (GC/MS) VAEL Lab
24 Hour (sub-atmospheric)
4 Carbonyl
ATEC 2200 DNPH Cartridge- TO-11A
Carbonyl Compounds
(combined sampler) 24 Hour (HPLC)
VAEL Lab
Metals TEI 2025i/2000i PM10 Teflon® Filter- IO-3.5 15 Elements
(Lead Included) Low-Volume 24 Hour (ICP/MS) VAEL.Lab
22 PAH Compounds
PUF/XAD- TO-13A
PAH Tisch PUF + ERG (EPA National
24 Hour (GC/MS)
Contract Lab)
5 VOC
Synspec GC955 Series Semi- Continuous
BTEX GC-PID Compounds/direct
600 15 Minute
measurementVermont Annual Air Monitoring Network Plan 2018
Revision 1, July 1, 2018
Page 21 of 45
PM10 Monitoring Network
The Vermont AQCD currently operates three (3) PM10 monitoring sites in air monitoring network at the
Burlington Main Street, Rutland and Underhill sites. The Underhill is a NCore site and operates on a 1-
in-3 day sampling schedule, with collocated PM10 sample collection performed on 1-in-6 day schedule.
The Burlington Main Street and Rutland sites operate on a 1-in-6 day schedule. Please note that the
Burlington Main Street FRM sampler was operated as a PM2.5 sampler when the TAPI T640 PM2.5
monitor was initially installed at that site up through 4/14/18, when after that point it was reconfigured
as a PM10 sampler and operated on a 1-in-6 day schedule.
The sampling method utilized for sample collection is 24-hour low volume sample collection, on a
47mm Telfon® filter (See Table 11 – PM10 Sample/Analysis Method). The particulate collected on the
filter has an aerodynamic particle size of ≤10 microns. The filter and associated sampling data are post
processed using gravimetric analysis to determine the mass concentration for the 24-hour sampling
period. The gravimetric determination for concentration of PM10 is completed by CT DEEP.
At the Underhill NCore site, the PM10 collocated sampling is performed with TEI 2025i samplers on the
1-in-6 day schedule. These Underhill PM10 samples as well as the Burlington Main Street and Rutland 1-
in-12 day PM10 samples are subsequently submitted for metals analysis to the VAEL laboratory. The
metals analysis performed does include the element lead (Pb). The ICP/MS analytical method performed
by VAEL is not designated by EPA as a FEM for lead (Pb) NAAQS determination, so Pb analyses
results for all 3 sites will be submitted to AQS using code for lead in PM10 for Non-FRM/FEM methods
(85128).
Table 11 – PM10 Sample/Analysis Method
Analytical
Pollutant Sampler Collection Location /Lab
Method
TEI 2025i
Manual Reference Method: Low Volume 47 Underhill
PM10 Gravimetric
RFPS-1298-127 mm Teflon® Filter CT DEEP
TEI 2000i Rutland
Manual Reference Method: Low Volume 47
PM10 Gravimetric Burlington Main Street
RFPS-1298-126 mm Teflon® Filter
CT DEEPVermont Annual Air Monitoring Network Plan 2018
Revision 1, July 1, 2018
Page 22 of 45
Oxides of Nitrogen (NO/NO2/NOx) and Total Reactive Oxides of Nitrogen (NOy) Monitoring
Network
The Vermont AQCD operates two (2) nitrogen oxide (NO/NO2/NOx) analyzers which are presently
located at the Burlington and Rutland monitoring sites. Ambient concentrations of both nitrogen dioxide
and nitric oxide are determined by the continuous chemiluminescence method (See Table 12– Nitrogen
Dioxide and Total Reactive Nitrogen Monitoring Method). The NOx samplers are operated year-round.
The AQCD also operates a total reactive nitrogen (NOy) trace level analyzer at the Underhill NCore
monitoring site.
Table 12 – Nitrogen Dioxide and Total Reactive Nitrogen Monitoring Method
Reported
Pollutant Sampler Collection Analytical Method
Data Interval
Teledyne-API T200
Nitrogen Dioxide/Nitric
Automated Reference Method: Continuous Chemiluminescence 1 Hour
Oxide
RFNA-1194-099
Ecotech EC9843
Total Reactive Nitrogen
Automated Reference Method: Continuous Chemiluminescence 1 Hour
Compounds-NOy (trace)
RFNA-1292-090Vermont Annual Air Monitoring Network Plan 2018
Revision 1, July 1, 2018
Page 23 of 45
Nitrogen Dioxide Design Value (2017)
Below are the current calculated 1-hour & annual design values for nitrogen dioxide from 2015-2017
(See Table 13 & Table 14). Nitrogen dioxide design values are calculated by taking the 3-year average
of the 98th percentile daily maximum 1-hour nitrogen dioxide averages. The current 1-hour nitrogen
NAAQS standard is 100 parts per billion. The current annual NAAQS NO2 standard is 53 parts per
billion. The annual average is simply the average of all annual 1 hr averages. Currently, all Vermont
monitors are in attainment for nitrogen dioxide.
Table 13 – Nitrogen Dioxide 2017 1-Hour Design Values
Design Value (PPB)
Site
Years 2015-2017
Burlington Main Street 31
Rutland 35
Source: EPA AQS AMP480
Table 14 – Nitrogen Dioxide 2017 Annual Average
Site 2017 Annual Average(PPB)
Burlington Main Street 6.03
Rutland 6.45
Source: EPA AQS AMP450Vermont Annual Air Monitoring Network Plan 2018
Revision 1, July 1, 2018
Page 24 of 45
Carbon Monoxide Monitoring Network
The Vermont AQCD operates three (3) carbon monoxide (CO) analyzers in air monitoring network,
located at the Burlington Main Street, Rutland and Underhill sites. The CO analyzers are operated year-
round. CO concentrations are determined by a continuous infra-red method (See Table 15 – Carbon
Monoxide Monitoring Method).
The current national primary ambient air quality standards for carbon monoxide are as follows:
9 parts per million for an 8-hour average concentration not to be exceeded more than once per
year and 35 parts per million for a 1-hour average concentration not to be exceeded more than
once per year.
Table 15 – Carbon Monoxide Monitoring Method
Analytical Location/Reported
Pollutant Sampler Collection
Method Data Interval
Teledyne-API Infra-red(Gas
Model T300 Automated Burlington & Rutland/1
Carbon Monoxide Continuous filter
Reference Method: Hour
RFCA-1093-093 correlation)
Teledyne-API Infra-red(Gas
Model T300U Automated
Carbon Monoxide (trace) Continuous filter Underhill/1 Hour
Reference Method:
RFCA-1093-093 correlation)
Table 16 – Carbon Monoxide Design Value 2017 (Preliminary-based on 2nd max 1-hour and 8-hour averages)
Site 2017 Design Value-(2nd maximum PPM)
Burlington CO -1 Hour 1.0
Burlington CO -8 Hour 0.6
Rutland CO -1 Hour 1.5
Rutland CO -8 Hour 0.7
Underhill CO -1 Hour 0.649
Underhill CO -8 Hour 0.4
Source: EPA AQS AMP450Vermont Annual Air Monitoring Network Plan 2018
Revision 1, July 1, 2018
Page 25 of 45
Sulfur Dioxide Monitoring Network
The Vermont AQCD operates two (2) sulfur dioxide (SO2) analyzers in the air monitoring network,
located in Rutland and Underhill sites. The SO2 analyzers are operated year-round. SO2 concentrations
are determined by a continuous pulsed florescence method (Table 17 – Sulfur Dioxide Monitoring
Method
The level of the national primary 1-hour annual ambient air quality standard for oxides of sulfur is 0.075
parts per million, measured in the ambient air as sulfur dioxide (SO2). The secondary standard is 0.500
parts per million.
The 1-hour primary standard is met at an ambient air quality monitoring site when the three-year
average of the annual (99th percentile) of the daily maximum 1-hour average concentrations is less than
or equal to 75 ppb, as determined in accordance with 40 CFR Part 50 Appendix T. The SO2 design
values are presented in Table 18.
Table 17 – Sulfur Dioxide Monitoring Method
Analytical Location/Reported
Pollutant Sampler Collection
Method Data Interval
Teleydyne-API
T100U Continuous Pulsed
Sulfur Dioxide (trace) Automated Equivalent Underhill/1 Hour
sampling Florescence
Method:
EQSA-0495-100
Teleydyne-API T100
Automated Equivalent Continuous Pulsed
Sulfur Dioxide Rutland/1 Hour
Method: sampling Florescence
EQSA-0495-100
Table 18 – Sulfur Dioxide Design Values 2017
Design Values (SO2 PPB)
Site Average of Years 2015-2017 1 Hour 99th
Percentile Daily Max
Rutland – 1 Hour 2
Underhill – 1 Hour 2
Source: EPA AQS AMP480.Vermont Annual Air Monitoring Network Plan 2018
Revision 1, July 1, 2018
Page 26 of 45
Monitoring Site Parameter Information
Below in Table 19 is a list of all of the monitoring sites and parameters currently operated by the State of Vermont or National Forest
Service. The monitoring sites are listed in alphabetical order by site name.
Table 19 – Network Ambient Air Pollutant Monitoring By Location
Nitrogen Dioxide / or
Speciation (STN /or
PM 10-2.5Difference
Relative Humidity
Carbon Monoxide
Volume/(metals)
Wind Direction
Solar Radiation
Sulfur Dioxide
Black Carbon
(Continuous)
Temperature
Precipitation
Wind Speed
IMPROVE)
PM2.5 FRM
PM2.5 FEM
PM10 FRM
PM10 Low
Carbonyl
Pressure
Ozone
BTEX
VOC
PAH
NOy
Bennington Airport Road
Burlington 150 So Winooski Ave C C
Burlington 108 Cherry Street D D D D D D D
Dover Mount Snow 1
Rutland Merchants Row C
Underhill Harvey Road T T T C C
T=Trace Level C=Collocation D=Discontinued 1= Operated by U. S. Forest ServiceVermont Annual Air Monitoring Network Plan 2018
Revision 1, July 1, 2018
Page 27 of 45
Site Description: Burlington – 150 South Winooski Ave.
Town – Site: Burlington – South Winooski Ave
County: Chittenden Latitude: +44.476200
Address: 150 S. Winooski Ave. Longitude: -73.210600
AQS Site ID: 50-007-0014 Elevation: 63.1 m
Spatial Scale: Urban and City Center Year Established: 2003
Statistical Area: Burlington-South Burlington, VT Metropolitan NECTA
Carbon Monoxide
Relative Humidity
VOC (collocated)
Nitrogen Dioxide
Volume/(metals)
Precipitation
Wind Direction
Solar Radiation
Sulfur Dioxide
Black Carbon
Temperature
Wind Speed
(collocated)
Location Site
Continuous
PM2.5 FEM
PM10 FRM
PM10 Low
Carbonyl
Pressure
BTEX
Ozone
150 S.
Burlington
Winooski
Site Description:
This site is located in a municipal parking lot of downtown Burlington, VT, located 1 km east of Lake Champlain, 1.5 km south
west of McNeil Generating Station, 2 km west of I-89, and 8 km west of the Essex IBM plant. This site is designated to
represent middle and neighborhood-scale. The monitoring location meets all siting requirements and criteria and has been
approved by VTAQCD and EPA Region 1.
General Monitoring Description & Objectives:
The Burlington monitoring site objective for the CO & NO2 measurements is compliance and trends purposes. Historically, CO
and NO2 measurements at this site are well below the NAAQS. Monitoring for CO and NO2 at this site continues to be operated
primarily for trends analysis and modeling. The objective of the PM10 monitoring is for trends analysis and subsequent metals
analysis. The monitoring objective for the VOC and Carbonyl sample collection and analysis is to assess long-term population
exposure on a neighborhood scale, comparison to applicable state standards and trend assessment. Continuous PM2.5 is used for
NAAQS compliance, AQI and air quality forecasting. WS/WD/Temp/RH data is collected from a 3.0 meter tripod on the roof.
Plans/History:
• Site established in 2003
• December 31, 2016 suspended 2025iD dichotomous sampler. January, 2017 installed 2025i FRM configured for PM10,
then replaced that with 2000i on May 10, 2017, configured for PM2.5
• T640 FEM continuous PM2.5.installed on 8/22/17, 2000i configured for PM2.5 from this date through 4/14/18
• PM10 metals added in 2018Vermont Annual Air Monitoring Network Plan 2018
Revision 1, July 1, 2018
Page 28 of 45
Figure 2– Burlington Aerial Photo Figure 3– Burlington Monitoring ShelterVermont Annual Air Monitoring Network Plan 2018
Revision 1, July 1, 2018
Page 29 of 45
Site Description: Burlington – 108 Cherry Street.
Town – Site: Burlington – Zampieri State Office Building
County: Chittenden Latitude: +44.480278
Address: 108 Cherry St. Longitude: -73.214444
AQS Site ID: 50-007-0012 Elevation: 81.4 m
Spatial Scale: Urban & Center City Year Established: 1999
Statistical Area: Burlington-South Burlington, VT Metropolitan NECTA
Speciation (IMPROVE)
PM10 Low Volume
Relative Humidity
Carbon Monoxide
Nitrogen Dioxide
Speciation (STN)
Precipitation
Wind Direction
Solar Radiation
Sulfur Dioxide
Black Carbon
PM2.5 TEOM
Temperature
Wind Speed
Location Site
PM2.5 FRM
PM10 FRM
Carbonyl
Pressure
Ozone
VOC
108 Cherry D D D D D D D
Burlington
St.
Site Description:
This site is located on the roof of the Zampieri State Office Building in Burlington. The monitoring site is located 15 meters above
street level, 0.25 km from Lake Champlain, 1.2 km south west of McNeil Generating Station, 2.5 km west of I-89, and 8.5 km west of
the Essex IBM plant. The site represents a neighborhood scale. This monitoring location meets all siting requirements and criteria and
has been approved by VTAQCD and EPA Region 1
General Monitoring Description & Objectives:
The speciation monitoring objective is PM2.5 trends analysis and complimentary data for PM2.5 FEM data at the Burlington Main
Street Site. The speciation sampling is conducted as part of the EPA Speciation Trends Network (STN).
Plans/History:
• Site established 1999
• Discontinued collocated PM2.5 FRM samplers on 12/31/16; samplers relocated to Underhill for PM10
• Discontinued Meterological parameters 12/31/17You can also read