FINAL TNUOS TARIFFS FOR 2021/22 - NATIONAL GRID ELECTRICITY SYSTEM OPERATOR JANUARY 2021 - NATIONAL GRID ESO
←
→
Page content transcription
If your browser does not render page correctly, please read the page content below

Final TNUoS Tariffs for 2021/22

National Grid Electricity System Operator
January 2021

| Final TNUoS Tariffs for 2021/22 0
Contents
Executive summary ................................................................................................ 3

Charging Methodology Changes ............................................................................ 5

Generation tariffs ................................................................................................... 8
1. Generation tariffs summary ......................................................................................................... 9
2. Generation wider tariffs................................................................................................................ 9
3. Changes to wider tariffs since the Draft tariffs tariff forecast ..................................................... 10

Onshore local tariffs for generation ...................................................................... 12
4. Onshore local substation tariffs ................................................................................................. 12
5. Onshore local circuit tariffs ........................................................................................................ 12

Offshore local tariffs for generation ...................................................................... 13
6. Offshore local generation tariffs ................................................................................................. 13

Demand tariffs ...................................................................................................... 15
7. Demand tariffs summary............................................................................................................ 16
8. Changes since Draft Tariffs ....................................................................................................... 17
9. Half-Hourly demand tariffs ......................................................................................................... 17
10. Embedded Export Tariffs (EET) ................................................................................................ 18
11. Non-Half-Hourly demand tariffs ................................................................................................. 19

Overview of data input ......................................................................................... 21
12. Changes affecting the locational element of tariffs .................................................................... 22
13. Adjustments for interconnectors ................................................................................................ 22
14. Expansion Constant................................................................................................................... 23
15. Onshore substation tariffs .......................................................................................................... 23
16. Offshore local tariffs ................................................................................................................... 23
17. Allowed transmission revenues ................................................................................................. 23
18. Generation / Demand (G/D) Split .............................................................................................. 25
19. Charging bases for 2020/21 ...................................................................................................... 26
20. Annual Load Factors.................................................................................................................. 27
21. Generation adjustment and demand residual............................................................................ 27

Tools and supporting information ......................................................................... 30

Further information ............................................................................................... 31

Appendix A: Background to TNUoS charging ...................................................... 32

Appendix B: Changes and proposed changes to the charging methodology ....... 38

Appendix C: Breakdown of locational HH and EE tariffs ...................................... 40

Appendix D: Locational demand profiles .............................................................. 42

Appendix E: Annual Load Factors ........................................................................ 44

Appendix F: Contracted generation changes since the Draft tariffs ..................... 46

January 2021 | Final TNUoS Tariffs for 2021/22 1

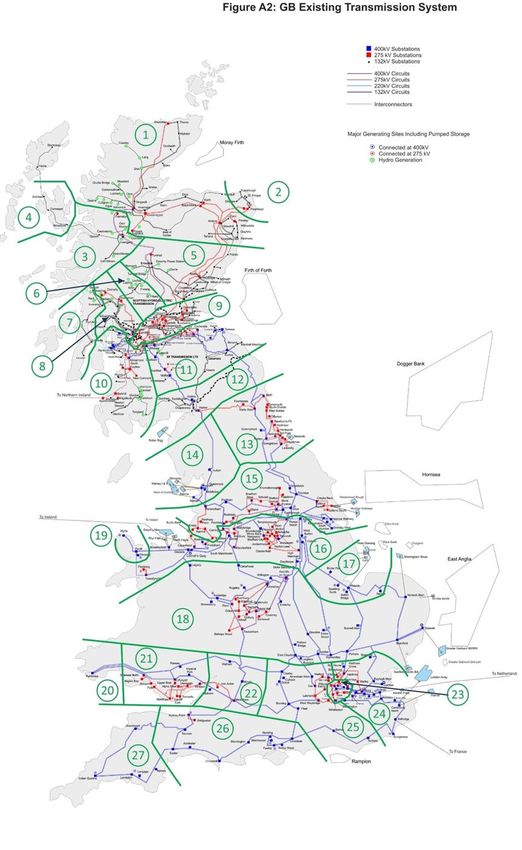
Appendix G Transmission company revenues ..................................................... 48

Appendix H: Generation zones map .................................................................... 55

Appendix I: Demand zones map .......................................................................... 57

Appendix J: Quarterly Changes to TNUoS parameters........................................ 59

List of Tables
Table 1 Summary of generation tariffs .............................................................................................. 9
Table 2 Generation wider tariffs ...................................................................................................... 10
Table 3 Generation wider tariff changes since Draft tariffs ............................................................. 11
Table 4 Local substation tariffs ........................................................................................................ 12
Table 5 Onshore local circuit tariffs ................................................................................................. 13
Table 6 Circuits subject to one-off charges ..................................................................................... 13
Table 7 Offshore local tariffs 2021/22 ............................................................................................. 14
Table 8 Summary of demand tariffs ................................................................................................ 16
Table 9 Demand tariffs .................................................................................................................... 16
Table 10 Half-Hourly demand tariffs................................................................................................ 17
Table 11 Embedded Export Tariffs.................................................................................................. 18
Table 12 Changes to Non-Half-Hourly demand tariffs .................................................................... 19
Table 13 Contracted TEC ................................................................................................................ 22
Table 14 Interconnectors ................................................................................................................. 23
Table 15 Allowed revenues ............................................................................................................. 25
Table 16 Generation and demand revenue proportions ................................................................. 26
Table 17 Charging bases ................................................................................................................ 27
Table 18 Residual components calculation ..................................................................................... 29
Table 19 Summary of concluded CUSC modification proposals impacting 2021/22 tariffs ............ 39
Table 20 Demand HH locational tariffs............................................................................................ 41
Table 21 Breakdown of the EET ..................................................................................................... 41
Table 22 Demand profile ................................................................................................................. 43
Table 23 Generic ALFs for 2021/22 ................................................................................................ 45
Table 24 NGESO revenue breakdown ............................................................................................ 49
Table 25 NGET revenue breakdown ............................................................................................... 51
Table 26 SPT revenue breakdown .................................................................................................. 52
Table 27 SHETL revenue breakdown ............................................................................................. 53
Table 28 Offshore revenues ............................................................................................................ 54

List of Figures
Figure 1 Variation in generation zonal tariffs ................................................................................... 11
Figure 2 Changes to gross Half-Hourly demand tariffs ................................................................... 18
Figure 3 Embedded export tariff changes ....................................................................................... 19
Figure 4 Changes to Non-Half-Hourly demand tariffs ..................................................................... 20

January 2021 | Final TNUoS Tariffs for 2021/22 2
Executive summary
The Transmission Network Use of System (TNUoS) charge is
designed to recover the cost of installing and maintaining the
transmission system in England, Wales, Scotland and offshore. It
is applicable to transmission connected generators and
suppliers for use of the transmission networks. This document
contains the Final TNUoS Tariffs for 2021/22.

Under the National Grid Electricity System • CMP357 – To improve accuracy of the
Operator (NGESO) licence condition C4 and Locational Security Factor
Connection and Use of System Code
(CUSC) paragraph 14.29, we publish the COVID19 Impact
Final TNUoS tariffs for year 2021/22 on our
website1. We have been closely monitoring the impact
 of COVID19 on the transmission networks. In
These tariffs will take effect from 1st April these Final Tariffs, we have applied our best
2021. view on the demand and generation forecast.

Price Control Impact We currently forecast -2.75% (~£77m)
 under-recovery of TNUoS for the current
The charging year 2021/22 is the first year in year 2020/21. This number will be revised at
the new RIIO-2 price control period for the the next TNUoS tariff forecast. Any under-
transmission owners (TOs) and NGESO. In recovery will be recovered in charging year
this report, the various parameters have 2022/23.
been re-set in line with the CUSC. Please
see New Price Control RIIO2 section on Total TNUoS Revenue
page 7 for details.
 Total revenue to be collected is £3,318m
Regulatory Changes Implementation based on TOs’ and OFTOs’ final
 submissions. It is an increase from 2021/21
A number of regulatory changes have been but a decrease of £92m compared to the
implemented in the Final Tariffs including, Draft tariffs - following Ofgem’s Final
Transmission Generation Residual (TGR). Determination on TOs’ business plans.
Ofgem’s decision on the Targeted Charging
Review (TCR) affects TNUoS tariffs in two Generation tariffs
aspects, TGR and the Transmission Demand The revenue to be recovered from
Residual (TDR). The TGR changes are to be generators is £774m, an increase of £399m
implemented from April 2021 and affect from 2020/21 and a decrease of £39m since
generation residual tariffs, while the TDR the Draft tariffs. This increase from 2020/21
changes are expected to be implemented is mainly driven by the implementation of
from April 2022. As such, we have TGR. Local tariffs have been removed from
incorporated the decision of CMP317/327 for the EU generation cap calculation. The
TGR in the Final Tariffs. generation residual has been removed from
In addition, we have also incorporated TNUoS charge, but to ensure compliance
Ofgem’s decisions on: with the EU generation cap, an adjustment
 element has been introduced instead.
• CMP324/325 – Generation Rezoning
 The generation charging base has been
• CMP353 - Stabilising the Expansion updated to 70.1GW based on our best view
 Constant and non-specific Onshore on generation projects for 2021/22. This is a
 Expansion Factors reduction of 1.6GW from the Draft tariffs.
• CMP355/356 – Updating the Indexation With a decrease in revenue to be collected
 methodology for RIIO2 from generation, the average generation

1

https://www.nationalgrideso.com/charging/tra
smission-network-use-system-tnuos-charges

January 2021 | Final TNUoS Tariffs for 2021/22 3
tariff decreased by £0.32/kW to £11.04 /kW Feedback
since the Draft tariffs and the adjustment
tariff decreased by £0.40/kW to -£0.43/kW. We welcome feedback on any aspect of this
 document and the tariff setting processes.
Small Generator Discount We are very aware that TNUoS charging is
 undergoing transition and there will be
As defined in the NGESO’s licence, the
 substantial changes to charging mechanisms
Small Generator Discount (SGD) reduces
 over the next few years, either as a result of
the tariff for transmission connected
 Ofgem’s charging review or through CUSC
generation connected at 132kV and with
 modifications raised from time to time.
Transmission Export Capacity (TEC)
1
Charging Methodology
Changes
January 2021 | Final TNUoS Tariffs for 2021/22 5
TNUoS Charging Methodology
The TNUoS tariff setting methodology defined in the CUSC is subject to open governance. We are
obliged to comply with the latest approved CUSC changes applicable from 1st April 2021 in the
Final Tariffs for 2021/22. This section summarises the key changes to the methodology.

Ofgem’s Targeted Charging Review (TCR)
On 21 November 2019, the Authority published their final decision 2 on the Targeted Charging
Review (TCR) and issued Directions to NGESO to raise changes to the charging methodology to
give effect to that final decision.
Under the TCR, the two changes for TNUoS tariff setting and charges are:
• The removal of the generation residual, which is currently used to keep total TNUoS recovery
 from generators within the range of €0-2.50/MWh. This change has been managed under
 CMP317/327, with the final decision being announced by Ofgem on 17 December 20203, which
 seeks to ensure ongoing compliance with European Regulation by establishing which charges
 are, and are not in scope of that range;
• The creation of specific NHH and HH demand residual charges, levied only to final demand
 (which is consumption not used either to operate a generating station, or to store and export),
 and on a ‘site’ basis. CMP332 (Transmission Demand Residual bandings and allocation) was
 raised and approved to modify the CUSC methodology accordingly. This is due to take effect
 from April 2022.
Our 2021/22 Final tariffs have implemented CMP317/327 which will take effect from April 2021.
The TGR has been set to £0/kW but an adjustment has been introduced to ensure generation
charges are still compliant with the cap. For the purposes of this report we have compared the
adjustment to the generation residual published in the Draft tariffs.
As per Ofgem’s decision on TGR, all Local Charges for Local Circuits and Local Substations paid
by generators have been excluded for the purposes of assessing compliance with the €0-
2.50/MWh range. We have also not included any BSC charges nor any elements of BSUoS
Charges, like Congestion Management costs, in the generation cap.

Other Regulatory Changes
In addition to the above TGR changes, a number of CUSC modification proposals have been
approved by Ofgem through the year and the changes have all been included in this Final Tariffs.
 • CMP324/325 – Generation Rezoning. The generation zonal boundaries remain
 unchanged from RIIO-T1, as a result of CMP325.
 • CMP353 - Stabilising the Expansion Constant and non-specific Onshore Expansion
 Factors. Under this mod, the expansion constant and generic onshore expansion factors
 will remain similar to the values used under RIIO-1.
 • CMP355/356 – Updating the Indexation methodology for RIIO2. This mod has changed
 the inflation indexation, which underpins TNUoS charging parameters, from RPI to CPIH,
 in line with Ofgem’s final determination on RIIO-2.
 • CMP357 – To improve accuracy of the Locational Security Factor. The security factor for
 RIIO-2 was rounded to one decimal place at 1.8. Under this mod, 2d.p. is to be used,
 which changed the value of security factor to 1.76. This value will remain unchanged
 throughout RIIO-2 period.

Charging Parameters Reset
In accordance with the CUSC, at the start of the next price control in April 2021, various aspects of
the TNUoS charging parameters are required to be re-set based on the data for the price-control
and apply from 1 April 2021. The parameters and their changes are listed in the table below.

2 https://www.ofgem.gov.uk/electricity/transmission-networks/charging/targeted-charging-review-significant-code-review
3 https://www.nationalgrideso.com/document/183141/download

January 2021 | Final TNUoS Tariffs for 2021/22 6
Charging Parameters Re-set for RIIO-2
 Component Description Res-set for 2021/22
 Generation zones Number of generation zones. It Following approval of CMP325, the
 was 27 in RIIO1. generation zonal boundaries have
 been fixed and remain as 27.
 Expansion Constant The expansion constant and In accordance with Ofgem’s
 and Factors expansion factors need to be decision on CMP353 and CMP
 recalculated based on TOs’ 355/356, the expansion constant
 business plans and costs of for RIIO-1 (inflated by RPI from
 investments. The expansion 2013/14 to 2020/21) continues with
 constant represents the cost of CPIH uplift from 1st April 2021 and
 moving 1MW, 1km using 400kV that the expansion factors are
 OHL line. The expansion factors unchanged.
 represent how many times more
 expensive moving 1MW, 1km is
 using different voltages and
 types of circuit.
 Locational Onshore The security factor was 1.8 in Following approval of CMP357
 Security Factor RIIO1. (improving accuracy of the security
 factor), we have applied 2 decimal
 places on the security factor, which
 is 1.76. This value will be fixed
 during the RIIO period.
 Local Substation Local Substation tariffs will be The local substation tariffs have
 Tariffs recalculated in preparation for been updated based on TOs data
 the start of the price control submitted as part of the RIIO-2
 based on TO asset costs. parameter refresh. The annuity
 and overhead factors that feed into
 these tariffs have been updated to
 reflect Ofgem’s Final
 Determination.
 Offshore Local tariffs The elements for the offshore The offshore tariffs have been
 tariffs have been recalculated for recalculated to adjust for
 the new price control, based on differences in actual OFTO
 updated forecasts of OFTO revenue to forecast revenue in
 revenue. It includes adjustments RIIO-T1.
 for differences in actual OFTO
 revenue to forecast revenue in We have recalculated the Offshore
 RIIO-T1, including approved substation discount and included it
 Income Adjusting Events and in the offshore local tariffs in this
 Exception Event Claims. report.
 Avoided GSP The AGIC is a component of the The RIIO-2 AGIC parameter has
 Infrastructure Credit Embedded Export Tariff, paid to been updated for Final Tariffs,
 (AGIC) ‘exporting demand’ at the time of based on the final determination.
 Triad. It will be recalculated From 1st April 2021, CPIH inflation
 based on up to 20 schemes will be applied.
 from the RIIO-2 price control
 period.

January 2021 | Final TNUoS Tariffs for 2021/22 7
2
Generation tariffs
Wider tariffs, onshore local circuit and substation tariffs, and
offshore local tariffs
January 2021 | Final TNUoS Tariffs for 2021/22 8
1. Generation tariffs summary
This section summarises the generation tariffs for 2021/22 and how these tariffs were calculated.
The tariffs include the implementation of Ofgem’s decision for the Transmission Generation
Residual (TGR) which does increase the amount generators pay for TNUoS compared to 2020/21.
As part of our tariff setting, we have excluded all local onshore and local offshore tariffs from the
European €2.50/MWh cap for generator transmission charges and set the Generation Residual to
£0/kW as agreed under CMP317/327. However, to ensure compliance with the EU cap there is a
negative adjustment required. For the purpose of this report, we have compared the adjustment
with the generation residual published in the Draft tariffs.
Table 1 Summary of generation tariffs

Generation Tariffs Change since
 2021/22 Draft 2021/22 Final
(£/kW) last forecast

 Adjustment - 0.027640 - 0.432600 - 0.404959
 Average Generation Tariff* 11.351149 11.035859 - 0.315290
*N.B. These generation average tariffs include local tariffs
The average generation tariff is calculated by dividing the total revenue payable by generation
over the generation charging base in GW.
Average generation tariffs have decreased by £0.32/kW. This is mainly driven by a decrease in the
generation output from 220TWh to 200TWh, which has taken into consideration of the COVID
impact. These average tariffs include revenues from local tariffs.
Since the Draft tariffs the generation adjustment, previously known as the residual, has decreased
to -0.40/kW due to the expected decrease in generation output in 2021/22.

2. Generation wider tariffs
The following section summarises the wider generation tariffs for 2021/22. A brief description of
generation wider tariff structure can be found in Appendix A.
The wider tariffs are calculated depending on the generator type and made of four components,
two of the components (Year Round Shared Element and Year Round Not Shared Element) are
multiplied by the generator’s specific Annual Load Factor (ALF). The ALF is explained in Appendix
E.
The classifications of generator type are listed below:

 Conventional Carbon Conventional Low Carbon Intermittent

 Biomass Nuclear Offshore wind
 CCGT/CHP Hydro Onshore wind
 Coal Solar PV
 OCGT/Oil Tidal
 Pumped storage (including
 battery storage)

The 80% and 40% ALFs, used in the tables in this section of the report, for the Conventional
Carbon, Conventional Low Carbon and Intermittent example tariffs are for illustration only. Tariffs
for individual generators are calculated using their own ALF.
Please note that the Small Generator Discount is discontinued from 1st April 2021 and has not
been included in the tariffs.

January 2021 | Final TNUoS Tariffs for 2021/22 9
Table 2 Generation wider tariffs
 Tariffs (£/kW)
 Example tariffs for a generator of each technology type
 Conventional Conventional
 Intermittent 40%
 System Shared Not Shared Carbon 80% Low Carbon 80%
 Adjustment
 Peak Year Round Year Round Tariff Tariff Tariff
 Zone Zone Name
 (£/kW) (£/kW) (£/kW)
 1 North Scotland 4.126082 19.849130 18.845468 - 0.432600 34.649160 38.418254 26.352520
 2 East Aberdeenshire 3.151849 10.476562 18.845468 - 0.432600 26.176873 29.945967 22.603493
 3 Western Highlands 3.841775 18.124856 18.137065 - 0.432600 32.418712 36.046125 24.954407
 4 Skye and Lochalsh - 0.600287 18.124856 19.911917 - 0.432600 29.396531 33.378915 26.729259
 5 Eastern Grampian and Tayside 4.627928 13.372520 15.294671 - 0.432600 27.129081 30.188015 20.211079
 6 Central Grampian 4.271604 14.302078 16.361775 - 0.432600 28.370086 31.642441 21.650006
 7 Argyll 2.644528 12.371769 24.994839 - 0.432600 32.105214 37.104182 29.510947
 8 The Trossachs 3.758239 12.371769 14.104429 - 0.432600 24.506597 27.327483 18.620537
 9 Stirlingshire and Fife 2.666380 10.932125 12.879423 - 0.432600 21.283018 23.858903 16.819673
 10 South West Scotlands 2.952740 11.283085 13.150169 - 0.432600 22.066743 24.696777 17.230803
 11 Lothian and Borders 2.920257 11.283085 6.510723 - 0.432600 16.722703 18.024848 10.591357
 12 Solway and Cheviot 2.524162 7.605300 7.294685 - 0.432600 14.011550 15.470487 9.904205
 13 North East England 3.345180 5.886920 4.405551 - 0.432600 11.146557 12.027667 6.327719
 14 North Lancashire and The Lakes 2.484799 5.886920 1.250164 - 0.432600 7.761866 8.011899 3.172332
 15 South Lancashire, Yorkshire and Humber 3.791173 2.396756 0.347999 - 0.432600 5.554377 5.623977 0.874101
 16 North Midlands and North Wales 3.167807 0.864623 - - 0.432600 3.426905 3.426905 - 0.086751
 17 South Lincolnshire and North Norfolk 1.311261 1.550670 - - 0.432600 2.119197 2.119197 0.187668
 18 Mid Wales and The Midlands 1.624967 1.788458 - - 0.432600 2.623133 2.623133 0.282783
 19 Anglesey and Snowdon 4.790020 1.007415 - - 0.432600 5.163352 5.163352 - 0.029634
 20 Pembrokeshire 7.437664 - 6.301681 - - 0.432600 1.963719 1.963719 - 2.953272
 21 South Wales & Gloucester 3.411188 - 6.636984 - - 0.432600 - 2.330999 - 2.330999 - 3.087394
 22 Cotswold 2.274785 3.515931 - 8.455582 - 0.432600 - 2.109536 - 3.800652 - 7.481810
 23 Central London - 3.681071 3.515931 - 5.511826 - 0.432600 - 5.710387 - 6.812752 - 4.538054
 24 Essex and Kent - 3.332257 3.515931 - - 0.432600 - 0.952112 - 0.952112 0.973772
 25 Oxfordshire, Surrey and Sussex - 0.985430 - 1.875819 - - 0.432600 - 2.918685 - 2.918685 - 1.182928
 26 Somerset and Wessex - 2.246762 - 3.309922 - - 0.432600 - 5.327300 - 5.327300 - 1.756569
 27 West Devon and Cornwall - 2.524900 - 8.311269 - - 0.432600 - 9.606515 - 9.606515 - 3.757108

3. Changes to wider tariffs since the Draft tariffs tariff forecast
The following section provides details of the wider and local generation tariffs in the Final tariffs for
2021/22 and explains how these have changed since the Draft tariffs.
The next table and chart show the changes in wider generation TNUoS tariffs since the Draft tariffs
with the example Conventional Carbon, Conventional Low Carbon and Intermittent tariffs. The
Conventional tariffs use a load factor of 80%, and the Intermittent tariffs use a 40% load factor. All
the examples are for illustration purposes only.
The Generation tariffs in the below table include the impact of the TCR, where the TGR has
become £0/kW, and there is now a negative adjustment factor to ensure compliance with the
European €2.50 cap.

January 2021 | Final TNUoS Tariffs for 2021/22 10
Table 3 Generation wider tariff changes since Draft tariffs
 Wider Generation Tariffs (£/kW)
 Conventional Carbon 80% Conventional Low Carbon 80% Intermittent 40%
 Change in
 2021/22 2021/22 2021/22 2021/22 2021/22 2021/22
Zone Zone Name Change Change Change Adjustment
 Draft Final Draft Final Draft Final

 1 North Scotland 35.967563 34.649160 - 1.318403 39.834795 38.418254 - 1.416541 27.454899 26.352520 - 1.102379 - 0.404959
 2 East Aberdeenshire 27.274678 26.176873 - 1.097805 31.141910 29.945967 - 1.195943 23.608256 22.603493 - 1.004764 - 0.404959
 3 Western Highlands 33.679039 32.418712 - 1.260327 37.400901 36.046125 - 1.354776 26.020383 24.954407 - 1.065975 - 0.404959
 4 Skye and Lochalsh 30.578168 29.396531 - 1.181636 34.664243 33.378915 - 1.285328 27.841447 26.729259 - 1.112187 - 0.404959
 5 Eastern Grampian and Tayside 28.251680 27.129081 - 1.122599 31.390261 30.188015 - 1.202246 21.153550 20.211079 - 0.942471 - 0.404959
 6 Central Grampian 29.524998 28.370086 - 1.154912 32.882557 31.642441 - 1.240116 22.629944 21.650006 - 0.979937 - 0.404959
 7 Argyll 33.357379 32.105214 - 1.252164 38.486507 37.104182 - 1.382325 30.695563 29.510947 - 1.184616 - 0.404959
 8 The Trossachs 25.560912 24.506597 - 1.054314 28.455246 27.327483 - 1.127763 19.521593 18.620537 - 0.901056 - 0.404959
 9 Stirlingshire and Fife 22.253400 21.283018 - 0.970381 24.896354 23.858903 - 1.037451 17.673839 16.819673 - 0.854166 - 0.404959
 10 South West Scotlands 23.057531 22.066743 - 0.990788 25.756044 24.696777 - 1.059267 18.095675 17.230803 - 0.864872 - 0.404959
 11 Lothian and Borders 17.574346 16.722703 - 0.851643 18.910395 18.024848 - 0.885547 11.283354 10.591357 - 0.691997 - 0.404959
 12 Solway and Cheviot 14.792599 14.011550 - 0.781049 16.289523 15.470487 - 0.819036 10.578309 9.904205 - 0.674104 - 0.404959
 13 North East England 11.853010 11.146557 - 0.706453 12.757062 12.027667 - 0.729395 6.908701 6.327719 - 0.580982 - 0.404959
 14 North Lancashire and The Lakes 8.380190 7.761866 - 0.618324 8.636733 8.011899 - 0.624834 3.671155 3.172332 - 0.498823 - 0.404959
 15 South Lancashire, Yorkshire and Humber 6.115224 5.554377 - 0.560847 6.186636 5.623977 - 0.562659 1.313085 0.874101 - 0.438983 - 0.404959
 16 North Midlands and North Wales 3.932358 3.426905 - 0.505452 3.932358 3.426905 - 0.505452 0.327214 - 0.086751 - 0.413965 - 0.404959
 17 South Lincolnshire and North Norfolk 2.590600 2.119197 - 0.471403 2.590600 2.119197 - 0.471403 0.608778 0.187668 - 0.421110 - 0.404959
 18 Mid Wales and The Midlands 3.107657 2.623133 - 0.484524 3.107657 2.623133 - 0.484524 0.706370 0.282783 - 0.423587 - 0.404959
 19 Anglesey and Snowdon 5.714017 5.163352 - 0.550665 5.714017 5.163352 - 0.550665 0.385818 - 0.029634 - 0.415452 - 0.404959
 20 Pembrokeshire 2.431074 1.963719 - 0.467355 2.431074 1.963719 - 0.467355 - 2.613944 - 2.953272 - 0.339328 - 0.404959
 21 South Wales & Gloucester - 1.975469 - 2.330999 - 0.355530 - 1.975469 - 2.330999 - 0.355530 - 2.751558 - 3.087394 - 0.335836 - 0.404959
 22 Cotswold - 1.748240 - 2.109536 - 0.361296 - 3.483388 - 3.800652 - 0.317264 - 7.260393 - 7.481810 - 0.221416 - 0.404959
 23 Central London - 5.442847 - 5.710387 - 0.267540 - 6.573915 - 6.812752 - 0.238837 - 4.239989 - 4.538054 - 0.298064 - 0.404959
 24 Essex and Kent - 0.560679 - 0.952112 - 0.391433 - 0.560679 - 0.952112 - 0.391433 1.415351 0.973772 - 0.441578 - 0.404959
 25 Oxfordshire, Surrey and Sussex - 2.578457 - 2.918685 - 0.340228 - 2.578457 - 2.918685 - 0.340228 - 0.797504 - 1.182928 - 0.385423 - 0.404959
 26 Somerset and Wessex - 5.049785 - 5.327300 - 0.277514 - 5.049785 - 5.327300 - 0.277514 - 1.386082 - 1.756569 - 0.370487 - 0.404959
 27 West Devon and Cornwall - 9.440421 - 9.606515 - 0.166094 - 9.440421 - 9.606515 - 0.166094 - 3.438710 - 3.757108 - 0.318398 - 0.404959

Figure 1 Variation in generation zonal tariffs

January 2021 | Final TNUoS Tariffs for 2021/22 11
Locational changes
The locational tariffs have changed since the Draft tariffs due to the update in indexation of the
Expansion Factor from RPI to CPIH as per Ofgem’s Final Determinations via CMP355/356 and the
slight decrease in Security Factor, which has been changed to 2 decimal places (from 1.8 to 1.76).
This resulted in the locational tariffs becoming less polarised, decreasing in the North and
becoming less negative in the South.
Adjustment changes
The Adjustment has replaced the Generation Residual to ensure compliance with the European
€2.50 cap as part of CMP317/327. In the Draft tariffs we still referred to the Adjustment as the
Residual, so in this report we are comparing the Adjustment to the Residual published in the Draft
tariffs.
There has been a decrease in the Adjustment compared to Draft tariffs. This has mainly been
driven by the decrease in generation output, from 220TWh to 200MWh, to take into consideration
the impact of COVID in majority of the zones.
The change in the locational tariffs combined with the decrease in the Adjustment has overall
meant a decrease in tariffs across all zones. This has resulted in £39m less revenue being
collected from generators.

Onshore local tariffs for generation

4. Onshore local substation tariffs
Onshore local substation tariffs reflect the cost of the first transmission substation that each
transmission connected generator connects to. They are recalculated in preparation for the start of
the price control based on TO asset costs and then inflated each year by the average May to
October CPIH (changed from RPI through Ofgem’s decision in Final Determination and through
CMP355/356) for the rest of the price control period.
There have been two key factors in the reduction these tariffs. Since the publishing of the Draft
Tariffs, there has been an update and recalculation of the TO’s input data that feeds into the
resetting of the local substation tariffs, which has resulting in an overall reduction. In addition to
this, the change from RPI to CPIH has also reduced tariffs. These reductions have been offset by
a slight increase in the annuity factor that is used as part of the local substation tariffs calculation.
This increase is due to the change in the TO’s WACC from the Draft Determination to the Final
Determination.
Table 4 Local substation tariffs
 2021/22 Local Substation Tariff (£/kW)
Substation Rating Connection Type 132kV 275kV 400kV
 =1320 MW Redundancy n/a 0.324421 0.233338

5. Onshore local circuit tariffs
Where a transmission-connected generator is not directly connected to the Main Interconnected
Transmission System (MITS) nodes, the onshore local circuit tariffs reflect the cost and flows on
circuits between its connection and the MITS nodes. Local circuit tariffs can change as a result of
system power flows and TNUoS parameters.
Depending on the topology, onshore local circuits with circuit redundancy had tariff changes as a
result of CMP357, which changed with the security factor from 1.8 to 1.76.
Onshore local circuit tariffs are listed in the table below.

January 2021 | Final TNUoS Tariffs for 2021/22 12
Table 5 Onshore local circuit tariffs
 Substation Name (£/kW) Substation Name (£/kW) Substation Name (£/kW)
 Aberarder 1.687707 Dunhill 1.428190 Marchwood 0.380561
 Aberdeen Bay 2.599821 Dunlaw Extension 1.506420 Mark Hill 0.892884
 Achruach 4.281723 Edinbane 6.979995 Middle Muir 2.343260
 Aigas 0.666962 Ewe Hill 2.482000 Middleton 0.151561
 An Suidhe -0.957481 Fallago 0.436827 Millennium South - 0.466475
 Arecleoch 2.118020 Farr 3.555132 Millennium Wind 1.861916
 Baglan Bay -0.144809 Fernoch 4.485470 Moffat 0.194223
 Beinneun Wind Farm 1.531122 Ffestiniogg 0.252269 Mossford 2.870988
 Bhlaraidh Wind Farm 0.658421 Finlarig 0.326533 Nant - 1.252189
 Black Hill 1.548514 Foyers 0.292072 Necton 1.120435
 Black Law 1.781935 Galawhistle 3.568307 New Deer 0.189751
 BlackCraig Wind Farm 6.419564 Glen Kyllachy - 0.466475 Rhigos 0.105170
 BlackLaw Extension 3.778824 Glendoe 1.875799 Rocksavage 0.018050
 Clyde (North) 0.111836 Glenglass 4.797660 Saltend 0.017301
 Clyde (South) 0.129333 Gordonbush 0.069371 Sandy Knowe 2.378871
 Corriegarth 2.954342 Griffin Wind 9.683862 South Humber Bank - 0.184873
 Corriemoillie 1.658940 Hadyard Hill 2.822639 Spalding 0.282588
 Coryton 0.050448 Harestanes 2.577911 Strathbrora - 0.048161
 Cruachan 1.819382 Hartlepool 0.088865 Strathy Wind 1.778564
 Crystal Rig 0.140871 Invergarry 0.373180 Stronelairg 1.089736
 Culligran 1.767466 Kilgallioch 1.073265 Wester Dod 0.487877
 Deanie 2.903694 Kilmorack 0.201399 Whitelee 0.108228
 Dersalloch 2.456454 Kype Muir 1.512589 Whitelee Extension 0.300875
 Dinorwig 2.392364 Langage - 0.336194
 Dorenell 2.092586 Lochay 0.373180
 Dumnaglass 1.155822 Luichart 0.571838

As part of their connection offer, generators can agree to undertake one-off payments for certain
infrastructure cable assets, which affect the way they are modelled in the Transport and Tariff
model. This table shows the circuits which have been amended in the model to account for the
one-off charges that have already been made to the generators. For more information please see
CUSC sections 2.14.4, 14.4, and 14.15.15.
Table 6 Circuits subject to one-off charges
 Amendment in Transport
 Node 1 Node 2 Actual Parameters Generator
 Model
 Dyce 132kV Aberdeen Bay 132kV 9.5km of Cable 9.5km of OHL Aberdeen Bay
 Crystal Rig 132kV Wester Dod 132kV 3.9km of Cable 3.9km of OHL Aikengall II
 Wishaw 132kV Blacklaw 132kV 11.46km of Cable 11.46km of OHL Blacklaw
 Farigaig 132kV Corriegarth 132kV 4km Cable 4km OHL Corriegarth
 Elvanfoot 275kV Clyde North 275kV 6.2km of Cable 6.2km of OHL Clyde North
 Elvanfoot 275kV Clyde South 275kV 7.17km of Cable 7.17km of OHL Clyde South
 Farigaig 132kV Dunmaglass 132kV 4km Cable 4km OHL Dunmaglass
 Coalburn 132kV Galawhistle 132kV 9.7km cable 9.7km OHL Galawhistle II
 Moffat 132kV Harestanes 132kV 15.33km cable 15.33km OHL Harestanes
 Coalburn 132kV Kype Muir 132kV 17km cable 17km OHL Kype Muir
 Coalburn 132kV Middle Muir 132kV 13km cable 13km OHL Middle Muir
 Melgarve 132kV Stronelairg 132kV 10km cable 10km OHL Stronelairg
 East Kilbride South 275kV Whitelee 275kV 6km of Cable 6km of OHL Whitelee
 East Kilbride South 275kV Whitelee Extension 275kV 16.68km of Cable 16.68km of OHL Whitelee Extension
 Sandy Knowe 132kV Glen Glass 132kV 7km of cable 7km of OHL Sandy Knowe

Offshore local tariffs for generation
6. Offshore local generation tariffs
The local offshore tariffs (substation, circuit and Embedded Transmission Use of System) reflect
the cost of offshore networks connecting offshore generation. They are calculated at the beginning
of price review or on transfer to the offshore transmission owner (OFTO). The tariffs are
subsequently indexed each year, in line with the licence of the associated Offshore Transmission
Owner.

The offshore tariffs have been recalculated, in preparation for the RIIO-2 period, to adjust for any
differences in the actual OFTO revenue when compared to the forecast revenue used in RIIO-T1
tariff setting, including any approved Exceptional Events. The Offshore substation discount has
also been recalculated for the RIIO-2 period.

January 2021 | Final TNUoS Tariffs for 2021/22 13
Offshore local generation tariffs associated with projects due to transfer in 2021/22 will be
confirmed once asset transfer has taken place.

Table 7 Offshore local tariffs 2021/22
 Final 2021/22 Changes since Draft Tariffs
Offshore Generator Tariff Component (£/kW) Tariff Component (£/kW)
 Substation Circuit ETUoS Substation Circuit ETUoS

 Barrow 8.836174 46.681052 1.159154 - 0.011169 0.005825 0.000145
 Burbo Bank 11.045154 21.346898 - - 0.012174 0.000316 -
 Dudgeon 16.155283 25.347887 - - 0.058259 - 0.069474 -
 Galloper 16.537117 26.155151 - - 0.012373 - 0.000042 -
 Greater Gabbard 16.473633 38.093075 - 0.018327 0.047959 -
 Gunfleet 19.229393 17.732950 3.314390 - 0.009615 0.002443 0.000457
 Gwynt Y Mor 20.741455 20.506705 - 2.897083 2.796115 -
 Humber Gateway 12.206462 28.005823 - 0.018135 0.066676 -
 Lincs 16.957830 66.640797 - - - -
 London Array 11.499568 39.427611 - 0.024165 0.119010 -
 Ormonde 27.167399 50.781758 0.404688 - 0.008049 0.007858 0.000063
 Race Bank 9.783195 27.172426 - - 0.011638 0.001853 -
 Robin Rigg - 0.596290 33.846655 10.844253 - 0.012346 0.003951 0.001266
 Robin Rigg West - 0.596290 33.846655 10.844253 - 0.012346 0.003951 0.001266
 Sheringham Shoal 25.417212 29.935300 0.650705 - 0.012146 0.000230 0.000005
 Thanet 19.409235 36.363246 0.875391 0.026651 0.070884 0.001706
 Walney 1 23.46442 46.91135 - - 0.01163 0.00139 -
 Walney 2 21.83020 44.42664 - - 0.01231 0.00007 -
 Walney 3 10.04935 20.35939 - - 0.01235 - -
 Walney 4 10.04935 20.35939 - - 0.01235 - -
 West of Duddon Sands 8.98738 44.80090 - 0.09090 0.48263 -
 Westermost Rough 18.27433 31.10058 - - 0.01188 0.00076 -

The final offshore tariffs have been updated with the latest OFTO revenue forecasts. This has
caused the offshore local circuit and ETUoS tariffs to increase slightly. The onshore substation
civils discount has been updated which has caused the offshore substation tariffs to decrease for
most offshore generators.
Due to the inclusion of approved Exceptional Event in the OFTO revenue, the offshore substation
and circuit tariffs for the relevant offshore generators have increased accordingly.

January 2021 | Final TNUoS Tariffs for 2021/22 14
3
Demand tariffs
Half-Hourly (HH), Non-Half-Hourly (NHH) tariffs and the
Embedded Export Tariff (EET)
January 2021 | Final TNUoS Tariffs for 2021/22 15
7. Demand tariffs summary
There are two types of demand Half-Hourly (HH) and Non-Half-Hourly (NHH). The section shows
the tariffs for HH and NHH as well as the tariffs for Embedded Export (EET).
The breakdown of the HH locational tariff into the peak and year-round components can be found
in Appendix C.
Table 8 Summary of demand tariffs
 HH Tariffs 2021/22 Draft 2021/22 Final Change
 Average Tariff (£/kW) 52.460812 51.360891 - 1.099921
 Residual (£/kW) 54.342512 53.231669 - 1.110843
 EET 2021/22 Draft 2021/22 Final Change
 Average Tariff (£/kW) 2.272481 2.144791 - 0.127690
 Phased residual (£/kW) - - -
 AGIC (£/kW) 2.282952 2.282036 - 0.000916
 Embedded Export Volume (GW) 6.658889 6.949440 0.290551
 Total Credit (£m) 15.132202 14.905099 - 0.227103
 NHH Tariffs 2021/22 Draft 2021/22 Final Change
 Average (p/kWh) 6.563620 6.500873 - 0.062747

Table 9 Demand tariffs
 Embedded
 HH Demand NHH Demand
 Zone Zone Name Export Tariff
 Tariff (£/kW) Tariff (p/kWh)
 (£/kW)
 1 Northern Scotland 20.376396 2.723726 -
 2 Southern Scotland 29.300172 3.712996 -
 3 Northern 41.444048 5.139134 -
 4 North West 48.036551 6.039881 -
 5 Yorkshire 48.696198 5.963751 -
 6 N Wales & Mersey 49.452722 6.060647 -
 7 East Midlands 52.428151 6.641922 1.478519
 8 Midlands 53.959972 6.937534 3.010340
 9 Eastern 54.283935 7.355652 3.334302
 10 South Wales 56.236808 6.514291 5.287175
 11 South East 56.772103 7.738980 5.822471
 12 London 59.186350 6.378699 8.236717
 13 Southern 58.865203 7.574864 7.915570
 14 South Western 61.676796 8.488355 10.727163

Residual charge for demand: 53.231669

January 2021 | Final TNUoS Tariffs for 2021/22 16
8. Changes since Draft Tariffs
Overall the demand tariffs have reduced marginally since the Draft, mainly driven by the decrease
in the total revenue from the TOs.
The average HH tariff is set at £51.36/kW, a decrease of £1.10/kW. The average NHH tariff is set
at 6.50p/kWh, a decrease of 0.06p/kWh.
The average Embedded Export Tariff is £2.14/kW, a decrease of £0.13/kW, due to the updated
locational demand tariffs. The total credit for embedded export has seen a smaller reduction to
£14.91m since the Draft, due to an increase in the forecasted Embedded Export volumes.
The Small Generator Discount (SGD) will end on the 31st March 2021. As such SGD is not
included in the Final Tariffs.
Below is a breakdown of the key changes that have impacted HH and NHH demand tariffs:
 • Reduction in TO revenue results in lower demand revenue and subsequently decreased
 demand residual and average tariff
 • Taking into account of COVID19 impact, HH demand charging base have been reduced
 whilst the NHH demand has increased.
 • The combination of reduced average HH tariffs and HH demand volumes have reduced
 revenue from HH demand
 • NHH revenue has not changed, as the overall reduction in demand revenue has been
 offset by the reduction in HH revenue.
 • Change in locational demand profile across zones due to the reduction in Expansion
 Constant and Security Factor.
Details on the updates to the demand charging bases and the rationale behind them can be found
in the demand charging base section on page Error! Bookmark not defined.

9. Half-Hourly demand tariffs
This table and chart show the forecast HH demand Final tariffs for 2021/22 compared to the
2021/22 Draft Tariffs.
Table 10 Half-Hourly demand tariffs

 2021/22 Draft 2021/22 Final Change in
 Zone Zone Name Change (£/kW)
 (£/kW) (£/kW) Residual (£/kW)

 1 Northern Scotland 20.631769 20.376396 - 0.255373 - 1.110843
 2 Southern Scotland 29.787898 29.300172 - 0.487726 - 1.110843
 3 Northern 42.247971 41.444048 - 0.803923 - 1.110843
 4 North West 49.012126 48.036551 - 0.975575 - 1.110843
 5 Yorkshire 49.688949 48.696198 - 0.992751 - 1.110843
 6 N Wales & Mersey 50.465171 49.452722 - 1.012449 - 1.110843
 7 East Midlands 53.518073 52.428151 - 1.089922 - 1.110843
 8 Midlands 55.089779 53.959972 - 1.129807 - 1.110843
 9 Eastern 55.422177 54.283935 - 1.138242 - 1.110843
 10 South Wales 57.425898 56.236808 - 1.189090 - 1.110843
 11 South East 57.975131 56.772103 - 1.203028 - 1.110843
 12 London 60.452238 59.186350 - 1.265888 - 1.110843
 13 Southern 60.122730 58.865203 - 1.257527 - 1.110843
 14 South Western 63.007529 61.676796 - 1.330733 - 1.110843

January 2021 | Final TNUoS Tariffs for 2021/22 17
Figure 2 Changes to gross Half-Hourly demand tariffs

 Changes to HH demand tariffs
 0.00

 -0.20

 -0.40
 Tariff (£/kW)

 -0.60

 -0.80

 -1.00

 -1.20

 -1.40
 1 2 3 4 5 6 7 8 9 10 11 12 13 14
 Demand Zone

 Change (£/kW) Change in Residual (£/kW)

As shown in the figure above, the HH demand tariff has decreased across all zones due to the
reduction in overall demand revenue. The variation across the zones is mainly driven by the
reduction to the expansion constant (EC) value, switching the indexation from RPI to CPIH for
2021/22 and the adjustment of the security factor (SF). The impact is seen in the locational
element of demand tariffs, which forms part of the HH tariff as lower the EC reduces the polarising
impact of demand tariffs across the demand zones.
Having considered the latest available metering data for this winter, the gross HH chargeable
demand has decreased by 0.7GW in comparison with the Draft tariffs and is set at 18.3GW.

10. Embedded Export Tariffs (EET)
The next table and figure shows the final 2021/22 EET compared to the draft tariffs.
Table 11 Embedded Export Tariffs

 2021/22 Draft 2021/22 Final
 Zone Zone Name Change (£/kW)
 (£/kW) (£/kW)

 1 Northern Scotland - - -
 2 Southern Scotland - - -
 3 Northern - - -
 4 North West - - -
 5 Yorkshire - - -
 6 N Wales & Mersey - - -
 7 East Midlands 1.458513 1.478519 0.020006
 8 Midlands 3.030219 3.010340 - 0.019879
 9 Eastern 3.362617 3.334302 - 0.028315
 10 South Wales 5.366338 5.287175 - 0.079163
 11 South East 5.915571 5.822471 - 0.093100
 12 London 8.392678 8.236717 - 0.155961
 13 Southern 8.063170 7.915570 - 0.147600
 14 South Western 10.947969 10.727163 - 0.220806

January 2021 | Final TNUoS Tariffs for 2021/22 18
Figure 3 Embedded export tariff changes

 Changes to Embedded Export tariffs
 0.1

 0.0
 Tariff (£/kW)

 -0.1

 -0.1

 -0.2

 -0.2

 -0.3
 1 2 3 4 5 6 7 8 9 10 11 12 13 14
 Demand Zone

The average EET tariffs is £2.14/kW, a small reduction of £0.13/kW, compared to the Draft. As
stated previously, the change in locational demand and the zonal variance is driven by the updates
made to the EC and SF.
Overall, with the reduction in average tariffs and the increase in Embedded export volumes, the
forecasted EET revenue has reduced by £0.23m to £14.91m. There has been a minimal impact to
the AGIC (Avoided Grid Supply Point Infrastructure Credit).
The amount of metered embedded generation produced at Triads by suppliers and embedded
generators (
Figure 4 Changes to Non-Half-Hourly demand tariffs

 Changes to NHH demand tariffs

 0.06
 0.04
 0.02
 0.00
 Tariff (p/kWh)

 -0.02
 -0.04
 -0.06
 -0.08
 -0.10
 -0.12
 -0.14
 1 2 3 4 5 6 7 8 9 10 11 12 13 14
 Demand Zone

The average NHH tariff for 2021/22 is set at 6.50p/kWh, which is a 0.06p/kWh decrease compared
to Draft tariffs. For NHH, the reduction in overall demand revenue has been offset by the reduction
in HH revenue, meaning that the total revenue for NHH has stayed roughly the same for Final
Tariffs (£1,618m). The slight increase in NHH demand volumes is the main driver for the change in
average NHH tariff. The change in locational demand and the variations in the forecasted HH and
NHH demand volumes at a zonal level has meant that 13 of the 14 zones tariffs have reduced by
varying amounts. However, NHH tariff for zone 12 (London) is showing a slight increase. The
reduction of the HH revenue in zone 12 means that despite of increase in the NHH demand, the
NHH tariff needs to increase to recover increased NHH revenue in zone 12.

January 2021 | Final TNUoS Tariffs for 2021/22 20
4
Overview of data input

January 2021 | Final TNUoS Tariffs for 2021/22 21
Since the Draft tariffs published in November 2020, we have updated:
 • Allowed revenue to be recovered through TNUoS
 • The local substation tariffs
 • The zonal demand and generation charging bases, and
 • Inflation to CPIH for some of the financial parameters, including expansion factor, local
 substation revenue, AGIC and onshore civils discount.
 • The overhead & annuity factors that feed into certain RIIO-2 parameter calculations
For details changes to TNUoS parameters through the regular forecast cycle, please see
Appendix J.

12. Changes affecting the locational element of tariffs
The 2021/22 locational element of generation and demand tariffs is based upon:
• Contracted generation and nodal demand as of 31 October 2020;
• Local and MITS circuits as stated in the ETYS; and
• Inflation

Contracted TEC, modelled TEC and Chargeable TEC
Contracted TEC is the volume of TEC with connection agreements for the 2021/22 period, which
can be found on the TEC register.4 The contracted TEC volumes are based on the 31 October
2020 TEC register.
Modelled TEC is the amount of TEC we have entered into the Transport model to calculate MW
flows, which also includes interconnector TEC. We have forecast our best view of modelled TEC
based on the 31 October 2020 TEC register, in accordance with CUSC 14.15.6.
Chargeable TEC is our best view of the likely volume of generation that will be connected to the
system during 2021/22 and are liable to pay generation TNUoS charges. We have reviewed our
forecast of Chargeable TEC since the Draft tariffs. As a result, the Chargeable TEC is reduced by
1.6WG to 70.1GW.
Table 13 Contracted TEC
 2020/21 2021/22 Tariffs
 Generation (GW) Final March August Draft Final
 Contracted TEC 84.9 93.6 92.7 89.9 89.9
 Modelled Best View TEC 84.9 85.8 86.7 89.9 89.9
 Chargeable TEC 70.7 76.8 76.9 71.7 70.1

13. Adjustments for interconnectors
When modelling flows on the transmission system, interconnector flows are not included in the
Peak model but are included in the Year Round model. Since interconnectors are not liable for
generation or demand TNUoS charges, they are not included in the calculations of chargeable
TEC for either the generation or demand charging bases.
The table below reflects the contracted position of interconnectors for 2021/22 in the
interconnector register as of 31 October 2020,

4See the Registers, Reports and Updates section at
https://data.nationalgrideso.com/data-groups/connection-registers

January 2021 | Final TNUoS Tariffs for 2021/22 22
Table 14 Interconnectors
 Generation MW

 Transport Model

 Transport Model

 Charging Base
 Year Round
 Generation
 Zone

 Peak
 Interconnected
 Interconnector Site System

 IFA Interconnector Sellindge 400kV France 24 0 2000 0
 ElecLink Sellindge 400kV France 24 0 1000 0
 BritNed Grain 400kV Netherlands 24 0 1200 0
 Belgium Interconnector (Nemo) Richborough 400kV Belgium 24 0 1020 0
 East - West Connah's Quay 400kV Republic of Ireland 16 0 505 0
 IFA2 Interconnector Chilling 400KV Substation France 26 0 1100 0
 Moyle Auchencrosh 275kV Northern Ireland 10 0 490 0
 NS Link Blyth Norway 13 0 1400 0

14. Expansion Constant
The expansion constant is the annuitized value of the cost required to transport 1 MW over 1 km.
The 2021/22 Expansion Constant is set to £ 15.050736/MWkm. This is based on the 2020/21
RIIO-1 value (as proposed in CMP353) uplifted by CPIH (as per CMP355/356).

15. Onshore substation tariffs
Onshore Local Substation tariffs have been updated for 2021/22 as part of the RIIO-2 parameter
refresh. They are set in 2020/21 prices and have been uplifted by CPIH for 2021/22 (as per
CMP355/356).

16. Offshore local tariffs
Local offshore circuit tariffs, local offshore substation tariffs and the ETUoS tariff are indexed in
line with the revenue of the relevant Offshore Transmission Owner. These tariffs have been
recalculated, in preparation for the RIIO-2 period, to adjust for any differences in the actual OFTO
revenue when compared to the forecast revenue used in RIIO-T1 tariff setting. These
recalculations use the latest forecast of the relevant inflation terms.

17. Allowed transmission revenues
NGESO recovers revenue on behalf of all onshore and offshore Transmission Owners (TOs &
OFTOs) in Great Britain. Some other revenue (for example, Network Innovation Competition for
network companies including ESO, TOs and DNOs and interconnector revenue adjustment) are
also collected from network users via TNUoS.
Year 2021/22 is the start of RIIO-2 price control period. On 8th December, Ofgem published the
RIIO-2 final determination (FD) for onshore TOs and the ESO5. Onshore TOs’ and the ESO have
since updated their revenue forecast, under the calculation methodology as set out in their
updated draft transmission licences, which is incorporated in the Final Tariffs.

5https://www.ofgem.gov.uk/publications-and-updates/riio-2-final-determinations-transmission-and-
gas-distribution-network-companies-and-electricity-system-operator

January 2021 | Final TNUoS Tariffs for 2021/22 23
CACM pilot project costs
On 22nd January, Ofgem published their decision on costs recovery of some historical CACM
(Capacity Allocation and Congestion Management) pilot projects from TNUoS charges6. The
decision sets out the amount to be paid to IFA, BritNed, Nemo Link via the 2021/22 TNUoS. In the
Final tariffs, we have included the amount of CACM costs in the TNUoS revenue.

Bad debt
In accordance with Ofgem’s Final Determination, the ESO is permitted to recover the TNUoS bad
debt effectively occurred during RIIO1 and forecast bad debt for 2021/2022 via the TNUoS charge.
As such, the bad debt value is included in the Final Tariffs.

Other revenue items in the ESO’s RIIO-2 licence
Following legal separation of the ESO from National Grid Electricity Transmission in 2019, a few
revenue items which was set up in RIIO-T1, and was related to the system operator’s function,
were carried over in NGET’s licence for two years, and will now be handed over back to the ESO
under RIIO-2. These items include the legacy adjustments term, licence fee, business rate etc.
The ESO revenue breakdown table has been updated to reflect the updated ESO licence.

For more details on the breakdown of the TNUoS Revenue, please refer to Appendix G.

6https://www.ofgem.gov.uk/system/files/docs/2021/01/decision_on_assessment_of_ifa_britned_an

d_nemo_links_pilot_project_and_interim_period_cost_recovery_submissions_under_the_capacity
_allocation_and_congestion_management_cacm_regulation_0.pdf

January 2021 | Final TNUoS Tariffs for 2021/22 24
Table 15 Allowed revenues

Please note these figures are rounded to one decimal place.

18. Generation / Demand (G/D) Split
The revenue to be collected from generators and demand suppliers has be updated and finalised
in the Final Tariffs.

The “EU gen cap”
Section 14.14.5 (v) in the CUSC currently limits average annual generation use of system charges
in Great Britain to €2.5/MWh. The revenue that can be recovered from generation dependent on
the €2.5/MWh limit, exchange rate and forecast output of chargeable generation. An error margin
of 20.8% is also applied to reflect revenue and output forecasting accuracy. This revenue figure is
normally referred to as the “EU gen cap”.
The EU generation cap calculation has been updated from the Draft Tariffs due to a reduction in
generation output taking into account COVID19 impact. For details please see the “Generation
Output” paragraph.

TCR implementation - TNUoS generation residual (TGR) change
On 21 November 2019, the Authority published their final decision on the Targeted Charging
Review (TCR) and issued Directions to NGESO to raise changes to the charging methodology to
give effect to that final decision. This includes, among other changes, the removal of generation
residual, which will take effect from April 2021.
This change has been managed under CUSC modification proposals CMP317/327, which seeks
to establish which charges are, and are not in scope of the EU gen cap. The CUSC mods were
approved by Ofgem on 17 December 2020.

January 2021 | Final TNUoS Tariffs for 2021/22 25
Under the CMP317/327 option approved by Ofgem, charges that are collected via generator local
tariffs (including onshore and offshore local substation charges, and onshore and offshore local
circuit charges), will be excluded from the EU gen cap. Therefore, the EU gen cap is only
applicable for charges that are collected via generation wider tariffs.
Due to this TGR change, revenue collected from generators (via wider tariffs and local tariffs) is
much higher compared to 2020/21. In the Final Tariffs, generation revenue is set at £774m, an
increase of £399m from £375m for 2020/21.

Exchange Rate
According to the CUSC methodology, the exchange rate for 2021/22 was taken from the Economic
and Fiscal Outlook, and remains unchanged from Draft tariffs, in line with the CUSC methodology.
The value is €1.210793 /£.

Generation Output
We received comments during the Draft Tariffs webinar, asking us to re-assess the generation
output figure of 222.8TWh. The original forecast was based on the 2020 Future Energy Scenarios
which did not take into account of Covid-19 impacts. Since then, we have carefully considered the
COVID19 impacts on generation and demand. In light of observed delays in new connections and
continued demand suppression, we have revised generation output to 200.0TWh in the Final
Tariffs.

Error Margin
The error margin remains unchanged from Draft tariffs at 20.8%.
The parameters used to calculate the proportions of revenue collected from generation and
demand are shown in the table below.

Table 16 Generation and demand revenue proportions

 2021/22 Tariffs

 Code Revenue March August Draft Final

CAPEC Limit on generation tariff (€/MWh) 2.50 2.50 2.50 2.50
 y Error Margin 16.0% 20.8% 20.8% 20.8%
 ER Exchange Rate (€/£) 1.12 1.21 1.21 1.21
 MAR Total Revenue (£m) 3,053.1 3,048.6 3,410.2 3,318.5
 GO Generation Output (TWh) 199.8 222.8 222.8 200.0
 Wider locational generator Revenue (£m) 403.0 382.3 366.4 357.4
 Charges on assets required for connection (£m) 445.6 462.0 449.3 446.9
 G % of revenue from generation 26.9% 27.1% 23.9% 23.3%
 D % of revenue from demand 73.1% 72.9% 76.1% 76.7%
 Revenue recovered from generation including
 G.R 820.6 826.4 813.7 774.0
 adjustment revenue(£m)
 D.R Revenue recovered from demand (£m) 2,232.6 2,222.2 2,596.5 2,544.5

19. Charging bases for 2020/21
Generation
The forecast generation charging base is less than contracted TEC. It excludes interconnectors,
which are not chargeable, and generation that we do not expect to be chargeable during the
charging year due to closure, termination or delay in connection. It also includes any generators
that we believe may increase their TEC.

January 2021 | Final TNUoS Tariffs for 2021/22 26
You can also read